Near-infrared cross-dispersed spectroscopy of brown dwarf candidates in the Upper Sco association ††thanks: Based on observations obtained with the Gemini Observatory.
Abstract
We present near-infrared (1.15–2.50 microns) medium-resolution (R = 1700) spectroscopy of a sample of 23 brown dwarf candidates in the young Upper Sco association. We confirm membership of 21 brown dwarfs based on their spectral shape, comparison with field dwarfs, and presence of weak gravity-sensitive features. Their spectral types range from M8 to L2 with an uncertainty of a subclass, suggesting effective temperatures between 2700 and 1800 K with an uncertainty up to 300 K and masses in the 30–8 MJup range. Among the non-members, we have uncovered a field L2 dwarf at a distance of 120–140 pc, assuming that it is single. The success rate of our photometric selection based on five photometric passbands and complemented partly by proper motion is over 90%, a very promising result for future studies of the low-mass star and brown dwarf populations in young open clusters by the UKIDSS Galactic Cluster Survey. We observe a large dispersion in the magnitude versus spectral-type relation which is likely the result of the combination of several effects including age dispersion, extent and depth of the association, a high degree of multiplicity and the occurrence of disks.
keywords:
Techniques: spectroscopic — stars: low-mass, brown dwarfs — infrared: stars — galaxy: open clusters and associations: individual (Upper Sco)1 Introduction
Since the discovery of the first genuine brown dwarfs (Rebolo et al., 1995; Nakajima et al., 1995), several hundreds of brown dwarfs have been found isolated in the field (see review by Kirkpatrick, 2005), and as companions (see review by Burgasser et al., 2007). The number of substellar objects unearthed in clusters has increased considerably due to the advent of larger detectors and more efficient instrumentation, allowing for an efficient photometric selection of candidates and then efficient spectroscopic confirmation of the presence of low-gravity features for young (age 10 Myr) brown dwarfs in regions like Orion (Hillenbrand, 1997; Muench et al., 2002; Slesnick et al., 2004), Orionis (Zapatero Osorio et al., 2000; Béjar et al., 2001; Caballero et al., 2007), IC 348 (Luhman et al., 2003; Muench et al., 2003), Taurus (Briceño et al., 2002; Luhman, 2004b; Guieu et al., 2006), Ophiuchus (Luhman & Rieke, 1999; Wilking et al., 2005), Chameleon (Comerón et al., 2004; Luhman, 2004a), and Upper Sco (Slesnick et al., 2006; Lodieu et al., 2006; Lodieu et al., 2007).
The classification of old field L-type dwarfs, a class of objects cooler than M dwarfs with effective temperatures (Teff) between 2200–1500 K (Basri et al., 2000; Leggett et al., 2000) in the field, is now well established at optical wavelengths (Kirkpatrick et al., 1999; Martín et al., 1999). An infrared classification, based on the strength of absorption bands and atomic lines observed at low resolution (R 50–600), was later set up to match the optical spectral types (Reid et al., 2001; Testi et al., 2001; Geballe et al., 2002). In addition, McLean et al. (2003, hereafter M03) produced a homogeneous set of intermediate resolution (R 2000) spectra obtained with the Near-Infrared Spectrograph (NIRSPEC) on Keck II (McLean et al., 1998) and developed a set of spectral indices to derive a classification based on this higher resolution data. Likewise, Cushing et al. (2005) generated a set of spectra at similar resolution but over a larger wavelength range (0.6–4.1 m).
However, the current spectral classification does not take into account two important parameters: gravity and metallicity (Kirkpatrick, 2005). Indeed, the number of spectroscopic L dwarfs reported to date in young clusters and star forming regions (Metchev & Hillenbrand, 2006; Allers et al., 2007; Mohanty et al., 2007) is insufficient to develop a spectral classification for young brown dwarfs. The tools currently available comprise several methods. Firstly, the spectral shape and the changes observed in the strength of gravity-sensitive features is often employed to assess the youth of brown dwarfs when compared to known field dwarfs (Lucas et al., 2001; Gorlova et al., 2003; Slesnick et al., 2004; McGovern et al., 2004; Wilking et al., 2004; Meeus & McCaughrean, 2005; Allers et al., 2007). Secondly, Luhman (1999) proposed a Teff vs spectral type relation for young dwarfs, that relation later being revised by Luhman et al. (2003) and extended by Allers et al. (2007). Finally, the direct comparison of observed spectra with theoretical models (Allard et al., 2000) allows an estimate of Teff, gravity, and masses (Lucas et al., 2001; Meeus & McCaughrean, 2005).
The Upper Sco (hereafter USco) OB association is part of the Scorpius Centaurus complex (de Geus et al., 1989), located at a distance of 1452 pc from the Sun (de Bruijne et al., 1997; de Zeeuw et al., 1999). The age of USco is 5 Myr with little scatter (Preibisch & Zinnecker, 1999). The region is relatively free of extinction (Av 2 mag) and star formation has already ended (Walter et al., 1994). The association has been targeted at multiple wavelengths over the past decade starting with X-rays (Walter et al., 1994; Preibisch et al., 1998; Kunkel, 1999; Preibisch & Zinnecker, 1999) but also with Hipparcos (de Bruijne et al., 1997) as well as in the optical (Preibisch et al., 2001; Preibisch & Zinnecker, 2002; Ardila et al., 2000; Martín et al., 2004; Slesnick et al., 2006) and in the near-infrared (Lodieu et al., 2006; Lodieu et al., 2007). Several tens of low-mass stars and brown dwarfs with spectral types later than M6 have been confirmed as genuine spectroscopic substellar members in USco (Ardila et al., 2000; Martín et al., 2004; Slesnick et al., 2006; Lodieu et al., 2006).
Recently, we have found a large number of new BD candidates with spectral types later than M6 and estimated masses below 0.05 M⊙ from several square degrees imaged by the UKIRT Infrared Deep Sky Survey (UKIDSS; Lawrence et al., 2006) Galactic Cluster Survey (GCS). Additionally, we have extended the mass function down to 0.01 M⊙ with proper motion confirmation for sources more massive than 0.02 M⊙ (Lodieu et al., 2006; Lodieu et al., 2007). In this paper we present the near-infrared cross-dispersed spectra of the 23 faintest BDs in Upper Sco extracted from the UKIDSS GCS as well as two known late-M dwarfs used as spectral templates (Martín et al., 2004; Slesnick et al., 2006). In Section 2 we detail the observations and the data reduction of the cross-dispersed spectra obtained with the Gemini Near-InfraRed Spectrograph (GNIRS; Elias et al., 2006). In Section 3 we assess the membership of all sources using the spectral shape, gravity-sensitive features, and direct comparison with near-infrared spectra of field dwarfs at similar resolution. In Section 4 we discuss the implications of our spectroscopic follow-up and the current uncertainties on the determination of the effective temperatures and masses of these young brown dwarfs.
| IAU Name | R.A. | dec | ExpT | SpT | Memb | |||||
|---|---|---|---|---|---|---|---|---|---|---|
| USco J154722.82213914.3 | 15:47:22.82 | 21:39:14.3 | 15.64 | 14.83 | 14.18 | 13 | 31 | 8 (8)150 | L0 | Y |
| USco J155419.99213543.1 | 15:54:19.99 | 21:35:43.1 | 14.93 | 14.28 | 13.71 | 14 | 18 | 8 (4)150 | M8 | Y |
| USco J160603.75221930.0 | 16:06:03.75 | 22:19:30.0 | 15.85 | 15.10 | 14.44 | — | — | 4 (4)300 | L2 | Y |
| USco J160606.29233513.3 | 16:06:06.29 | 23:35:13.3 | 16.20 | 15.54 | 14.97 | — | — | 4 (4)300 | L0 | Y |
| USco J160648.18223040.1 | 16:06:48.18 | 22:30:40.1 | 14.93 | 14.35 | 13.84 | 23 | 15 | 8 (8)150 | M8 | Y |
| USco J160714.79232101.2 | 16:07:14.79 | 23:21:01.2 | 16.56 | 15.83 | 15.07 | — | — | 4 (4)300 | L0 | Y |
| USco J160723.82221102.0 | 16:07:23.82 | 22:11:02.0 | 15.20 | 14.56 | 14.01 | 11 | 31 | 8 (8)150 | L1 | Y |
| USco J160727.82223904.0 | 16:07:27.82 | 22:39:04.0 | 16.81 | 16.09 | 15.39 | — | — | 6 (6)300 | L1 | Y |
| USco J160737.99224247.0 | 16:07:37.99 | 22:42:47.0 | 16.76 | 16.00 | 15.33 | — | — | 8 (8)300 | L0 | Y |
| USco J160818.43223225.0 | 16:08:18.43 | 22:32:25.0 | 16.01 | 15.44 | 14.70 | — | — | 8 (8)300 | L0 | Y |
| USco J160828.47231510.4 | 16:08:28.47 | 23:15:10.4 | 15.45 | 14.78 | 14.16 | 12 | 13 | 8 (4)150 | L1 | Y |
| USco J160830.49233511.0 | 16:08:30.49 | 23:35:11.0 | 14.88 | 14.29 | 13.76 | 5 | 12 | 8 (8)150 | M9 | Y |
| USco J160847.44223547.9 | 16:08:47.44 | 22:35:47.9 | 15.69 | 15.09 | 14.53 | 0 | 20 | 4 (4)300 | M9 | Y |
| USco J160843.44224516.0 | 16:08:43.44 | 22:45:16.0 | 18.58 | 17.22 | 16.26 | — | — | 12 (8)300 | L1 | Y |
| USco J160918.69222923.7 | 16:09:18.69 | 22:29:23.7 | 18.08 | 17.06 | 16.16 | — | — | 8 (8)300 | L1 | Y |
| USco J160956.34222245.5 | 16:09:56.34 | 22:22:45.5 | 17.83 | 16.99 | 16.29 | — | — | 8 (8)300 | dL2 | N |
| USco J161047.13223949.4 | 16:10:47.13 | 22:39:49.4 | 15.26 | 14.57 | 14.01 | 15 | 24 | 8 (8)150 | M9 | Y |
| DENIS 161103.60242642.9 | 16:11:03.60 | 24:26:42.9 | 14.86 | 14.14 | 13.70 | — | — | 8 (8)150 | M9 | Y |
| USco J161227.64215640.8 | 16:12:27.64 | 21:56:40.8 | 17.14 | 16.37 | 15.78 | — | — | 8 (4)300 | L0 | ? |
| USco J161228.95215936.1 | 16:12:28.95 | 21:59:36.1 | 16.41 | 15.56 | 14.79 | — | — | 4 (4)300 | L1 | Y |
| USco J161302.32212428.4 | 16:13:02.32 | 21:24:28.4 | 17.17 | 16.37 | 15.65 | — | — | 8 (8)300 | L0 | Y |
| USco J161421.44233914.8 | 16:14:21.44 | 23:39:14.8 | 14.97 | 14.44 | 13.94 | 0 | 18 | 8 (8)150 | A0 | N |
| USco J161441.68235105.9 | 16:14:41.68 | 23:51:05.9 | 16.07 | 15.34 | 14.62 | — | — | 4 (4)300 | L1 | Y |
| SCH 162528.62165850.6 | 16:25:28.62 | 16:58:50.6 | 13.68 | 13.01 | 12.63 | — | — | 8 (8)150 | M8 | Y |
| USco J163919.15253409.9 | 16:39:19.15 | 25:34:09.9 | 17.20 | 16.39 | 15.61 | 1 | 17 | 8 (8)300 | L1 | Y |
2 Observations and data reduction
In this section we describe the observations and data reduction of GNIRS spectra obtained for the faintest brown dwarf candidates extracted from two lists of photometric sources published in Lodieu et al. (2006) and (Lodieu et al., 2007). Their magnitudes are fainter than 14 mag and their estimated masses below 25 MJup, according to theoretical models at 5 Myr (Baraffe et al., 1998; Chabrier et al., 2000). About half of them have proper motion measurements from the cross-correlation between 2MASS and the GCS (Table 1). The photometry with their associated errors and the proper motions can be retrieved from Lodieu et al. (2006) and Lodieu et al. (2007) but we give again those data in Table 1 for consistency.
2.1 Observations
Spectroscopic observations were conducted with the GNIRS spectrograph (Elias et al., 2006) mounted on the Gemini South telescope in March (09, 21, 24, 26, 31) and April (01, 02, 04, 06, 07) 2007 as part of the programme GS-2007A-Q-12 (Lodieu, PI). The list of USco targets contains 23 photometric brown dwarf candidates fainter than = 14 mag and two known members, SCH162528.62165850.55 (hereafter SCH1625 (M8; = 13.68); Slesnick et al., 2006) and DENIS161103.6242642.9 (hereafter DENIS1611 (M9; = 14.68); Martín et al., 2004). GNIRS was used in cross-dispersed mode with the 32l/mm grism and a slit of 0.3 arcsec, yielding a coverage of 1.15–2.5 microns at a resolution of R=1700 per resolution element. Only orders 3, 4, and 5 are usable due to severe inter-order contamination affecting the others. The total integration times and the shift pattern were chosen as a function of the brightness of the objects (Table 1): typically we have on-source integration times of 150 or 300 seconds with an ABBA pattern repeated one to three times. The number of exposures and the on-source integration times are given in Table 1. The number in brackets represents the number of exposures effectively used during the data reduction process. Wavelength calibration was achieved using internal argon lamps with an rms better than 0.3Å. The effects of telluric absorption were removed using two A0 standard stars (HIP79229 and HIP79244) observed immediately before or after the target and at a similar airmass (all objects are within an area of 23 degrees in USco). The observations were conducted under the following conditions: image quality better than 85% (i.e. seeing between 0.6 and 0.8 arcsec), photometric conditions (cloud cover less than 50% according to the Gemini definition for proposals), and no restrictions on the sky background and water vapour.
2.2 Data reduction
Data reduction was carried out following the instructions given in the IRAF files provided by Gemini Observatory to deal with cross-dispersed spectra taken with GNIRS. After correcting images for quadrant to quadrant variations (task NVNOISE), we prepared the frames with the task NSPREPARE in order to update the headers and run the subsequent tasks. A final flat field image was created using NSREDUCE and NSFLAT for each order. The telluric standards and science targets were then trimmed, sky subtracted, and flat-fielded using the same NSREDUCE command. Distortion correction and wavelength calibration were achieved with the routines NSSDIST and NSWAVELENGTH, respectively. Then, all the exposures of the standard stars and science targets were combined into one single file with NSCOMBINE before extracting a 1D spectrum with NSEXTRACT. Note that some exposures were rejected in a few cases due to the lack of signal or a high level of sky background (ninth column of Table 1). We have interpolated linearly across the hydrogen recombination lines present in the spectrum of the A0 standard stars (Vacca et al., 2003) and clearly visible at our resolution (the -band is the most affected). The interpolated lines are the Paschen line at 12818Å and Brackett lines at 15440Å, 15560Å, 15708Å, 15880Å, 16110Å, 16410Å, 16810Å, 17370Å, and 21655Å. Finally, we divided the 1D spectrum of the telluric standard from the 1D spectrum of the science target and multiplied by the spectrum of a A0 star available on the European Southern Observatory webpage111The spectra can be downloaded from the URL: http://www.eso.org/ISAAC/.
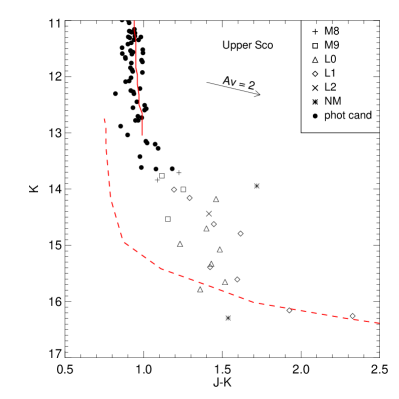
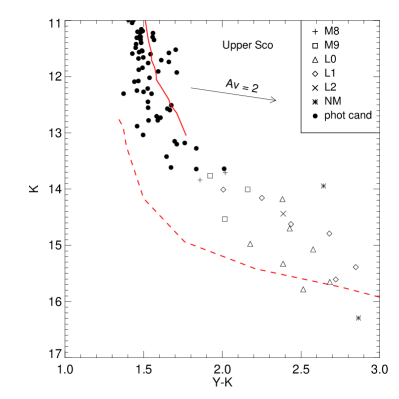
The final near-infrared (1.15–2.50 microns) spectra of 21 photometric brown dwarf candidates in USco confirmed spectroscopically as members are displayed in Fig. 1. The spectral region below 1.15 microns and the intervals 1.35–1.45 and 1.82–1.95 microns have been omitted due to the presence of telluric absorption bands. The location of the newly confirmed spectroscopic members in the (,) colour-magnitude diagram is shown in Fig. 2.

3 Classification and membership
In this section we discuss the membership of 23 brown dwarf candidates in USco using the spectral shape of the near-infrared spectra, the comparison with known USco members and field dwarfs classified optically, and the strength of gravity-sensitive features.
3.1 Spectral types
The spectral shape of our spectra indicate that 21 out of 23 photometric candidates are indeed young brown dwarfs belonging to the USco association. In particular, the triangular shape observed in the -band represents a characteristic feature of young objects (Lucas et al., 2001; Meeus & McCaughrean, 2005). The youth of those brown dwarfs is further warranted by the presence of weak Na I and K I doublets, spectral features sensitive to gravity (Sect. 3.4). The GNIRS spectra of all new spectroscopically confirmed members are shown in Fig. 1. Among the spectroscopic non-members we have one reddened early-type star and one field L2 dwarf whose spectra matches well the NIRSPEC spectrum of 2MASS J001544.8351603 published by M03,222The infrared spectra from the NIRSPEC Brown Dwarf Spectroscopic Survey (BDSS; McLean et al., 2003) are available at the URL http://www.astro.ucla.edu/ mclean/BDSSarchive/.
We have compared the GNIRS spectra of all USco sources between each other to infer a spectral sequence. The sources selected as spectral templates and used to classify the other targets are plotted in Fig. 4. In addition, we have compared our spectra with two known members classified optically: SCH1625 (M8; Slesnick et al., 2006) and DENIS1611 (M9; Martín et al., 2004). This procedure led to the four groups of objects to which we assign spectral types spaced by a subtype (Fig. 1; Tables 1 and 2):
- 1.
-
2.
the second group is made of three M9 dwarfs whose spectra agree with the infrared spectrum of DENIS1611 (squares in Fig. 2). The difference between the infrared spectra of the M8 and M9 dwarfs is characterised by (1) a steeper -band with later spectral type, (2) deeper H2O band in the -band with a peak shifted to a slightly redder wavelength, and (3) deeper flux depletion longwards of 2.3 m likely due to collision-induced absorption by molecular hydrogen. The depth of the CO break does not change significantly across the range of spectral types probed by our study;
-
3.
the third group composed of eight sources exhibits a steeper -band spectrum and a stronger depletion in the -band beyond 2.3 m. The -band is also affected with a strong water absorption in the 1.5–1.6 m range. Hence, we classify those sources as L0 (triangles in Fig. 2), a subclass later than DENIS1611. We assume an uncertainty of half a subclass on the spectral type;
-
4.
the fourth group, made of seven sources, exhibit deeper H2O absorption bands around 1.5 and 1.8 m as well as a stronger depletion in the -band than sources in the previous group. The -band seems however unaffected. Therefore, we assign a spectral type of L10.5 to all those sources (diamonds in Fig. 2);
-
5.
finally, one source, USco J160603.75221930.0, exhibits even stronger water absorption in the -band than the sources in the previous group although no difference is seen in the - and -bands. Thus we assign a spectral type of L21 to this source (cross in Fig. 2), keeping in mind that the uncertainty in the classification might be larger than for the other sources. Nevertheless, direct comparison with medium-resolution spectra of HD 203030B (L7.50.5; Metchev & Hillenbrand, 2006) confirm that our latest object is of earlier type. Similarly, comparison with the low-resolution (R100) and low signal-to-noise (3–10) spectrum of 2MASS12073932B (mid- to late-L; Mohanty et al., 2007, note that this object possess a disk) suggest that USco J160603.75221930.0 is earlier than a young mid-L dwarf.
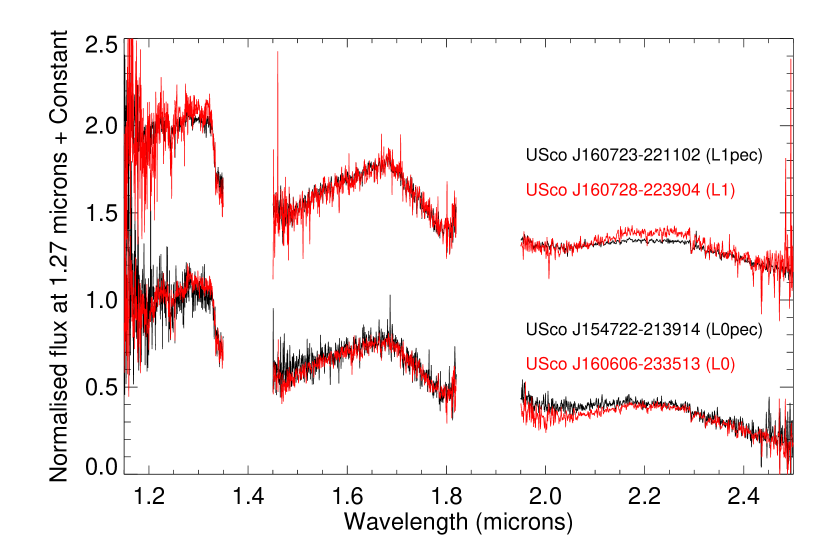
Finally, we have two sources with spectral shapes differing from the groups described above: on the one hand, USco J154722.82213914.3 is consistent with an L0 spectral type from to but exhibits an excess of flux in the 1.9–2.1 m wavelength range which is difficult to explain (bottom in Fig. 3). Furthermore, USco J160723.82221102.0 appears warmer than an L1 dwarf in the -band but consistent with an L1 dwarf in the -band. In addition, there is a clear excess of flux in the -band at 2.1–2.3 m (top in Fig. 3). This difference may result from a binary system composed of a L0 and a L2 dwarf of roughly equivalent brightness. The -band excess may be due to the presence of a disk although photometry at longer wavelength is required to confirm this hypothesis. Another option is that the system could present a temperature inversion as the one observed in the eclipsing binary discovered in Orion by Stassun et al. (2006). Nonetheless, we tentatively assign a spectral type of L1 to that object.
3.2 Spectral indices
To assess the validity of our spectral classification, we have computed several spectral indices designed in the literature for young objects (Table 2), including three vapour indices (H2O and H2O-1+H2O-2; Allers et al., 2007; Slesnick et al., 2004) as well as an FeH index (Slesnick et al., 2004) and a K2 index (Tokunaga & Kobayashi, 1999). Those indices were originally defined to classify field L dwarfs in the infrared (Tokunaga & Kobayashi, 1999; McLean et al., 2000; Reid et al., 2001; McLean et al., 2003) matching their optical spectral classifications (Kirkpatrick et al., 1999; Martín et al., 1999). Subsequently several authors modified those indices to apply them to younger brown dwarfs (Wilking et al., 1999; Gorlova et al., 2003; Slesnick et al., 2004; Allers et al., 2007).
The H2O index (1.550–1.560/1.492–1.502) defined by Allers et al. (2007) allows an estimate of the spectral type with an uncertainty of one subtype; this relation is valid from M5 to L0. The inferred spectral types agree with our classifications for most objects within the quoted uncertainties (Table 2). The exceptions are USco J160723.82221102.0 and USco J154722.82213914.3 whose spectral shapes are discussed above (Sect. 3.1) as well as USco J160604221930 that we classified as L2 and outside the range of validity of this spectral index.
Two additional water vapour indices were defined by Slesnick et al. (2004) in the and -bands following the work on field dwarfs by McLean et al. (2000) and Reid et al. (2001). Index H2O-1 is defined by the ratio 1.34/1.30 microns whereas H2O-2 is defined by the ratio 2.04/2.15 microns. Spectral types can be derived from empirical relations given in Table 3 and shown in Fig. 5 of Slesnick et al. (2004). The inferred spectral types from both indices are consistent with our classification within the 1.5 subtype errors assigned to the empirical fit. The best agreement with our classification is obtained for the H2O-2 index in the -band.
In addition, Slesnick et al. (2004) created a new index based on the strength of the FeH band around 1.2 m. This band is weak in our spectra, suggesting that this feature depends on gravity (Fig. 5; Sect. 3.4). Moreover, our spectra are usually noisy in this region. The inferred indices range from 0.8 to 1.0 (Table 2), corresponding to spectral types between M5 to L0 but, in general, the derived spectral types differ significantly from our classification. This discrepancy is confirmed by the spectral types assigned to the optically classified young brown dwarfs DENIS1611 (M6 instead of M9) and SCH1625 (M6 instead of M8). The origin of this inconsistency is unclear but may result from a combination of the large dispersion observed in the empirical fit (Table 3 and Fig. 5 in Slesnick et al., 2004) and the noisy GNIRS spectra in that wavelength range.
Furthermore, we have computed the H2O 1.5 m index defined by the ratio of the flux between 1.57 and 1.59 m and the flux in the 1.46–1.48 m range (Geballe et al., 2002). This index probes the slope of the blue side of the -band spectrum and is defined for field L and T dwarfs. Hence, the inferred spectral types might not be accurate but the values quoted in Table 2 confirm the range in spectral type (M8–L2) explored by our study.
Finally, we have applied the K2 index measuring the strength of the H2 absorption around 2.2 m and proposed by Tokunaga & Kobayashi (1999, their equation 1). We have found positive values ranging from 0.0 to 0.05 (Table 2) whereas typical values derived for field dwarfs are negative (Fig. 4 in Tokunaga & Kobayashi, 1999), suggesting a possible dependence on gravity of this index for late-M and early-L dwarfs.


3.3 Comparison with field dwarfs
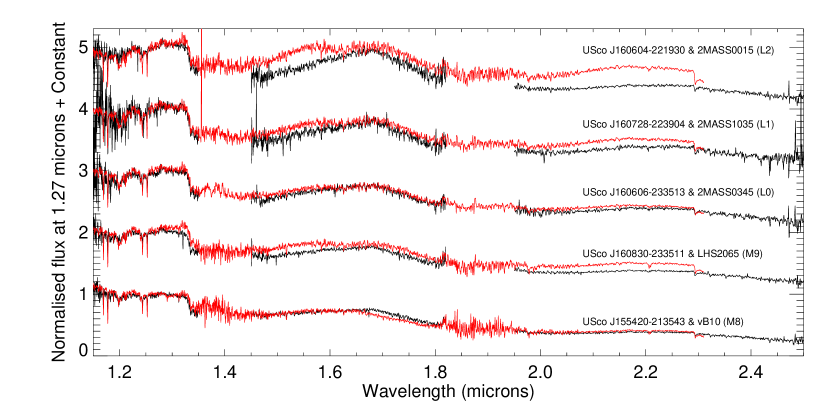
A further test of our spectral classification is a direct comparison with field L dwarfs of similar spectral types. M03 published a sequence of near-infrared spectra of M, L, and T dwarfs taken at a comparable resolution as our spectra (R=2000 vs 1700) with NIRSPEC on Keck II. The spectra of vB 10 (M8), LHS 2065 (M9), 2MASS J034543.2254023 (L0), 2MASS J103524.6250745 (L1), and 2MASS J001544.8351603 (L2; Kirkpatrick et al., 2000) observed over the full 1.15–2.30 m range were downloaded from the BDSS webpage. Those spectra of optically classified field dwarfs (red lines) are plotted on top of our GNIRS spectra in Fig. 6. Close-ups on the , , and passbands are displayed in Fig. 5 where important atomic lines and absorption bands are marked.
The agreement between the old field dwarfs and the young USco members suggests that our spectral classification is quite reasonable. Starting with the M8 and M9 USco dwarfs for which optical classification is available from the literature (Martín et al., 2004; Slesnick et al., 2006), the main difference resides in the triangular shape of the -band (Lucas et al., 2001; Luhman, 2004b; Slesnick et al., 2004; Meeus & McCaughrean, 2005; Allers et al., 2007). Additionally, the spectra of young objects appears slightly flatter around 1.3 m. The triangular shape of young sources remains to later spectral types, supporting a young age for our targets. Furthermore, the - and -band fluxes tend to be lower than those of field dwarfs, confirming the model trends of younger objects being bluer in than older objects (Chabrier et al., 2000). Finally, an additional major difference is the weakness of gravity-sensitive features such as K I and Na I in our spectra, again implying low gravities and hence supporting a young age for those brown dwarfs (see Sect. 3.4 for a discussion on the strength of atomic lines).
3.4 Gravity
Several atomic lines present in the near-infrared are known to be sensitive to gravity i.e. weaker with lower gravity or younger ages. We discuss in this section the behaviour of several of those lines seen in old late-M and early-L dwarfs (M03) and provide equivalent widths (EWs) in Table 3. Our measurements, in particular those of the K I (1.168/1.177 m and 1.243/1.254 m), Na I (1.268 m and 2.206/2.209 m), and Ca I (1.98 m) doublets, show that those gravity-sensitive features are weak in our spectra, hence adding a further proof to the youth of our targets. However, we do not observe any obvious trend between the strength of gravity-sensitive features (Table 3) and the position of the sources in the colour-magnitude diagrams (Fig. 2). Similarly, the current data do not show a correlation between the position of the objects in the colour-magnitude diagrams and their location in a (,) plot (Fig. 9 in de Zeeuw et al., 1999). Our photometric survey targeted the central part of the USco association with the highest concentration of members although marginal contamination by other subgroups (Upper Centaurus Lupus and Lower Centaurus Crux) cannot be ruled out.
The K I doublets at 1.168/1.177 m, 1.243/1.254 m, and 1.517 m are known to be sensitive to gravity. Indeed, all the EWs given in Table 3 are typically a factor of two smaller than those measured for field dwarfs of similar spectral type (M03; Cushing et al., 2005). Na I is similarly sensitive to gravity and often used to disentangle young dwarfs in clusters from their old field counterparts at optical (Steele & Jameson, 1995; Martín et al., 1996; Zapatero Osorio et al., 1997; Luhman, 1999, 2004b; Lodieu et al., 2005) and infrared (McGovern et al., 2004; Allers et al., 2007) wavelengths. The Na I line at 1.268 m is not detected at our resolution and signal-to-noise whereas it is clearly present in the spectra of field late-M and early-L dwarfs (M03; Cushing et al., 2005). However, this feature also depends on effective temperature because it disappears by mid-L but we are confident that the weakness of the line is due to gravity and not to effective temperature. We observe a similar behaviour for the Na I doublet at 2.206/2.209 m with EWs typically lower than those of field dwarfs (Table 3).
The CO bandhead at 2.3 m appears slightly weaker in our spectra than those of field dwarfs (Fig. 6), suggesting that it is sensitive to gravity as pointed out by M03. We do not find a strong dependence with spectral type and thus with effective temperature, again consistent with observations of field dwarfs (M03). Furthermore, we do not detect the Ca I triplet at 1.98 m in our spectra whereas it is clearly detected in field late-M to early-L dwarfs before it disappears at cooler temperatures. Hence, this feature is strongly dependent on effective temperature (M03; Cushing et al., 2005) but also on gravity.
The Fe I doublet at 1.189/1.197 m seems independent of gravity because we have measured EWs (Table 3) comparable to those reported in Table 8 of M03 and in Table 9 of Cushing et al. (2005). However, the strength of that line is weak at all ages (EWs on the order of 1Å or less) and higher resolution may subsequently reveal a dependence on gravity. This could be the case since the shape of the spectra of young brown dwarfs differs around 1.6 m, a region affected by FeH in older L dwarfs (Fig. 6 & 5).
Finally, we have measured EWs for the Al I doublet at 1.31/1.314 m (the doublet is unresolved at our resolution) smaller for field dwarfs, suggesting that this feature is gravity dependent (Table 3; Table 8 in M03 and Table 9 in Cushing et al. (2005)).
| IAU Name | Sp | H2O (Sp) | H2O-1 (Sp) | H2O-2 (Sp) | FeH (Sp) | K2 | H2O 1.5m (Sp) |
|---|---|---|---|---|---|---|---|
| SCH162528.62165850.55 | M8 | 1.06 ( 7.02) | 0.70 ( 8.96) | 0.96 ( 8.06) | 0.95 ( 6.33) | -0.01 | 1.10 (M8) |
| USco J160648.18223040.1 | M8 | 1.06 ( 7.10) | 0.68 ( 9.52) | 0.91 ( 9.34) | 0.85 ( 9.41) | 0.00 | 1.22 (L0) |
| USco J155419.99213543.1 | M8 | 1.06 ( 7.01) | 0.71 ( 8.74) | 0.94 ( 8.58) | 0.94 ( 6.76) | 0.00 | 1.11 (M8) |
| DENIS161103.6242642.9 | M9 | 1.13 ( 8.68) | 0.72 ( 8.21) | 0.92 ( 9.20) | 0.97 ( 5.79) | 0.02 | 1.23 (L0) |
| USco J161047.13223949.4 | M9 | 1.12 ( 8.32) | 0.69 ( 9.48) | 0.90 ( 9.80) | 0.90 ( 7.91) | 0.03 | 1.20 (M9–L0) |
| USco J160830.49233511.0 | M9 | 1.14 ( 8.90) | 0.69 ( 9.45) | 0.93 ( 8.84) | 0.90 ( 7.89) | -0.01 | 1.20 (M9–L0) |
| USco J160847.44223547.9 | M9 | 1.12 ( 8.45) | 0.69 ( 9.43) | 0.93 ( 8.95) | 0.89 ( 8.16) | 0.02 | 1.23 (L0) |
| USco J154722.82213914.3 | L0 | 1.07 ( 7.28) | 0.72 ( 8.19) | 0.98 ( 7.45) | 0.91 ( 7.55) | -0.01 | 1.10 (M8) |
| USco J160606.29233513.3 | L0 | 1.15 ( 9.08) | 0.66 (10.51) | 0.88 (10.26) | 0.86 ( 9.25) | 0.03 | 1.27 (L0–L1) |
| USco J160714.79232101.2 | L0 | 1.13 ( 8.74) | 0.73 ( 7.98) | 0.88 (10.28) | 0.91 ( 7.60) | 0.06 | 0.93 (M8) |
| USco J160737.99224247.0 | L0 | 1.17 ( 9.56) | 0.61 (12.24) | 0.82 (11.81) | 0.84 ( 9.86) | 0.04 | 1.29 (L1) |
| USco J160818.43223225.0 | L0 | 1.21 (10.37) | 0.62 (11.97) | 0.88 (10.23) | 0.83 (10.17) | 0.03 | 1.32 (L1) |
| USco J160828.47231510.4 | L0 | 1.08 ( 7.60) | 0.69 ( 9.46) | 0.88 (10.19) | 0.87 ( 8.95) | 0.03 | 1.26 (L0) |
| USco J160918.69222923.7 | L1 | 1.28 (12.13) | 0.72 ( 8.34) | 0.83 (11.55) | 0.45 (22.12) | 0.04 | 1.55 (L4–L5) |
| USco J161227.64215640.8 | L0 | 1.18 ( 9.73) | 0.67 (10.07) | 0.88 (10.36) | 0.97 ( 5.80) | 0.03 | 0.83 (M8) |
| USco J161302.32212428.2 | L0 | 1.22 (10.64) | 0.59 (12.71) | 0.87 (10.61) | 0.82 (10.54) | 0.03 | 1.24 (L0) |
| USco J160723.82221102.0 | L1 | 1.13 ( 8.65) | 0.67 (10.02) | 0.88 (10.39) | 0.91 ( 7.47) | 0.02 | 1.23 (L0) |
| USco J160727.82223904.0 | L1 | 1.25 (11.28) | 0.61 (12.22) | 0.83 (11.76) | 0.89 ( 8.31) | 0.04 | 1.26 (L0) |
| USco J160843.44224516.0 | L1 | 1.22 (10.65) | 0.61 (12.13) | 0.80 (12.49) | 0.68 (14.91) | 0.01 | 1.53 (L4) |
| USco J161228.95215936.1 | L1 | 1.18 ( 9.66) | 0.64 (11.14) | 0.87 (10.48) | 0.84 ( 9.91) | 0.03 | 0.83 (M8) |
| USco J161441.68235105.9 | L1 | 1.17 ( 9.49) | 0.61 (12.06) | 0.85 (10.97) | 0.86 ( 9.07) | 0.05 | 1.25 (L0) |
| USco J163919.15253409.9 | L1 | 1.14 ( 8.88) | 0.63 (11.39) | 0.85 (11.12) | 0.79 (11.47) | 0.04 | 1.32 (L1) |
| USco J160603.75221930.0 | L2 | 1.15 ( 9.11) | 0.63 (11.49) | 0.88 (10.28) | 0.88 ( 8.45) | 0.04 | 1.31 (L1) |
| USco J160956.34222245.5 | dL2 | 1.27 (11.74) | 0.69 ( 9.31) | 0.81 (12.29) | 0.80 (10.90) | -0.03 | 2.43 (T1) |
| IAU Name | Sp | K I 1.168/1.177 | K I 1.243/1.253 | Fe I | Al I | K I | Na I |
|---|---|---|---|---|---|---|---|
| SCH162528.62165850.55 | M8 | 1.8 (0.5) 1.9 (0.5) | 1.2 (0.5) 1.2 (0.5) | 1.2 1.1 | 0.7 | 1.6 | 1.3 |
| USco J155419.99213543.1 | M8 | 1.7 (1.0) 4.1 (1.0) | 1.5 (0.5) 2.0 (0.5) | 0.8 0.6 | 0.9 | 2.0 | 5.0 |
| USco J160648.18223040.1 | M8 | 3.6 (1.5) 2.6 (1.0) | 1.5 (0.5) 1.6 (0.5) | 0.7 0.7 | 0.6 | 1.8 | 3.3 |
| DENIS161103.6242642.9 | M9 | 2.1 (0.5) 3.1 (0.5) | 1.3 (0.5) 1.8 (0.5) | 2.1 1.1 | 0.7 | 0.8 | 2.9 |
| USco J160830.49233511.0 | M9 | 1.0 (1.0) 2.3 (0.5) | 1.5 (0.5) 1.1 (0.5) | 1.3 1.0 | 0.7 | 1.5 | 3.5 |
| USco J160847.44223547.9 | M9 | 3.7 (1.0) 5.0 (2.0) | 1.9 (0.5) 1.8 (0.5) | 0.8 1.2 | 0.4 | 1.2 | 1.5 |
| USco J161047.13223949.4 | M9 | 2.2 (1.0) 1.8 (0.5) | 2.7 (0.5) 3.7 (1.0) | 0.9 1.6 | 0.8 | 2.1 | 3.8 |
| USco J154722.82213914.3 | L0 | 5.0 (2.0) — (—) | 0.7 (1.0) 1.3 (0.5) | — — | 1.2 | 0.6 | low |
| USco J160606.29233513.3 | L0 | 2.9 (1.0) 7.1 (2.0) | 2.8 (1.0) 2.4 (1.0) | — — | 0.4 | 0.8 | 1.1 |
| USco J160714.79232101.2 | L0 | 4.8 (2.0) 5.1 (2.0) | 1.4 (1.0) 2.6 (0.5) | 0.9 0.5 | 0.8 | 2.6 | 2.0 |
| USco J160737.99224247.0 | L0 | 4.3 (2.0) 1.7 (1.0) | 2.0 (0.5) 3.5 (0.5) | 1.6 0.9 | 0.2 | 3.1 | 3.6 |
| USco J160818.43223225.0 | L0 | 2.0 (1.0) 5.2 (1.0) | 2.0 (0.5) 2.3 (0.5) | — — | — | 2.3 | 3.5 |
| USco J160828.47231510.4 | L0 | 3.6 (0.5) 1.2 (0.5) | 2.3 (0.5) 1.4 (0.5) | 1.5 1.4 | 0.8 | 2.1 | 2.5 |
| USco J160918.69222923.7 | L1 | — (—) — (—) | 5.0 (1.0) 5.2 (1.0) | — — | 0.4 | 1.3 | 1.6 |
| USco J161227.64215640.8 | L0 | 3.6 (1.0) 1.2 (0.5) | 4.8 (1.0) 3.9 (1.0) | — — | — | 3.7 | — |
| USco J161302.32212428.2 | L0 | 1.6 (2.0) 6.8 (2.0) | 2.1 (0.5) 1.9 (0.5) | — — | 0.5 | 1.4 | 3.3 |
| USco J160723.82221102.0 | L1 | 5.1 (1.0) 4.8 (1.0) | 2.1 (0.5) 1.6 (0.5) | 0.9 3.1 | 0.6 | 2.3 | 3.1 |
| USco J160727.82223904.0 | L1 | 2.8 (2.0) 8.5 (1.0) | 2.6 (0.5) — (—) | 1.5 3.6 | 0.5 | 1.3 | 3.7 |
| USco J160843.44224516.0 | L1 | — (—) — (—) | 2.2 (2.0) 1.7 (2.0) | — — | 0.5 | 1.4 | 2.5 |
| USco J161228.95215936.1 | L1 | 3.8 (2.0) 4.5 (1.0) | 2.1 (0.5) 3.2 (1.0) | 1.1 5.6 | 0.3 | 0.8 | 2.5 |
| USco J161441.68235105.9 | L1 | 2.1 (0.5) 3.3 (0.5) | 2.9 (1.0) 3.2 (1.0) | 0.6 2.3 | 0.4 | 1.9 | 0.6 |
| USco J163919.15253409.9 | L1 | 0.8 (2.0) 6.9 (2.0) | 2.9 (0.5) 2.6 (1.0) | — — | 1.2 | 0.6 | 0.9 |
| USco J160603.75221930.0 | L2 | 2.7 (1.0) 5.8 (1.0) | 1.3 (1.0) 2.0 (0.5) | 0.8 3.0 | 0.7 | 1.8 | low |
| USco J160956.34222245.5 | dL2 | — (—) — (—) | — (—) 7.6 (1.0) | — — | 0.9 | 0.8 | 1.0 |
3.5 Membership assessment
The spectral shape and the weakness of gravity-sensitive features present in the near-infrared spectra of our targets establish the membership of 21 out of 23 candidates extracted from the UKIDSS GCS by our photometric study (Lodieu et al., 2006; Lodieu et al., 2007). Therefore, we have added a significant number of spectroscopically-confirmed brown dwarfs (2 M8, 3 M9, 16 L0–L2) to the current census of substellar members in USco, made of 46 M6, 10 M7, 6 M8, and 2 M9 dwarfs. Furthermore, we have extended the current spectral sequence into the L regime.
Spectroscopy has failed to reveal members with spectral types as late as those expected from the photometric survey and the observed infrared colours: colours around 2 mag are typical for mid- to late-L field dwarfs (Knapp et al., 2004). Hence, young L dwarfs should be much redder than their old counterparts at similar spectral type, implying that our survey is insensitive to those mid- to late-L dwarfs and in fact limited by the -band rather than the -band completeness limit ( 18.7 mag compared to 17.3 mag). Indeed, the -band imaging employs microstepping to achieve better positional accuracy in order to measure proper motions after the second epoch planned by the GCS. Those second epoch observations planned in the -band within the framework of the GCS may be able to resolve this issue by using proper motions to pick up low-mass brown dwarfs in USco. Another option for the lack of mid-L dwarfs is that the survey is actually approaching the bottom of the mass function. However, it is less probable than the explanation above as less massive objects have been reported in Orionis (e.g. Zapatero Osorio et al., 2007).
The success rate of our photometric selection complemented partly with proper motions (using 2MASS as first epoch) is over 90%. This result is better than the level of contamination reported in the Pleiades and Alpha Per clusters from photometric-based searches (Moraux et al., 2001; Barrado y Navascués et al., 2002). However, it is consistent with the work by Adams et al. (2001) where photometry and proper motions from photographic plates and 2MASS were combined to extract a list of members in the Pleiades. Subsequent spectroscopic follow-up showed a level of contamination of 13% down to the completeness limit of the survey. The low level of contamination of our photometric selection looks very promising for future studies of young star forming regions relatively free of extinction as well as open clusters targeted by the UKIDSS GCS. We are able to confirm spectroscopically the low-mass end of the mass function derived from the sole photometric survey (Lodieu et al., 2007).
Among the non-members, we have one reddened early-type star, USco J161421.44233914.8. This object was selected as a photometric and proper motion candidate, hence supposedly a foreground contaminant. In addition, we have uncovered a field L2 dwarf, USco J160956.34222245.5, by comparison with 2MASS001544.8351603 observed with NIRSPEC at a similar resolution (M03). According to the absolute magnitudes (MJ) of L2 dwarfs with trigonometric parallaxes, we have calculated a distance of 120–140 pc with an uncertainty of 30 pc, assuming an error of 0.5 magnitude in MJ (Vrba et al., 2004; Knapp et al., 2004). If this object turns out to be a binary with components of equal brightness, it would be more distant by 40%. It is the faintest known field L dwarf of its subclass by one magnitude333This statement is based on the compendium of L and T dwarfs available at http://spider.ipac.caltech.edu/staff/davy/ARCHIVE/ and maintained by C. Gelino, D. Kirkpatrick, and A. Burgasser. The two coolest L2 dwarfs listed in this webpage are from Kirkpatrick et al. (2000) and Cruz et al. (2007). We are not considering here L dwarfs found in open clusters (e.g. Pleiades) and young star-forming regions (USco, Orionis) and thus the furthest discovered to date although upcoming discoveries in the UKIDSS Large Area Survey will certainly supersede this object in terms of distances (Kendall et al., 2007; Lodieu et al., 2007). It is also among the few field L dwarfs with distances over 100 pc at the time of writing (Vrba et al., 2004).
3.6 Effective temperatures and masses
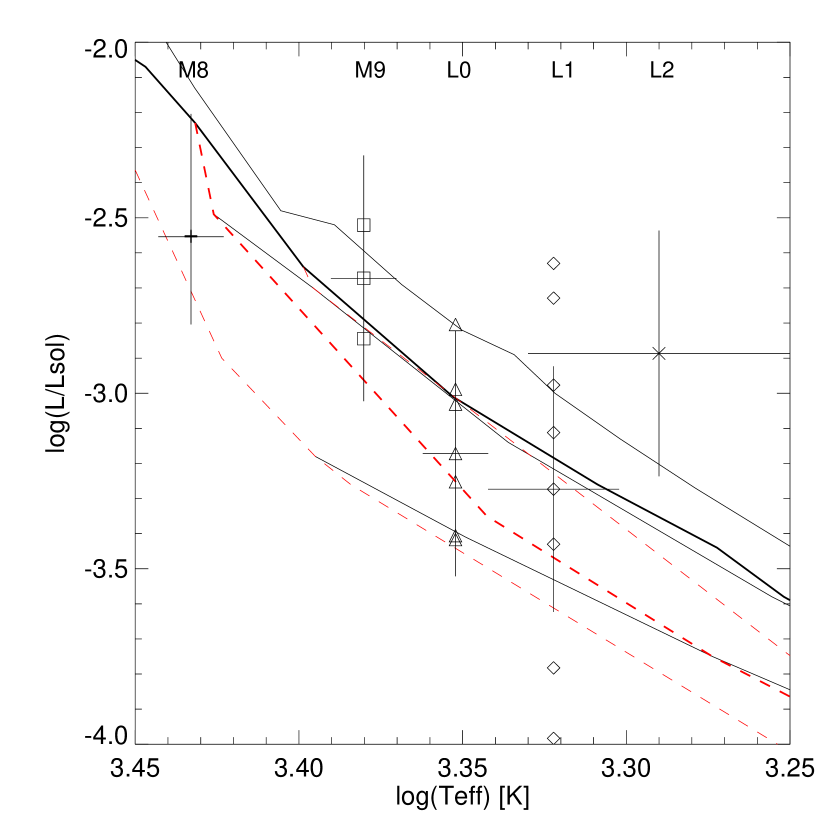
Combining the luminosities of our targets with their Teff deduced from the spectral types, we can estimate the masses using theoretical models (Chabrier et al., 2000). We have applied the Teff versus spectral type relation proposed by Luhman (1999) and later revised by Luhman et al. (2003) and specifically designed for young brown dwarfs whose spectra are intermediate between giants and dwarfs. However, this relation is valid only for spectral types earlier than M9, the Teff of a M8 and M9 dwarfs being 2710 K and 2400 K, respectively. Allers et al. (2007) extended this relation to young L-type dwarfs by subtracting 100 K for each subtype to the scale established by Luhman et al. (2003). Recent studies of field dwarfs suggest a difference in Teff between 100 K (Golimowski et al., 2004) and 200 K Vrba et al. (2004). Subtracting these values to the Teff = 2400 K for M9 yields Teff = 2300–2200 K for L0, 2200–2000 for L1, and 2100–1800 K for L2. The current uncertainty on the Teff of young early-L dwarfs can thus be as high as 300 K because no L giants are known to create a scale for young brown dwarfs. At the age (5 Myr; Preibisch & Zinnecker, 1999) and distance (145 pc; de Zeeuw et al., 1999) of USco, those intervals in Teff correspond to masses between 30 and 8 MJup (Chabrier et al., 2000). The position of our new spectroscopic members in the Hertzsprung-Russell diagram is shown in Fig. 7. We should mention here that models themselves carry a non negligible uncertainty on their mass estimates, implying that the mass range quoted above might be wider. The source with the latest spectral type (L2) would have a mass in the 13–8 MJup range, the lower estimate being consistent with the masses derived from the observed magnitude ( 18.5 mag). To summarise, we assign the following mass ranges 30–20, 20–16.5, 14–12, and 13–8 MJup to spectral types of M8, M9, L0, L1, and L2, respectively.
4 Discussion
Figure 2 shows a large dispersion in the spectral type vs magnitude relation, particularly around = 1.4-1.5 mag. In terms of spectral type, both M8 USco members have 14.9 mag but if we add SCH1625, the dispersion would be on the order of 1.3 mag ( = 13.67 mag). Note that difference between 2MASS and WFCAM magnitudes is small for late-M dwarfs (0.05 mag or less; Hewett et al., 2006). For the three M9 members, we observe a dispersion of 0.8 mag ( = 14.9–15.7 mag; Table 1). For the L0 dwarfs the dispersion is 1.2 mag ( = 16.0–17.2 mag) and the effect is even larger for L1 members with a dispersion of three magnitudes ( = 15.2–18.5 mag). Even if we remove the two reddest sources ( fainter than 18 mag), the dispersion is on the order of two magnitudes. Although large, this dispersion is also present among optically-classified USco members: for example the dispersion for M6 members based on 2MASS (Slesnick et al., 2006) and DENIS (Martín et al., 2004) photometry span 1.0–1.2 magnitude. Finally, let’s us consider that our sequence is not broadened by any of the effects described below: assuming that our objects spread four subclasses (M8–L1; neglecting the single L2 dwarf), the expected “natural” dispersion would lie between 0.65 mag in and 0.9 mag in and represents a significant fraction of the observed spread in Fig. 2.
-
•
At the age of USco, a dispersion of a few Myr can result in a large dispersion in magnitudes. de Geus et al. (1989) quote nuclear and kinematic ages between 5 and 8 Myr for Upper Sco whereas ages for the other two subgroup members of the Scorpius-Centaurus association, Upper Centaurus Lupus and Lower Centaurus Cruz are older (10–15 Myr). Similarly, Preibisch & Zinnecker (1999) derived an age estimate of 5 Myr with little scatter (less than 2 Myr). The fact that star formation occurred on a short time scale in Scorpius Centaurus and without a significant age spread after the explosion of two supernovae (Mamajek et al., 2002) is summarised in Appendix C of Kraus & Hillenbrand (2007). According to theoretical models, the -band magnitudes of a brown dwarf at 5 and 10 Myr can differ by 0.7 mag. Hence, a dispersion of one magnitude is not impossible if the scatter in the age is larger than 2 Myr. The scatter in the equivalent width measurements of gravity-sensitive doublets (Table 3) might also be the result of a scatter in age of a few Myr. Note that we do not consider here the fact that evolutionary models are less reliable at very young ages ( 1 Myr) than at a more mature stage (100 Myr). The HR diagram presented in Fig. 7 shows a symmetric scatter around the 5 Myr isochrone (thick solid line), suggesting that age might play a role in the spread observed in the colour-magnitude but is unlikely to be the main factor. Two sources appear to be younger and two other much older than the rest of the members in Fig. 7 although error bars are quite large.
-
•
The distance of USco is known with good accuracy since the measurements made by Hipparcos (1452 pc; de Bruijne, 1999; de Zeeuw et al., 1999). However, the uncertainty quoted in those works is the uncertainty on the parallax measurement and does not consider the extent of the association. The known members from Hipparcos are distributed over several degrees across the association, corresponding to an extent of 15 pc at the distance of 145 pc (Preibisch & Zinnecker, 1999). Larger intervals have been quoted in the literature for USco, including an uncertainty of 20 pc by de Geus et al. (1989) and even larger range from 80 to 160 pc not inconsistent with the spread of B-type stars (Martín, 1998). A cluster extent of 15 pc would correspond to a spread of 0.1 mag in the colour-magnitude diagram (Fig. 2).
-
•
The presence of reddening might play a role in broadening the cluster sequence: the typical extinction for USco is less than AV = 2 mag but translates into 0.3 mag in the colour (see Fig. 2). We have applied 2 magnitude of extinction to our M8–L2 spectra and compared them to earlier and later types after including the effect of reddening: the shape of the spectra is changed significantly but cannot be reproduced by any other spectrum. This result suggests that, although reddening could play a role in broadening the cluster sequence, our new members are unlikely to be affected by this effect. This conclusion is in agreement with the low reddening value derived for SCH1625 from its optical spectra (AV = 0.02 mag; Slesnick et al., 2006).
-
•
The presence of multiple systems always affects the width of a cluster sequence. An equal-mass binary will lie 0.75 magnitude above the single-star sequence, hence contributing to the dispersion observed in colour-magnitude diagrams. Although the dispersion observed in the left panel of Fig. 2 could be explained by the spread in age and the depth of the association as discussed above, the presence of a gap between the bluest and reddest sources with 14.0–15.5 might reflect the existence of a population of brown dwarf binaries (unresolved on the seeing-limited images). This fact is best represented in the (,) diagram presented in the right panel of Fig. 2. If the dispersion is indeed mostly due to binarity, we would derive a multiplicity larger than 50%. Köhler et al. (2000) derived a binary frequency of 5210% over the 0.7–0.13 M⊙ from a sample of 118 G5–M5 USco members and for projected physical separations larger than 21 au. From a high-resolution survey carried out with the Hubble Space Telescope, Kraus et al. (2005) deduced a low-mass star multiplicity of 25% for separations larger than 7 au but failed to uncover brown dwarfs below 0.07 M⊙. These results point towards similar properties of young and field brown dwarfs (low binary fraction, equal-mass systems, close separations; Burgasser et al., 2007) and is corroborated by other surveys in Cha I (Ahmic et al., 2007). However, the contribution of spectroscopic binaries among low-mass stars and brown dwarfs should not be neglected and can account for a significant fraction (10–15%; Basri & Reiners, 2006). Finally, we would like to mention that the substellar binary fraction in the Pleiades could be as high as 28–44% (Lodieu et al., 2007), twice larger than estimates from high-resolution surveys (e.g. Bouy et al., 2006) but consistent with Monte-Carlo simulations by Maxted & Jeffries (2005) and the radial velocity survey by Basri & Reiners (2006).
-
•
The frequency of disks around low-mass stars and brown dwarfs can be as high as 50% in young star-forming regions, including Orionis (Hernández et al., 2007; Caballero et al., 2007), IC 348 (Lada et al., 2006), and Chamaeleon (Luhman et al., 2005). The spectral energy distribution of several low-mass stars at mid-infrared were indeed best fit by disk models in Chamaeleon (Natta & Testi, 2001). Recently, Carpenter et al. (2006) found that 19% of K0–M5 dwarfs in USco show infrared excesses using Spitzer whereas the majority of higher-mass members ( 99%) seems devoid of circumstellar disks. During an independent survey, Jayawardhana et al. (2003) found that 5025% (four out of eight sources with spectral types later than M5) exhibit colour excesses suggesting the presence of circumstellar disks. Hence, those results may suggest that at least 20–25% of low-mass stars and brown dwarfs possess infrared excesses longwards of 3.6 m. The resulting dispersion in the colour-magnitude diagrams can be on the order of several tenths of magnitudes depending on the colour ( is the most affected band at near-infrared wavelengths implying an increased dispersion in colour) and the mass of the object. For example, Caballero et al. (2007) found a typical dispersion of 0.4 mag in among objects with and without disks in Orionis, a cluster with an age comparable to USco.
5 Conclusions
We have presented the results of a near-infrared spectroscopic follow-up study aimed at assessing the membership of a sample of brown dwarf candidates in the young Upper Sco association. We have confirmed a total of 21 out of 23 candidates, implying that the luminosity function derived form the photometric survey remains unchanged. By the same token, the power law index =0.6 derived from our photometric survey (Lodieu et al., 2007) remains valid after spectroscopic confirmation of over 90% of the photometric candidates below 30 MJup. The spectral types of the newly confirmed brown dwarfs range from M8 to L2, yielding effective temperatures in the 2700–1800 K range with uncertainties up to 300 K, following the scale developed by Luhman et al. (2003) for young brown dwarfs. The interval in mass probed by our study spans 30–8 MJup according to theoretical models and is consistent with the masses inferred from our photometric survey. The dispersion observed in the spectral type-magnitude relation is large, in particular for the latest spectral types. The reasons for this dispersion might be the consequence of several effects, including reddening (although unlikely for our sample), errors on the age (small contribution), uncertainty on the distance, binarity, and the presence of disks (affecting at least 20% of the sources).
To investigate the binary frequency in USco, several follow-up observations are required, including adaptive optics and high-resolution spectroscopy. Several studies pointed out the possibility of a large fraction of close and wide low-mass binaries in USco (Kraus et al., 2005; Bouy et al., 2006) compared to other clusters although no brown dwarf companions were found (in particular in the mass range discussed here). If binarity is the main effect for the dispersion of spectroscopic members observed in colour-magnitude diagrams, those systems would have separations smaller than th limits of high-resolution imaging surveys (5 au for HST, 7–10 au for adaptive optics). The cause for the difference between clusters remains however unclear: does it depend on the environment as proposed by Kraus et al. (2005) and Bouy et al. (2006) or is it a consequence of the disruption of binaries with age? The occurrence of disks around low-mass brown dwarfs and planetary-mass objects and the influence of disks on the association sequence could be addressed with a -band imaging survey (Jayawardhana et al., 2003; Liu et al., 2003) or Spitzer follow-up (Carpenter et al., 2006). Thus additional photometry at some of these wavelengths for our USco brown dwarfs could be made to indicate the presence of disks, estimate their effect on the colours, and provide some indication about the disk properties of our sample.
Acknowledgments
We thank Maria Rosa Zapatero Osorio for early comments on the original draft. We also wish to thank the referee for a comprehensive and thorough reading of the manuscript. Many thanks to Stanimir Metchev and Subhanjoy Mohanty for providing kindly and promptly the spectra of HD 203030B and 2MASS12073932B, respectively. This work is based on observations obtained at the Gemini Observatory (program GS-2007A-Q-12), which is operated by the Association of Universities for Research in Astronomy, Inc., under a cooperative agreement with the NSF on behalf of the Gemini partnership: the National Science Foundation (United States), the Particle Physics and Astronomy Research Council (United Kingdom), the National Research Council (Canada), CONICYT (Chile), the Australian Research Council (Australia), CNPq (Brazil) and CONICET (Argentina). This research has made use of the NASA’s Astrophysics Data System Bibliographic Services (ADS). This publication has also made use of data products from the Two Micron All Sky Survey, which is a joint project of the University of Massachusetts and the Infrared Processing and Analysis Center/California Institute of Technology, funded by the National Aeronautics and Space Administration and the National Science Foundation. This research has benefitted from the M, L, and T dwarf compendium housed at DwarfArchives.org and maintained by Chris Gelino, Davy Kirkpatrick, and Adam Burgasser.
References
- Adams et al. (2001) Adams J. D., Stauffer J. R., Monet D. G., Skrutskie M. F., Beichman C. A., 2001, AJ, 121, 2053
- Ahmic et al. (2007) Ahmic M., Jayawardhana R., Brandeker A., Scholz A., van Kerkwijk M. H., Delgado-Donate E., Froebrich D., 2007, ArXiv e-prints, 0708.3851, 708
- Allard et al. (2000) Allard F., Hauschildt P. H., Schweitzer A., 2000, ApJ, 539, 366
- Allers et al. (2007) Allers K. N., et al. 2007, ApJ, 657, 511
- Ardila et al. (2000) Ardila D., Martín E., Basri G., 2000, AJ, 120, 479
- Béjar et al. (2001) Béjar V. J. S., et al. 2001, ApJ, 556, 830
- Baraffe et al. (1998) Baraffe I., Chabrier G., Allard F., Hauschildt P. H., 1998, A&A, 337, 403
- Barrado y Navascués et al. (2002) Barrado y Navascués D., Bouvier J., Stauffer J. R., Lodieu N., McCaughrean M. J., 2002, A&A, 395, 813
- Barrado y Navascués et al. (2001) Barrado y Navascués D., Zapatero Osorio M. R., Béjar V. J. S., Rebolo R., Martín E. L., Mundt R., Bailer-Jones C. A. L., 2001, A&A, 377, L9
- Basri et al. (2000) Basri G., Mohanty S., Allard F., Hauschildt P. H., Delfosse X., Martín E. L., Forveille T., Goldman B., 2000, ApJ, 538, 363
- Basri & Reiners (2006) Basri G., Reiners A., 2006, AJ, 132, 663
- Bouy et al. (2006) Bouy H., Martín E. L., Brandner W., Zapatero-Osorio M. R., Béjar V. J. S., Schirmer M., Huélamo N., Ghez A. M., 2006, A&A, 451, 177
- Bouy et al. (2006) Bouy H., Moraux E., Bouvier J., Brandner W., Martín E. L., Allard F., Baraffe I., Fernández M., 2006, ApJ, 637, 1056
- Briceño et al. (2002) Briceño C., Luhman K. L., Hartmann L., Stauffer J. R., Kirkpatrick J. D., 2002, ApJ, 580, 317
- Burgasser et al. (2007) Burgasser A. J., Reid I. N., Siegler N., Close L., Allen P., Lowrance P., Gizis J., 2007, in Reipurth B., Jewitt D., Keil K., eds, Protostars and Planets V Not Alone: Tracing the Origins of Very-Low-Mass Stars and Brown Dwarfs Through Multiplicity Studies. pp 427–441
- Caballero et al. (2007) Caballero J. A., et al. 2007, A&A, A&A, 470, 903
- Carpenter et al. (2006) Carpenter J. M., Mamajek E. E., Hillenbrand L. A., Meyer M. R., 2006, ApJL, 651, L49
- Chabrier et al. (2000) Chabrier G., Baraffe I., Allard F., Hauschildt P., 2000, ApJ, 542, 464
- Comerón et al. (2004) Comerón F., Reipurth B., Henry A., Fernández M., 2004, A&A, 417, 583
- Cruz et al. (2007) Cruz K. L., et al. 2007, AJ, 133, 439
- Cushing et al. (2005) Cushing M. C., Rayner J. T., Vacca W. D., 2005, ApJ, 623, 1115
- de Bruijne (1999) de Bruijne J. H. J., 1999, MNRAS, 310, 585
- de Bruijne et al. (1997) de Bruijne J. H. J., Hoogerwerf R., Brown A. G. A., Aguilar L. A., de Zeeuw P. T., 1997, in ESA SP-402: Hipparcos - Venice ’97 Improved Methods for Identifying Moving Groups. pp 575–578
- de Geus et al. (1989) de Geus E. J., de Zeeuw P. T., Lub J., 1989, A&A, 216, 44
- de Zeeuw et al. (1999) de Zeeuw P. T., Hoogerwerf R., de Bruijne J. H. J., Brown A. G. A., Blaauw A., 1999, AJ, 117, 354
- Elias et al. (2006) Elias J. H., Joyce R. R., Liang M., Muller G. P., Hileman E. A., George J. R., 2006, in Ground-based and Airborne Instrumentation for Astronomy. Edited by McLean, Ian S.; Iye, Masanori. Proceedings of the SPIE, Volume 6269, pp. (2006). Design of the Gemini near-infrared spectrograph
- Geballe et al. (2002) Geballe T. R., et al. 2002, ApJ, 564, 466
- Golimowski et al. (2004) Golimowski D. A., et al. 2004, AJ, 127, 3516
- Gorlova et al. (2003) Gorlova N. I., Meyer M. R., Rieke G. H., Liebert J., 2003, ApJ, 593, 1074
- Guieu et al. (2006) Guieu S., Dougados C., Monin J.-L., Magnier E., Martín E. L., 2006, A&A, 446, 485
- Hernández et al. (2007) Hernández J., et al. 2007, ApJ, 662, 1067
- Hewett et al. (2006) Hewett P. C., Warren S. J., Leggett S. K., Hodgkin S. T., 2006, MNRAS, 367, 454
- Hillenbrand (1997) Hillenbrand L. A., 1997, AJ, 113, 1733
- Jayawardhana et al. (2003) Jayawardhana R., Ardila D. R., Stelzer B., Haisch K. E., 2003, AJ, 126, 1515
- Kendall et al. (2007) Kendall T. R., et al. 2007, A&A, 466, 1059
- Kirkpatrick (2005) Kirkpatrick J. D., 2005, ARA&A, 43, 195
- Kirkpatrick et al. (1999) Kirkpatrick J. D., et al. 1999, ApJ, 519, 802
- Kirkpatrick et al. (2000) Kirkpatrick J. D., et al. 2000, AJ, 120, 447
- Knapp et al. (2004) Knapp G. R., et al. 2004, AJ, 127, 3553
- Köhler et al. (2000) Köhler R., Kunkel M., Leinert C., Zinnecker H., 2000, A&A, 356, 541
- Kraus & Hillenbrand (2007) Kraus A. L., Hillenbrand L. A., 2007, ApJ, 662, 413
- Kraus et al. (2005) Kraus A. L., White R. J., Hillenbrand L. A., 2005, ApJ, 633, 452
- Kunkel (1999) Kunkel M., 1999, Ph.D. Thesis, Julius-Maximilians-Universität Würzburg
- Lada et al. (2006) Lada C. J., et al. 2006, AJ, 131, 1574
- Lawrence et al. (2006) Lawrence A., et al. 2007, MNRAS, submitted (astro-ph/0604426)
- Leggett et al. (2000) Leggett S. K., et al. 2000, ApJL, 536, L35
- Liu et al. (2003) Liu M. C., Najita J., Tokunaga A. T., 2003, ApJ, 585, 372
- Lodieu et al. (2007) Lodieu N., Dobbie P. D., Deacon N. R., Hodgkin S. T., Hambly N. C., Jameson R. F., 2007c, MNRAS, 374, 372
- Lodieu et al. (2006) Lodieu N., Hambly N. C., Jameson R. F., 2006, MNRAS, 373, 95
- Lodieu et al. (2007) Lodieu N., Hambly N. C., Jameson R. F., Hodgkin S. T., Carraro G., Kendall T. R., 2007a, MNRAS, 374, 372
- Lodieu et al. (2005) Lodieu N., McCaughrean M. J., Barrado Y Navascués D., Bouvier J., Stauffer J. R., 2005, A&A, 436, 853
- Lodieu et al. (2007) Lodieu N., et al. 2007b, MNRAS, in press
- Lucas et al. (2001) Lucas P. W., Roche P. F., Allard F., Hauschildt P. H., 2001, MNRAS, 326, 695
- Luhman (1999) Luhman K. L., 1999, ApJ, 525, 466
- Luhman (2004a) Luhman K. L., 2004a, ApJ, 602, 816
- Luhman (2004b) Luhman K. L., 2004b, ApJ, 617, 1216
- Luhman et al. (2005) Luhman K. L., Lada C. J., Hartmann L., Muench A. A., Megeath S. T., Allen L. E., Myers P. C., Muzerolle J., Young E., Fazio G. G., 2005, ApJL, 631, L69
- Luhman & Rieke (1999) Luhman K. L., Rieke G. H., 1999, ApJ, 525, 440
- Luhman et al. (2003) Luhman K. L., Stauffer J. R., Muench A. A., Rieke G. H., Lada E. A., Bouvier J., Lada C. J., 2003, ApJ, 593, 1093
- Mamajek et al. (2002) Mamajek E. E., Meyer M. R., Liebert J., 2002, AJ, 124, 1670
- Martín (1998) Martín E. L., 1998, AJ, 115, 351
- Martín et al. (2003) Martín E. L., Barrado y Navascués D., Baraffe I., Bouy H., Dahm S., 2003, ApJ, 594, 525
- Martín et al. (2000) Martín E. L., Brandner W., Bouvier J., Luhman K. L., Stauffer J., Basri G., Zapatero Osorio M. R., Barrado y Navascués D., 2000, ApJ, 543, 299
- Martín et al. (1999) Martín E. L., Delfosse X., Basri G., Goldman B., Forveille T., Zapatero Osorio M. R., 1999, AJ, 118, 2466
- Martín et al. (2004) Martín E. L., Delfosse X., Guieu S., 2004, AJ, 127, 449
- Martín et al. (1996) Martín E. L., Rebolo R., Zapatero Osorio M. R., 1996, ApJ, 469, 706
- Maxted & Jeffries (2005) Maxted P. F. L., Jeffries R. D., 2005, MNRAS, 362, L45
- McGovern et al. (2004) McGovern M. R., Kirkpatrick J. D., McLean I. S., Burgasser A. J., Prato L., Lowrance P. J., 2004, ApJ, 600, 1020
- McLean et al. (1998) McLean I. S., et al. 1998, in Fowler A. M., ed., Proc. SPIE Vol. 3354, p 566–578, Infrared Astronomical Instrumentation, Albert M. Fowler; Ed. Vol. 3354 of Presented at the Society of Photo-Optical Instrumentation Engineers (SPIE) Conference, Design and development of NIRSPEC: a near-infrared echelle spectrograph for the Keck II telescope.
- McLean et al. (2003) McLean I. S., McGovern M. R., Burgasser A. J., Kirkpatrick J. D., Prato L., Kim S. S., 2003, ApJ, 596, 561
- McLean et al. (2000) McLean I. S., et al. 2000, ApJL, 533, L45
- Meeus & McCaughrean (2005) Meeus G., McCaughrean M. J., 2005, Astronomische Nachrichten, 326, 977
- Metchev & Hillenbrand (2006) Metchev S. A., Hillenbrand L. A., 2006, ApJ, 651, 1166
- Mohanty et al. (2007) Mohanty S., Jayawardhana R., Huélamo N., Mamajek E., 2007, ApJ, 657, 1064
- Moraux et al. (2001) Moraux E., Bouvier J., Stauffer J. R., 2001, A&A, 367, 211
- Muench et al. (2002) Muench A. A., Lada E. A., Lada C. J., Alves J., 2002, ApJ, 573, 366
- Muench et al. (2003) Muench A. A., et al. 2003, AJ, 125, 2029
- Nakajima et al. (1995) Nakajima T., Oppenheimer B. R., Kulkarni S. R., Golimowski D. A., Matthews K., Durrance S. T., 1995, Nat, 378, 463
- Natta & Testi (2001) Natta A., Testi L., 2001, A&A, 376, L22
- Preibisch et al. (2001) Preibisch T., Guenther E., Zinnecker H., 2001, AJ, 121, 1040
- Preibisch et al. (1998) Preibisch T., Guenther E., Zinnecker H., Sterzik M., Frink S., Roeser S., 1998, A&A, 333, 619
- Preibisch & Zinnecker (1999) Preibisch T., Zinnecker H., 1999, AJ, 117, 2381
- Preibisch & Zinnecker (2002) Preibisch T., Zinnecker H., 2002, AJ, 123, 1613
- Rebolo et al. (1995) Rebolo R., Zapatero-Osorio M. R., Martín E. L., 1995, Nat, 377, 129
- Reid et al. (2001) Reid I. N., Burgasser A. J., Cruz K. L., Kirkpatrick J. D., Gizis J. E., 2001, AJ, 121, 1710
- Rieke & Lebofsky (1985) Rieke G. H., Lebofsky M. J., 1985, ApJ, 288, 618
- Slesnick et al. (2006) Slesnick C. L., Carpenter J. M., Hillenbrand L. A., 2006, AJ, 131, 3016
- Slesnick et al. (2004) Slesnick C. L., Hillenbrand L. A., Carpenter J. M., 2004, ApJ, 610, 1045
- Stassun et al. (2006) Stassun K. G., Mathieu R. D., Valenti J. A., 2006, Nat, 440, 311
- Steele & Jameson (1995) Steele I. A., Jameson R. F., 1995, MNRAS, 272, 630
- Testi et al. (2001) Testi L., et al. 2001, ApJL, 552, L147
- Tokunaga & Kobayashi (1999) Tokunaga A. T., Kobayashi N., 1999, AJ, 117, 1010
- Vacca et al. (2003) Vacca W. D., Cushing M. C., Rayner J. T., 2003, PASP, 115, 389
- Vrba et al. (2004) Vrba F. J., et al. 2004, AJ, 127, 2948
- Walter et al. (1994) Walter F. M., Vrba F. J., Mathieu R. D., Brown A., Myers P. C., 1994, AJ, 107, 692
- Wilking et al. (1999) Wilking B. A., Greene T. P., Meyer M. R., 1999, AJ, 117, 469
- Wilking et al. (2004) Wilking B. A., Meyer M. R., Greene T. P., Mikhail A., Carlson G., 2004, AJ, 127, 1131
- Wilking et al. (2005) Wilking B. A., Meyer M. R., Robinson J. G., Greene T. P., 2005, AJ, 130, 1733
- Zapatero Osorio et al. (2000) Zapatero Osorio M. R., Béjar V. J. S., Martín E. L., Rebolo R., Barrado y Navascués D., Bailer-Jones C. A. L., Mundt R., 2000, Science, 290, 103
- Zapatero Osorio et al. (2007) Zapatero Osorio M. R., et al. 2007, A&A, ArXiv e-prints, 0710.2776
- Zapatero Osorio et al. (1997) Zapatero Osorio M. R., Rebolo R., Martín E. L., Basri G., Magazzù A., Hodgkin S. T., Jameson R. F., Cossburn M. R., 1997, ApJL, 491, L81