Enhanced circular dichroism via slow-light in dispersive structured media
Abstract
Circular dichroism (CD) is in widespread use as a means of determining enantiomeric excess. We show how slow-light phenomena in dispersive structured media allow for a reduction in the required optical path length of an order of magnitude. The same ideas may be used to enhance the sensitivity of CD measurements while maintaining the same optical path length through the sample. Finally, the sensitivity may be enhanced in frequency regimes where CD data is typically not accessible due to a modest chiral response of the enantiomers.
The determination of enantiomeric excess is of vital importance in e.g. the pharmaceutical and biochemical industries. While most biological chiral molecules only occur naturally with a single handedness, industrial production of enantiomerically pure products is an extremely difficult and challenging task. While one enantiomer may have the desired effect, the effect of the other enantiomer may be less pronounced or may even be toxic in some cases, placing a strong requirement on the development of tools for determination and quantification of enantiomeric excess. One widespread and commercially available tool for measuring enantiomeric excess is the Ultraviolet-Circular Dichroism (UV-CD) method, which combines ordinary UV spectroscopy with a measurement of circular dichroism (CD) to determine the enantiomeric excess of a sample. Chen2003 UV light is usually required, because most relevant biochemical molecules of interest absorb predominantly in the UV region. While UV spectroscopy provides information on the total concentration of both types of enantiomers, CD measurements provide information on the difference . A combined UV-CD measurement thus immediately gives the enantiomeric excess of a sample. With the on-going emphasis on miniaturization of chemical analysis systems Janasek2006 there is an increased emphasis on optofluidicsPsaltis:2006 ; Monat:2007a ; Erickson2007 and the integration of optics with lab-on-a-chip microsystems.Verpoorte2003 In particular, there is a strong desire for enhancement of the sensitivity of optical measurements, in order to accommodate the strongly reduced optical path length in such systems.Mortensen2007a In this Letter we theoretically show how the introduction of dispersive structured media in CD measurements may allow for a reduction in the required optical path length of an order of magnitude, while maintaining the same signal-to-noise ratio.
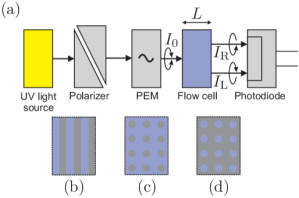
Consider a typical setup for measuring chiral dichroism, as illustrated schematically in Fig. 1a.UV-CD Here, light from a UV source is directed to a polarizer and then modulated between left- and right-handed circularly polarized light by a photoelastic modulator (PEM). The resulting circularly polarized light of intensity is then passed through a flow cell of length , and the difference in transmitted intensity, of each polarization is measured. The absorption parameter of the chiral liquid is given as for left () and right () circularly polarized light, respectively. To lowest order in the concentrations with the constants of proportionality known as the extinction coefficients. We then find, using Beer’s law, that the difference in intensity of the transmitted light, , is given as
| (1) |
To maximize the signal to noise ratio for such a measurement, should be chosen so that
| (2) |
for which is at an extremum. In typical, commercially available UV-CD apparatus, mm, JASCO though this may not necessarily be the optimum length.
Consider now the situation in which the liquid is embedded in a dispersive photonic crystal, as illustrated schematically in Figs. 1b-d. Due to slow-light phenomena the light-matter interactions are enhanced in the photonic crystal, as shown recently by Mortensen and Xiao in Refs. Mortensen2007, and Mortensen2007a, . This enhancement may be quantified via an enhancement factor , where is the absorption parameter when the photonic crystal is present. The dimensionless enhancement factor is given asMortensen2007 ; Mortensen2007a
| (3) |
where is the refractive index of the liquid, is the group velocity and is the filling factor giving the relative optical overlap with the liquid. In the absence of the photonic crystal, and consequently . Eq. (3) has been derived in the case of a photonic crystal infiltrated by a non-chiral liquid with absorption coefficient .Mortensen2007 To justify its use also for weakly chiral liquids we recall the constitutive relations for the chiral problem
| (4a) | |||
| (4b) | |||
where is a parameter quantifying the chiral strength of the liquid. Combining Maxwell’s equations we arrive at the standard wave equation for the non-chiral problem to first order in . In other words, standard electromagnetic perturbation theory shows that to lowest order in no frequency shifts are introduced by chirality. Consequently, we may in a first order approximation use the same group velocity for both directions of circular polarization of the incident light. Including slow-light phenomena in the previous discussion via the enhancement factor, we thus find that the maximum signal to noise ratio is found when
| (5) |
This result suggests, quite intuitively, that a large enhancement factor facilitates miniaturization of circular dichroism setups. Such a miniaturization is crucial for possible future implementations of chirality measurements in lab-on-a-chip systems. If one considers lower concentrations of chiral molecules, then the optimum value of will increase, and, conversely, a larger value of will increase the measurement sensitivity at low concentrations. Thus, the sensitivity of existing CD measurements may be increased, while maintaining the same optical path length through the sample. Also, it may allow for tuning the setup to accommodate different types of molecules, by dynamically altering the dispersion relation. This may be accomplished, e.q., by tuning the wavelength of the incident light or the refractive index of the materials of the structure.
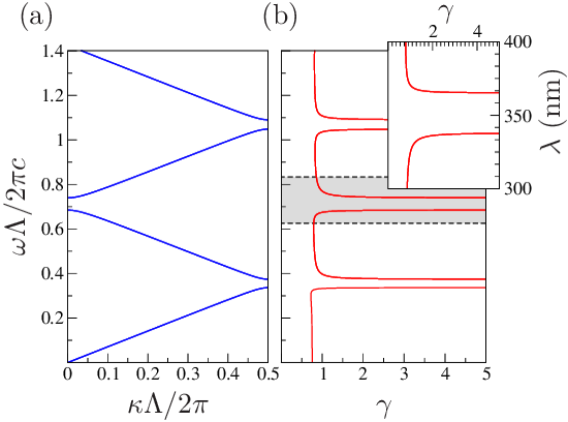
As a specific example, we consider a Bragg stack as shown in Fig. 1b, consisting of alternate layers of Poly(methyl methacrylate) (PMMA) and the chiral liquid. PMMA is transparent to UV light down to approximately 300 nm, which is a requirement for most applications involving biochemical molecules. In Fig. 2a we show the band structure for a Bragg stack of period , where , and . We use for the chiral liquid, and a value of for the refractive index of PMMA. Cardenas-Valencia2006 For all numerical results presented, fully-vectorial eigenmodes of Maxwell’s equations with periodic boundary conditions were computed by preconditioned conjugate-gradient minimization of the block Rayleigh quotient in a planewave basis, using a freely available software package. Johnson2001:mpb We note that near the band-gap edges, the first derivative of the dispersion relation approaches zero, resulting in a strongly reduced group velocity . On the other hand, for the dielectric-like bands Mortensen2007a the eigenmodes are strongly localized in the high-index material near the band-gap edges and thus . Nevertheless, as seen in Fig. 2b, the enhancement factor still exceeds unity by an order of magnitude. This is discussed in more detail, and for 2D photonic crystals such as those in Figs. 1c and 1d, in Refs. Mortensen2007a, and Mortensen2007, . In the inset of Fig. 2b we show the enhancement factor as a function of wavelength in the UV region. The wavelength is calculated for a structure with a period nm, which is attainable using existing fabrication methods. Christiansen2006 We note that for the considered example the enhancement factor exceeds unity by an order of magnitude for wavelengths within the UV range.
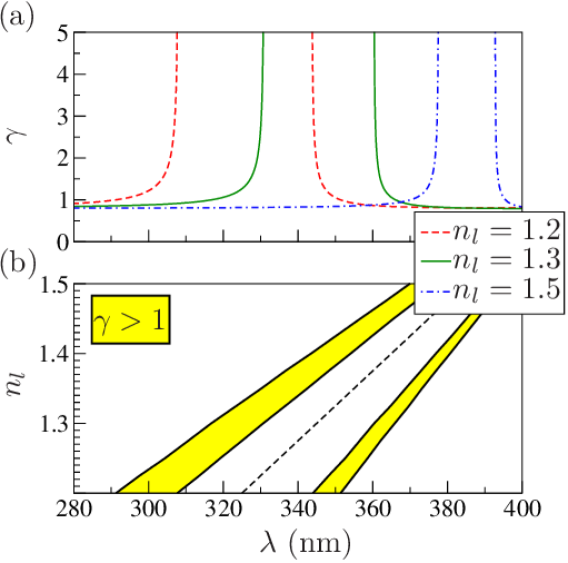
In biochemical applications, the refractive index of the liquid may vary depending on the specific buffer in use. It is thus instructive to investigate the dependence of these results on the refractive index of the liquid. Recently, Erickson et al. showed how the optical properties of planar photonic crystal structures can tuned by varying the liquid refractive index.Erickson2006 The effect is conveniently analyzed within the framework of electromagnetic perturbation theoryMortensen2007a and as the refractive index is increased, spectral features are generally redshifted. The enhancement factor for the Bragg stack of Fig. 2 is shown in Fig. 3a, as a function of wavelength in the UV region for three different values of the refractive index of the liquid. As the index contrast is decreased, the photonic band-gap edges are redshifted and the band gap size is decreased. However, the enhancement factor still exceeds unity within the UV region for all three values of . In Fig. 3b we show a contour plot of the enhancement factor in a versus diagram, indicating the regions in which as the refractive index of the liquid is varied in the range from to . As the index contrast is decreased, the regions of become narrower, but even for a very low index contrast, the enhancement factor still exceeds unity within the UV region. In the figure we have also indicated the position of the center of the relevant band gap, , as a function of the refractive index of the liquid. In this particular case, the enhancement is due to the second-lowest band gap, the center of which can be approximated excellently by obtained by extrapolating the long wavelength limit dispersion relation. The wavelengths for which the enhancement factor exceeds unity thus grow approximately linearly with the refractive indices of either material of the Bragg stack, as is also clearly evident in Fig. 3b. One can thus imagine tuning the dispersion by altering the refractive index of the buffer liquid in which the chiral molecules are deposited. This would allow for alignment of the position of the desired enhancement factor with the relevant absorption wavelengths of the chiral molecules under investigation. Alternatively, one may use the strong frequency dependence of in combination with a tunable laser source to optimize the product to match the enantiomeric composition. The strong frequency dependence of means that the value of may be tuned to match a wide range of enantiomeric compositions, while keeping the frequency within the absorbance peak of the molecules. Consequently, the detection range of current CD measurements may be significantly increased. Finally, while the UV regime is typically the preferred natural regime for CD we envision that the slow-light phenomena can be used to enhance the otherwise even more weakly chiral response in other frequency regimes, thus potentially paving the way for efficient CD at also longer wavelengths such as the visible and near-infrared regimes.
In conclusion, we have shown how dispersive structured media may be used as a means of enhancing measurements of circular dichroism. Due to slow-light phenomena, the optical path length required for the largest signal-to-noise ratio of a CD measurement may be reduced by more than an order of magnitude. Conversely, these ideas may be used to enhance the sensitivity of CD measurements while maintaining the same optical path length. By tuning the dispersion relation, the proposed ideas may be used to accommodate different types of molecules with in principle no loss of sensitivity. While we have only presented results for a 1D Bragg grating here, similar results apply to 2D photonic crystals, for which slow-light phenomena also occur. Mortensen2007a ; Mortensen2007
Acknowledgments. We thank Jacob Riis Folkenberg for stimulating discussions. This work is financially supported by the Danish Council for Strategic Research through the Strategic Program for Young Researchers (Grant No. 2117-05-0037).
References
- (1) L. Chen, Y. J. Zhao, F. Gao, and M. Garland, Appl. Spectrosc. 57, 797 (2003).
- (2) D. Janasek, J. Franzke, and A. Manz, Nature (London) 442, 374 (2006).
- (3) D. Psaltis, S. R. Quake, and C. H. Yang, Nature 442, 381 (2006).
- (4) C. Monat, P. Domachuk, and B. J. Eggleton, Nature Photonics 1, 106 (2007).
- (5) D. Erickson, Microfluid. Nanofluid. 3, (2007), Special issue on ”Optofluidics”, doi: 10.1007/s10404-007-0226-8.
- (6) E. Verpoorte, Lab Chip 3, 42N (2003).
- (7) N. A. Mortensen, S. Xiao, and J. Pedersen, Microfluid. Nanofluid. 3, (2007), doi: 10.1007/s10404-007-0203-2.
- (8) This type of setup is typical of commercial UV-CD apparatus, such as for example the Jasco CD-2095, from which the illustration is derived. See http://www.jascoinc.com.
- (9) See e.g. http://www.jascoinc.com.
- (10) N. A. Mortensen and S. Xiao, Appl. Phys. Lett. 90, 141108 (2007).
- (11) A. M. Cardenas-Valencia, J. Dlutowski, D. Fries, and L. Langebrake, Appl. Spectr. 60, 322 (2006).
- (12) S. G. Johnson and J. D. Joannopoulos, Opt. Express 8, 173 (2001).
- (13) M. B. Christiansen, M. Schøler, S. Balslev, R. B. Nielsen, D. H. Petersen, and A. Kristensen, J. Vac. Sci. Technol. B 24, 3252 (2006).
- (14) D. Erickson, T. Rockwood, T. Emery, A. Scherer, and D. Psaltis, Optics Letters 31, 59 (2006).