Social Browsing & Information Filtering in Social Media
Abstract
Social networks are a prominent feature of many social media sites, a new generation of Web sites that allow users to create and share content. Sites such as Digg, Flickr, and Del.icio.us allow users to designate others as “friends” or “contacts” and provide a single-click interface to track friends’ activity. How are these social networks used? Unlike pure social networking sites (e.g., LinkedIn and Facebook), which allow users to articulate their offline professional and personal relationships, social media sites are not, for the most part, aimed at helping users create or foster offline relationships. Instead, we claim that social media users create social networks to express their tastes and interests, and use them to filter the vast stream of new submissions to find interesting content. Social networks, in fact, facilitate new ways of interacting with information: what we call social browsing. Through an extensive analysis of data from Digg and Flickr, we show that social browsing is one of the primary usage modalities on these social media sites. This finding has implications for how social media sites rate and personalize content.
1 Introduction
The new ’social media’ sites are changing the way Web users interact with information. Unlike traditional Web sites, Flickr, Del.icio.us, Digg, and YouTube, among others, enable users to create and share information, knowledge, and opinions. Social media sites share the following elements: (1) users create or contribute content, (2) users annotate content with descriptive keywords, or tags, (3) users evaluate content, either passively or actively, and (4) users create social networks by designating other users with similar interests as friends or contacts. Social media sites are to be distinguished from the explicit or pure social networking sites, such as LinkedIn, MySpace and Facebook, which allow users to articulate their professional and personal relationships by adding colleagues, classmates and friends to their social networks.
How do users use social networks? Recent research has shown that people tend to use social networking sites to find job recommendations or dates [2], to learn more about people they know offline [7] or simply keep in touch with a diverse group of offline friends [1, 14]. This appears not to be the case with social media sites. In fact, due to their geographic diversity and the practice of using pseudonyms, few of a typical user’s contacts on a social media site are known to her offline. Instead, we believe that social media users create social networks to express their preferences and interests, and use them to filter the vast stream of new submissions to find interesting content. In fact, by exposing user activity, social media sites allow users to leverage the opinions and knowledge of others to solve their own information processing problems, such as information filtering and document rating.
This paper examines how users of two popular social media sites — the social news aggregator Digg (http://digg.com) and the social photosharing site Flickr (http://flickr.com) — use social networks. We claim that rather than searching for interesting new content by keywords (e.g., tags) or subscribing to special interests groups, users browse through the content created by their contacts via the Friends interface. The social network-driven Friends interface allows a user to easily track her friends’ activity: the new content they recently created or liked. In this way social networks facilitate new ways of interacting with information — what we call social browsing. Social browsing is one of the most important usage modalities of social media sites.
The paper is organized as follows. In Section 2 we describe in detail the functionality and features of Flickr and Digg. In Section 3 we describe the datasets and data collection methods. We analyze the data from the two sites in Section 4 to present evidence for the claim that social networks are used for information filtering. Section 5 compares our work to existing research in social networks and other fields, and Section 6 presents our conclusions.
2 Features of social media
Social media sites share common features, no matter what the content that they allow users to share. We illustrate the commonalities on two popular sites: the social news aggregator Digg and the social photosharing site Flickr. Although there are fundamental differences between the two sites — on Flickr, for example, users share content (images) that they themselves create, while on Digg they share content (news stories) that others create — there are also many similarities, which are also found on other social media sites.
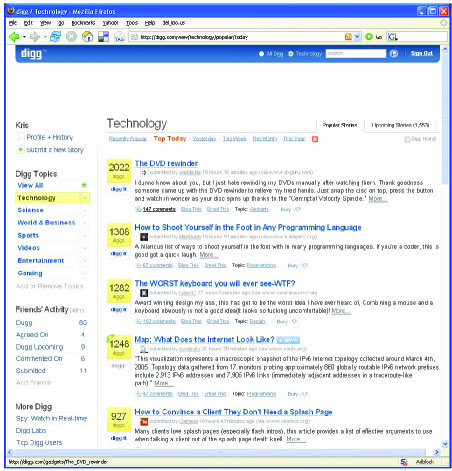
The news aggregator Digg relies on users to submit and moderate news stories. When a story is submitted, it goes to the upcoming stories queue, where it sits while users vote on it. When a story gets enough positive votes, or diggs, it is promoted to the front page. The vast majority of people who visit Digg daily, or subscribe to its RSS feeds, read only the front page stories; hence, getting to the front page greatly increases a story’s visibility. Although the exact promotion mechanism is kept secret and changes periodically, it appears to take into account the number of votes the story receives. Digg’s front page, therefore, emerges by consensus of many independent evaluators.
 |
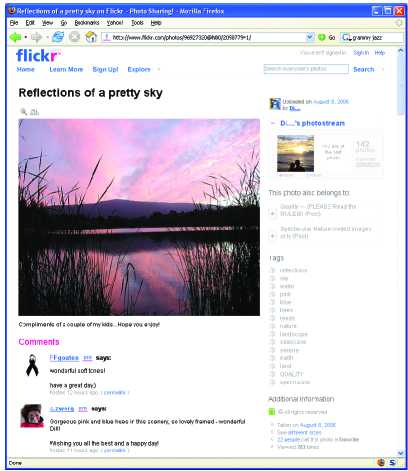 |
| (a) Digg front page | (b) Flickr photo page |
A typical Digg front page is shown in Figure 1(a). The stories are displayed in reverse chronological order of being promoted, 15 stories to the page, with the most recent story at the top. The story’s title is a link to the source, while clicking on the number of diggs takes one to the page describing the story’s activity on Digg: the discussion around it, and the list of people who voted on it.
Like other social media sites, Digg allows users to designate others as friends or contacts and makes it easy to track friends’ activities.111Note that the friend relationship is asymmetric. When user lists user as a friend, user is able to watch the activity of but not vice versa. We call the reverse friend of . If user also marks as a friend, then they are each other’s mutual friends. The left column of the front page in Figure 1(a), the so-called Friends interface, summarizes recent activity of user’s friend: the number of stories they have submitted, commented on or liked (dugg) within the past 48 hours.
Until February 2007 Digg ranked users according to how many of the stories the user submitted were promoted to the front page. Clicking on the Top Users link allowed one to browse through the ranked list of users. There is speculation that ranking increased competition, leading some users to be more active in order to improve their rank. Digg discontinued making the list publicly available, citing concerns that marketers were paying top users to promote their products and services [16], although it is now available through a third party 222http://www.efinke.com/digg/topusers.html.
The photosharing site Flickr lets users upload, manage and share photographs, participate in groups and discussions, etc. Users manage photographs by assigning descriptive labels, called tags, to them. A typical Flickr photo page, shown in Figure 1(b), provides a variety of information about the photo: who uploaded it and when, what groups it has been submitted to, its tags, who commented on the image and when, how many times it was viewed or marked as a “favorite”. A user page shows the latest photos she has uploaded, the images she marked as her favorite, and her profile, which includes a list of their contacts and groups they belong to. A tag page shows either that user’s images tagged with a specific keyword, or all public images that have been similarly tagged. A group page shows the photo pool, group membership, popular tags, discussions and other information about the group. Finally, the Explore page has the calendar view which shows the 500 most “interesting” images uploaded on any day. Like Digg, Flickr uses a secret formula that analyzes user activity to identify most “interesting” images. The Interestingness algorithm is kept secret to prevent gaming the system, but it takes into account “where the clickthroughs are coming from; who comments on it and when; who marks it as a favorite; its tags and many more things which are constantly changing.”333http://flickr.com/explore/interesting/ In addition to these browsing methods, Flickr also provides a map interface that allows users to browse geotagged images.
Like Digg, Flickr allows users to designate others as contacts, and offers an interface equivalent to Digg’s Friends interface, which enables users, with a single click, to see the latest images from their contacts. Unlike Digg, Flickr supports different types contact relationships, with different levels of privacy. A Flickr user can mark another user as a “contact,” “friend,” or “family.” Images can be marked as “private” (visible to the user who uploaded the image only), “friends” and/or “family” only (visible to user’s designated friends and/or family respectively), or “public,” meaning that they are visible to all of user’s contacts through the Friends interface, or to anyone else who navigates to the image page.
3 Data and statistics
For our study, we tracked story and image activity on Digg and Flickr by collecting data from the sites either through specialized Web scrapers, or through an API provided by the site. Because Digg did not provide an API until April 2007, we collected data from it by scraping the site with the help of Web wrappers, created using tools provided by Fetch Technologies444http://fetch.com/. We extracted the following data:
- Digg-frontpage:
-
a list of stories from the first 14 pages of Digg. For each story, we extracted submitter’s name, story title, time submitted, number of votes and comments the story received.
- Digg-all:
-
a list of stories from the first 20 pages in the upcoming stories queue. For each story, we extracted the submitter’s name, story title, time submitted, number of votes and comments the story received.
- Top-users:
-
information about the top 1020 of the recently active users. For each user, we extracted the number of stories the user has submitted, commented and voted on; number of stories promoted to the front page; users’s rank; the list of friends, as well as reverse friends or “people who have befriended this user.”
Digg-frontpage and Digg-all wrappers were executed hourly over a period of a week in May and in July 2006.
We used the Flickr API to download a variety of data for our study. For the data not provided through the API (for example, the number of views), we wrote specialized scrapers to extract this information from the Web pages. Since scraping required a separate HTTP request, this had an effect on the image statistics (e.g., number of views is incremented by every HTTP request). We corrected for this effect in post-processing. We gathered the following data from Flickr:
- Explore set:
-
consisted of the 500 “most interesting” images (as chosen by Flickr’s Interestingness algorithm) uploaded on July 10, 2006. We saved the image’s rank on the first day (the lower the rank, the more interesting the image).
- Apex set:
-
consisted of the 500 most recent images added to the Apex group555http://www.flickr.com/groups/apexgroup/. This group is one of “the best of Flickr” groups that are intended to to showcase the best images and photographers. Photographs can be added to the group only by invitation from another group member.
- Random set:
-
contains 480 most recent of the images uploaded to Flickr on July 10, 2006 around 4 pm Pacific Time. Although we started with 500 images, some were made private or deleted entirely from Flickr, leaving us with a smaller set.
For each image, we collected the name of the user who uploaded the image (image owner); the number of views and comments the image received; number of times it was marked a “favorite”; how many tags it had; the number of groups it was submitted to. We also extracted the names of users who commented on or favorited the image. We also tracked the number of views, comments and favorites received by images in the three datasets hourly over the period of eight days starting July 10, 2006.
In addition to image statistics, we extracted data about Flickr’s social networks. While the site shows a user’s list of contacts, one cannot easily get the list of user’s reverse contacts, i.e., other users who list the particular user as a contact. This is important information, since it shows how many people have access to the user’s photo stream. In order to reconstruct reverse contacts, we crawled Flickr’s network of contacts. We limited the crawl to depth two due to the explosive growth of the network. Starting with about 1,100 unique users from our three datasets, we downloaded these users’ contacts, and their contacts’ contacts. This gave us a network with over 55,000 unique users and 5,000,000 connections. The resulting social network is not complete, but it allows us to estimate the number of reverse contacts a user has.
3.1 Content activity
 |
 |
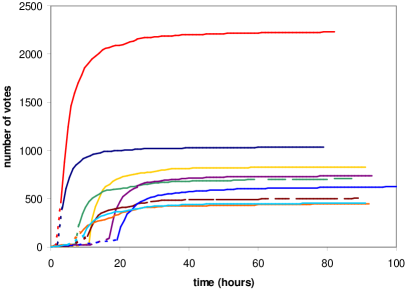
| (a) votes on Digg | (b) views on Flickr |
We identified stories that were submitted to Digg over the course of approximately one day and followed them over several days. Of the stories submitted by distinct users over this time period, only 98 stories by 60 users made it to the front page. Figure 2(a) shows evolution of the number of votes received by a few randomly chosen stories from the set. The basic dynamics of all stories appears the same. While in the upcoming queue, a story accrues votes at some slow rate. Once it is promoted to the front page (indicated by dashes in Figure 2(a)), it accumulates votes at a much faster rate. As the story ages, accumulation of new votes slows down [17], and the story’s rating saturates at some value, indicative of how interesting the story is to the general Digg community.
We tracked the number of views, comments and favorites received by images in the three Flickr datasets hourly over the period of eight days starting July 10, 2006.
The number of views received by the newly uploaded images on Flickr followed a pattern similar to that of votes received by stories on Digg. Figure 2(b) shows the number of times randomly chosen images from the Explore and Random sets were viewed (the number of views received by Apex images, some of them months old, did not change much over the course of the tracking period). The curves are jagged because Flickr updates the counts of views every two hours. Images generally received most of their views within the first two days, after which they were viewed much less frequently, except for some Explore images.
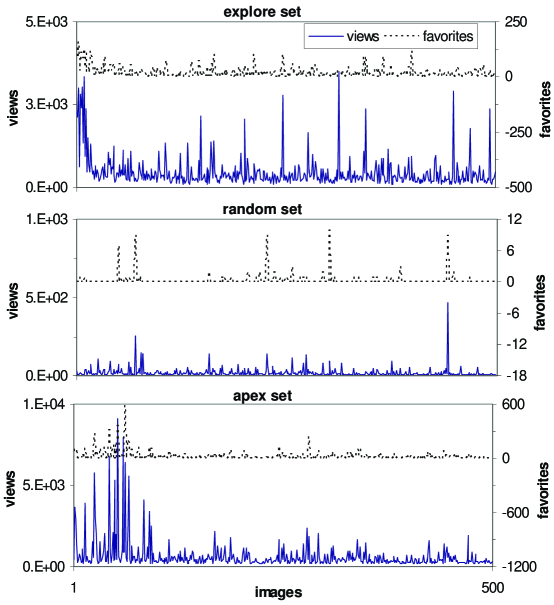
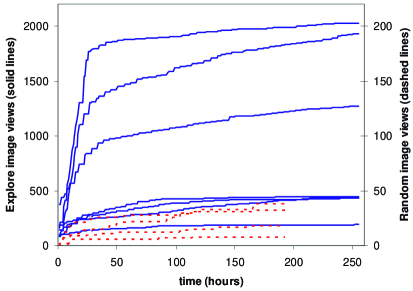
The top-rated Explore images showed the “Explore effect,” a dramatic rise in the number of views received by images featured on the Explore page, Flickr’s version of the front page. The “Explore effect” is pronounced in Figure 3, which shows the total number of times the images in each set were viewed over the course of eight days. While images in the Random set received on average just 20 views, the Explore images (ordered by their Explore rank) received on average 450 views. Apex images show cumulatively more views because they are much older, although there was no significant increase in the number of views over the course of the tracking period. The top 20 Explore images show the biggest overall gain in views. This is probably caused by the following factors: (a) the 10 top ranked images can be posted to the special Interestingness— Must be in Top 10 group,666http://www-us.flickr.com/groups/interestingness/ (b) people who browse Flickr through the calendar interface probably scan the first two pages of images (10 images on each page) without paging further, or most likely because (c) the popular and prominent Explore page features one of the top 20 images from the previous and current days picked at random.
The number of times an image has been marked as a favorite (dotted lines in Figure 3) generally follows the number of views. Marking an image as a favorite is Flickr’s analog of voting on the image, although number of favorites is only part of the formula used to select images for the Explore page.
3.2 Social networks
 |
 |
| (a) Digg | (b) Flickr |
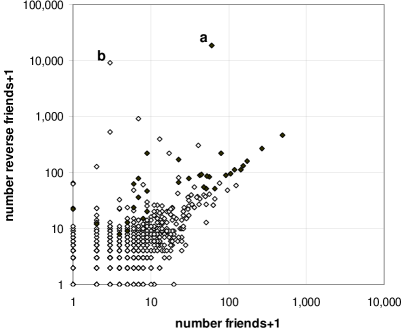
Do users take advantage of the social networking feature of social media sites? Figure 4(a) shows the scatter plot of the number of friends vs reverse friends of the top 1020 Digg users as of May 2006. Black symbols correspond to the top 33 users. For the most part, users appear to add friends to their social networks, with the top users having bigger social networks. Two of the biggest celebrities (watched by most people) are users marked and on Figure 4(a), corresponding and , respectively, one of the founders of Digg and a podcast of the popular Digg stories.
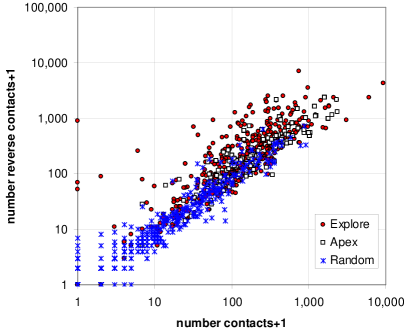
Figure 4(b) shows a similar scatter plot for the approximately 1,100 unique Flickr users who uploaded images in our three datasets. The number of reverse contacts is not directly available and was estimated by crawling the contacts network as explained above. Generally, users in all three datasets had contacts and were listed as contacts (reverse contacts) by other users, with Explore and Apex users being better connected than Random users. The points are scattered around the diagonal, indicating equal numbers of contacts and reverse contacts (possibly indicating mutual contact relationships), although Apex, and especially Explore, users had greater numbers of reverse contacts. Note also that Flickr users appear to be more active in creating social networks compared to Digg users.
4 Social networks and information filtering
What do people do with the social networks they create? We claim that on social media sites, social networks are used for information filtering — to select from the vast stream of new submissions the content that the user will likely find interesting. The filtering is accomplished via the mechanism of social browsing, which simply means using the Friends interface to browse the social media site. We claim that social browsing one of the most important browsing modalities in social media. This has implications on other aspects of social media, e.g., how content and users are ranked, and how content is selected to be featured on the front page.
Below we present evidence to support our claims. First, we present indirect evidence for social browsing on Digg by showing that user’s success is correlated with his social network size. We then present additional evidence that social browsing (through the Friends interface) is used for information filtering, by showing that users tend to like the stories their friends like. In Section 4.2 we analyze data from the Random, Apex and Explore image sets to show that social browsing explains much of the activity generated by new images on Flickr.
4.1 Social browsing on Digg
 |
 |
| (a) | (b) |
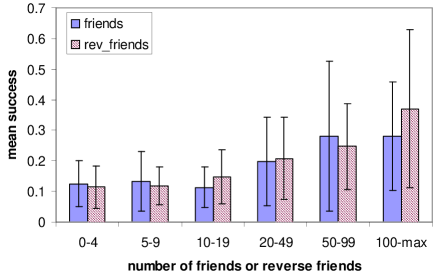
A user’s success rate is defined as the fraction of the stories the user submitted that have been promoted to the front page. We use the statistics about the activities of the top 1020 users to show that users with bigger social networks are more successful at getting their stories promoted to the front page. We only include users who have submitted 50 or more stories (total of 514 users). The correlation between users’s mean success rate and the size of their social network is shown in Figure 5. Data was binned to improve statistics. Despite large error bars, there is a significant correlation between users’s success rate and the size of their social network, more importantly, the number of reverse friends they have. In [9] we constructed a phenomenological model of the dynamics of votes received by stories on Digg. We showed that users with bigger social networks could have less interesting stories promoted to the front page. The high degree of correlation between promotion success rate and submitter’s social network size is in line with those findings.
In the sections below we present a more direct evidence that the Friends interface is used to find new interesting stories. We show this by analyzing two sub-claims: (a) users digg stories their friends submit, and (b) users digg stories their friends digg. By “digging” the story, we mean that users like the story and vote on it.
4.1.1 Users digg stories their friends submit
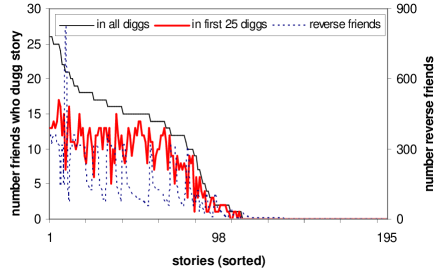
We scraped Digg to collect data about 195 front page stories, including a list of the first 216 users to vote on each story ( distinct users in total). The name of the submitter is first on the list.
We can compare this list, or any portion of it, with the list of the reverse friends of the submitter. The dashed line in Figure 5(b) shows the size of the social network (number of reverse friends) of the submitter. More than half of the stories (99) were submitted by users with more than 20 reverse friends, and the rest by poorly connected users.777These users have rank and were not listed as friends of any of the 1020 users in our dataset. It is possible, though unlikely, that they have reverse friends. The thin line shows the number of voters who are also among the reverse friends of the submitter. All but two of the stories (submitted by users with 47 and 28 reverse friends) were dugg by submitter’s reverse friends.
We use simple combinatorics [11] to compute the probability that of submitter’s reverse friends could have voted on the story purely by chance. The probability that after picking users randomly from a pool of you end up with that came from a group of size is , where . Using this formula, the probability (averaged over stories dugg by at least one friend) that the observed numbers of reverse friends voted on the story by chance is , making it highly unlikely.888If we include in the average the two stories that were not dugg by any of the submitter’s friends, we end up with a higher, but still significant P=0.023. Moreover, users digg stories submitted by their friends very quickly. The heavy red line in Figure 5(b) shows the number of reverse friends who were among the first 25 voters. The probability that these numbers could have been observed by chance is even less — . We conclude that users digg — or tend to like — the stories their friends submit. As a side effect, by enabling users to quickly digg stories submitted by friends, social networks play an important role in promoting stories to the front page.
4.1.2 Users digg stories their friends digg
Do social networks also help users discover interesting stories that were submitted by poorly-connected users? Digg’s Friends interface allows users to see the stories their friends have liked (dugg). As well-connected users digg stories submitted by users who have few or no reverse friends, are others within his or her social network more likely to read them?
 |
 |
| (a) | (b) |
| diggers | m=1 | m=6 | m=16 | m=26 | m=36 | |
|---|---|---|---|---|---|---|
| (a) | visible to friends | 34 | 75 | 94 | 96 | 96 |
| (b) | dugg by friends | 10 | 23 | 37 | 46 | 49 |
| (c) | probability | 0.005 | 0.028 | 0.060 | 0.077 | 0.090 |
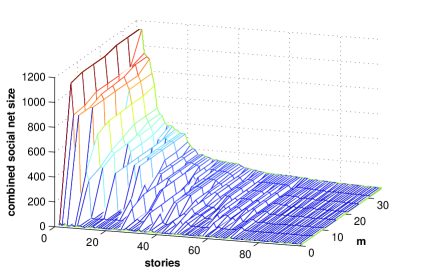
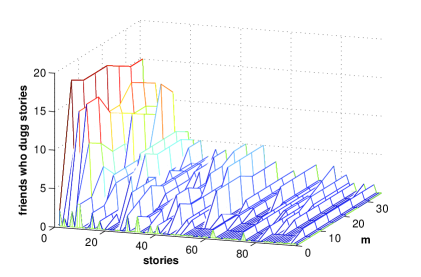
Figure 6 shows how the activity of well-connected users affected the 96 stories submitted by poorly-connected users, those with fewer than 20 reverse friends. corresponds to the user who submitted the story, while corresponds to the story’s submitter and the first five users to digg it. Figure 6(a) shows how the combined social network (number of reverse friends) of the first diggers grows as the story receives votes. Figure 6(b) shows how many of the following 25 votes come from users within the combined social network of the first voters.
At the time of submission (), only 34 of the 96 stories were visible to others within the submitter’s social network and ten of these were dugg by submitter’s reverse friends within the first 25 votes. After fifteen more users have voted, almost all stories are now visible through the Friends interface. Table 1 summarizes the observations and presents the probability that the observed numbers of reverse friends voted on the story purely by chance. The probabilities for through are above the significance level, possibly reflecting story’s increased visibility on the front page. Although the effect is not quite as dramatic as one in the previous section, we believe that the data indicates that users do use the “see the stories my friends have dugg” portion of the Friends interface to find new interesting stories.
4.2 Social browsing on Flickr
How do users find new images on Flickr? Do they find them through groups, or by searching by tags? Do they find them through the Explore page? Or by by browsing through the photo streams of their contacts? We believe that social browsing explains much of the activity generated by new images on Flickr. We present a detailed study of the images from the Random, Apex and Explore sets that help answer these questions.
4.2.1 Pools and tags
 |
 |
| (a) | (b) |
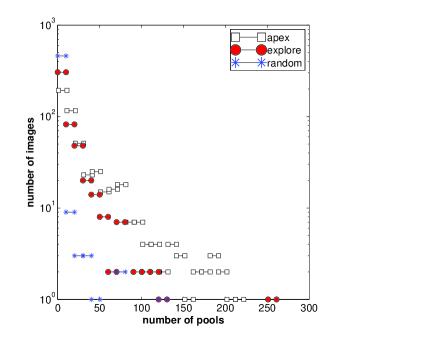
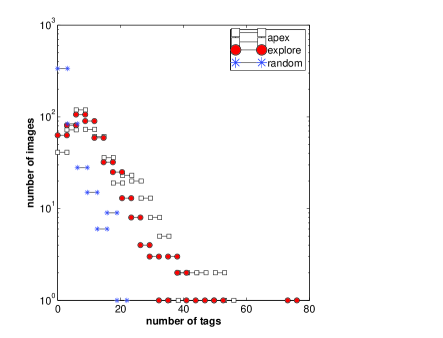
When users upload images to Flickr, they have an option to share them with different groups, each with its own image pool. A large number of special interest groups already exist on Flickr, on a wide variety of topics — everything from Macro Flower Photography to one dedicated to the color orange — with new ones added daily. There is often a substantial overlap between group interests (there are more than a dozen groups dedicated to flowers alone), which results in images being posted to multiple groups. Figure 7(a) shows the distribution of the number of pools to which images in the Explore, Apex and Random sets have been posted. Although a typical user (Random set) does not share images with any groups, some users submit images to a surprisingly large number of groups — several users in the Explore and Apex sets have submitted their images to over 100, and on a few occasions over 200, groups.
Flickr also allows users to tag their images with descriptive keywords. Tagging is advocated by Flickr as a way to improve search of the user’s own, as well as other people’s, images. Figure 7(b) shows patterns in tagging usage across different data sets. Although very few Random users tag their images, Explore and Apex users do tend to use many tags, sometimes as many as 70. Interestingly, there seems to exist a preferred number of tags — around ten — for images in the Explore and Apex sets.
In both their tagging activity, as well as in submitting images to groups, Explore and Apex users are very similar to each other and different from Random users. There is considerable effort involved in sharing an image with a group, suggesting that social aspects of Flickr, such as sharing images with other users through groups and increasing the visibility of an image is very important to users, possibly more than being able to easily find them with tags.
4.2.2 Social networks and views
 |
 |
| Random set | Apex set |
 |
|
| Explore set |
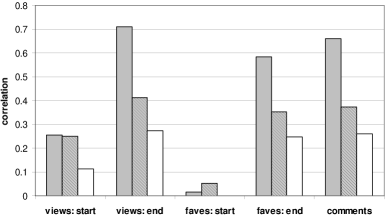
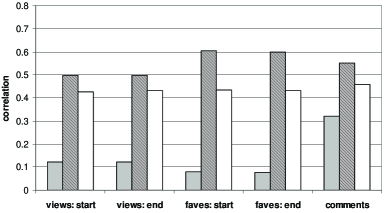
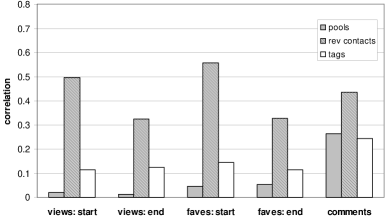
We have shown (in Section 3.2) that users generally take advantage of the social features of Flickr, adding others as friends or contacts to their personal social networks. Flickr gives users instant access to the latest images uploaded by their contacts through the Friends interface (called “Contacts” on Flickr). We claim that this inetrface is one of the more important browsing modalities on Flickr. Unfortunately, Flickr does not provide a record of users who viewed an image. Instead, we establish this link indirectly by showing a correlation between the number of views generated by an image and the number of reverse contacts the image’s owner (user who submitted the image) has. Figure 8 shows the strength of the correlation between image statistics and features, such as the number of contacts and reverse contacts the image owner has, the number of pools to which the image was submitted, and the number of tags it was annotated with.999All the correlations with correlation coefficient are statistically significant at significance level. The image statistics are: (1) the number of views the image received and (2) the number of times it was marked as favorite at the beginning and end of the tracking period and (3) the number of comments it received.
Apex and the Explore sets show similar correlation values at the start of the tracking period, where the number of views, comments and the number of times the image was favorited correlates strongly (or at least moderately) with the number of reverse contacts the user has. At the end of the tracking period, however, the number of views, favorites and comments for the images in the Explore set is less strongly correlated with the size of the user’s social network. This could be explained by the greater public exposure images receive through the Explore page. Groups seem not to play a significant role in generating new views, favorites or comments for these images. Tags appear to be uncorrelated with image activity in the Explore set, but somewhat correlated in the Apex set. This could be explained by users clicking on the “apex” tag (that all Apex photos are required to have) to discover new photos in that pool.
The data presented above shows that, at least until the image gets to the Explore page, the number of views (favorites and comments) that images produced by good photographers receive correlates most strongly with the number of reverse contacts the image owner has. This is best explained by social browsing, which predicts that the more reverse contacts a user has, the more likely his or her images are to generate views.101010Flickr claims that its Interestingness algorithm takes other factors besides views into account to reduce the presence of popular photographers on Explore. Rather than using a complicated formula mentioned earlier in this paper, they could simply compute whether an image received a greater than expected number of views, favorites and comments. This simple heuristic could help identify truly exceptional images. Views gathered by Random images correlate most strongly to the number of pools the image was submitted to, and only moderately to the number of reverse contacts. Since users in the Random sets have smaller social networks, they get more exposure by posting images to groups.
 |
 |
| (a) Random | (b) Apex and Explore |
4.2.3 Social networks and comments
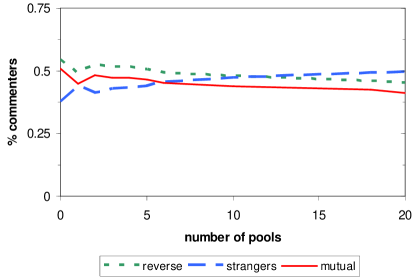
We collected the names of users who commented on images in the three datasets and compared them to the names of users in the image owners’ social networks. Figure 9 shows the proportion of comments coming from owner’s reverse contacts, mutual contacts and strangers (users outside of the owner’s social network). For Random images (Figure 9(a)) that were not added to any pools, came from users who list the owner as a contact, came from users who are mutual contacts of the owner, while only came from users outside of the owner’s social network. As the image is posted to more and more pools, its visibility to users outside of the owner’s social network grows. For Random images that have been posted to 20 or more pools, only of the comments came from mutual contacts, while the proportion of comments coming from strangers grew to .
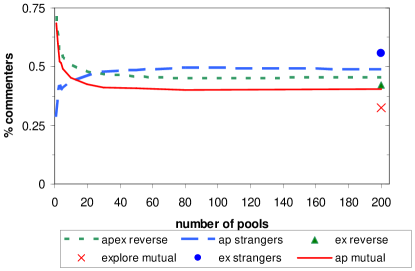
These observations are even more pronounced for the Apex images, shown in Figure 9(b). For Apex images that appear in only one pool (Apex itself), the share of comments made by owner’s mutual and reverse friends is and respectively. Only of the comments came from strangers. As the image gets shared with more groups, its visibility to outsiders increases, up to a point. After an image has been submitted to 30 groups, the share of the comments made by mutual contacts drops to , reverse contacts drops to , while the share of the comments coming from strangers grows to . The image’s visibility to strangers does not appear to increase by posting to additional groups. Sharing the image with 50 or more groups (up to 200) does not significantly change the distribution of comments coming from contacts and strangers. This seems to indicate that few of the groups are actively viewed (and commented on) by users.111111Groups such as the various 1-2-3 groups, Score Me or Delete Me groups require that the user view, favorite or comment on other images in the pool before submitting their own images. These groups are likely the ones driving most of the traffic associated with posting images to groups.
The symbols in Figure 9(b) are for the Explore images. We collected comments at the end of the tracking period, after they have been publicly shared through the Explore page. For this set, of the comments come from strangers, far more than for the other two sets, reflecting the Explore images’ greater public exposure. Still, about a third of the comments come from mutual and from reverse contacts, showing that the owner’s social network is still active in commenting on and presumably viewing the images.
In summary, we studied three groups of images: (a) images chosen randomly from those uploaded on a specific day (Random set), (b) images deemed by other photographers to be of exceptional quality (Apex set) and (c) images chosen by Flickr’s Interestingness algorithm to be the best of those uploaded on a specific day (Explore set). We analyzed a number of metrics associated with these images — the number of views, comments and favorites they generated — and studied the relationship of these metrics to features such as the number of pools they were submitted to, the number of tags associated with the images, and the size of the users’ social networks. Explore and Apex images appear very similar on a number of metrics, despite the fact that Apex images are months old (and presumably had more time to be submitted to more pools or accumulate more tags) and very different from the Random images. Judging by the size of social networks, photographers from these two sets are also very similar — and distinct from the Random photographers. This suggests that Interestingness algorithm does as good a job of selecting good photographers as users do.121212Surprisingly, there is only a agreement between Interestingness and photographers, because only 10% of Apex images were featured on the Explore page in the past.
5 Related Research
Many Web sites that provide information (or sell products or services) use collaborative filtering technology to suggest relevant documents (or products and services) to its users. Amazon and Netflix, for example, use collaborative filtering to recommend new books or movies to its users. Collaborative filtering-based recommendation systems [6] try to find users with similar interests by asking them to rate products and then compare ratings to find users with similar opinions. Researchers in the past have recognized that social networks present in the user base of the recommender system can be induced from the explicit and implicit declarations of user interest, and that these social networks can in turn be used to make new recommendations [5, 12]. Social media sites, such as Digg and Flickr, are to the best of our knowledge the first systems to allow users to explicitly construct social networks and use them for information filtering. In addition to filtering, these social networks can be used for information personalization, e.g., personalizing search results [10].
Social navigation, a concept closely linked to collaborative filtering, helps users evaluate the quality of information by exposing information about the choices made by other users “through information traces left by previous users for current users” [3]. Exposing information about the choices made by others has been has been shown [15, 17] to affect collective decision making and lead to a large variance in popularity of similar quality items. Unlike the present work, these research projects took into account only global information about the preferences of others (similarly to the best seller lists and Top Ten albums). We believe that by exposing local information about the choices of others within your community, social browsing can lead to more effective information filtering and collective decision making.
The proliferation of online networks [4] has provided interesting datasets about the behavior of large groups and fueled interest in social networks from a variety of scientific disciplines. Researchers have found that online social networks tend to augment existing off-line relationships, and are often used to obtain emotional support or expertise the user may lack in her offline world [1]. The rise of social networking sites such as LinkedIn, Friendster, MySpace, Facebook, and many others, has introduced another interesting domain to the study of computer-mediated interactions. These sites are mainly used to link people who know each other offline: LinkedIn is used to express professional relationships between colleagues, while sites like Facebook and MySpace express friendship between college classmates and friends. These sites are used to enhance offline interactions, by finding recommendations for new jobs, dates [2], or simply keeping in touch with a diverse group of existing offline friends [7], rather than finding new online friends. Social media sites are very different in nature from the purely social networking sites mentioned above. Although some of the social network connections on these sites express offline relationships, they play but a minor role in the interactions found on these social media sites. Instead, the public sharing of content and metadata (e.g., tags) on sites like Digg and Flickr enables new social processing applications, such as document evaluation and ranking [9, 8], information discovery [13] and personalization [10].
6 Conclusion
Social media sites such as Flickr and Digg are on the leading edge of the social Web revolution. These sites allow users to share and manage content, participate in discussions, rate other people’s activities, etc. Importantly, they also allow users to designate other users as friends or contacts. The resulting social networks offer users new ways to interact with information, through what we call social browsing or social filtering.131313These are part of a broader activity we call social information processing.
We studied social browsing on two popular social media sites: the photosharing site Flickr and news aggregator Digg. We showed that social networks form a basis for an effective information filtering system, suggesting to users the stories his friends have found interesting. Users take advantage of these recommendations simply by using the Friends interface to browse the site. One of the implications of this finding, elaborated in [9], is that social browsing is the process by which consensus, and the front (or Explore) page, emerge from the distributed opinions of many voters. Rather than choosing complicated formulas to compensate for the effect of social networks, Digg and Flickr could simply select content based on whether it drew greater than expected attention through views, favorites and comments.
We also claimed that social browsing is an important user interface modality on Flickr. We offered two sources of evidence for this claim. First, we showed that for the images produced by good photographers, the views and favorites they receive correlate most strongly with the number of reverse contacts the photographer has. We showed this relationship directly by linking comments to the users in the photographer’s social network. Almost of the comments on the images of good photographers, and of the Random ones, come from other users within the photographer’s social network. Tags and pools are a less important ways to share images, except for Random users, who do not have large social networks. For both Digg and Flickr, while the front page (Explore page on Flickr) helps to generate a large number of views and votes for the content (stories and images respectively), the size of the submitter’s social network appears to be the key to promoting content to the front page.
Social media sites show that it is possible to exploit the activities of others to solve hard information processing problems. We expect progress in this field to continue to bring novel solutions to problems in information processing, personalization, search and discovery.
Acknowledgements
The author wishes to acknowledge Laurie Jones and Dipsy Kapoor for their invaluable help in gathering and processing data from Flickr and Digg. This research is based on work supported in part by the National Science Foundation under Award Nos. IIS-0535182 and BCS-0527725.
References
- [1] J. Boase, J.B. Horrigan, B. Wellman, and L. Rainie. The strength of internet ties. Technical report, Pew Internet & American Life Project, Washington DC, January 2006.
- [2] d. boyd. Friendster and publicly articulated social networks. In Proceedings of Conference on Human Factors and Computing Systems (CHI 2004), 2004.
- [3] A. Dieberger, P. Dourish, K. H k, P. Resnick, and A. Wexelblat. Social navigation: techniques for building more usable systems. interactions, 7(6):36 –45, Nov/Dec 2000.
- [4] L. Garton, C. Haythornthwaite, and B. Wellman. Studying online social networks. JCMC, 3(1), 1997.
- [5] H. Kautz, B. Selman, and M. Shah. Referralweb: Combining social networks and collaborative filtering. Communications of the ACM, 4(3):63–65, 1997.
- [6] J. A. Konstan, B. N. Miller, D. Maltz, J. L. Herlocker, L. R. Gordon, and J. Riedl. GroupLens: Applying collaborative filtering to Usenet news. Communications of the ACM, 40(3):77–87, 1997.
- [7] C. Lampe, N. Ellison, and C. Steinfeld. A face(book) in the crowd: Social searching vs. social browsing. In Proceedings of Conference on Computer Supported Collaborative Work (CSCW-2006), 2006.
- [8] K. Lerman. Dynamics of collaborative rating of information. In KDD workshop on Social Network Analysis (KDD-SNA07), 2007.
- [9] K. Lerman. Social information processing in social news aggregation. IEEE Internet Computing: special issue on Social Search, 2007.
- [10] K. Lerman, A. Plangrasopchok, and C. Wong. Personalizing results of image search on flickr. In AAAI workshop on Intelligent Techniques for Web Personlization, 2007.
- [11] A. Papoulis. Probability and Statistics. Prentice Hall, Englewood Cliffs, NJ, 1990.
- [12] S. Perugini, M. Andr Gon alves, and E. A. Fox. Recommender systems research: A connection-centric survey. Journal of Intelligent Information Systems, 23(2):107 – 143, September 2004.
- [13] A. Plangrasopchok and K. Lerman. Exploiting social annotation for resource discovery. In AAAI workshop on Information Integration on the Web (IIWeb07), 2007.
- [14] L. Reichelt. Ambient intimacy. blog post, March 1 2007.
- [15] M.J. Salganik, P.S. Dodds, and D.J. Watts. Experimental study of inequality and unpredictability in an artificial cultural market. Science, 311:854, 2006.
- [16] J. Warren and J. Jurgensen. The wizards of buzz. Wall Street Journal online, Feb 2007.
- [17] F. Wu and B.A. Huberman. Novelty and collective attention. Technical report, Information Dynamics Laboratory, HP Labs, 2007.