The Active Nucleus of IC 4970: A Nearby Example of Merger-Induced Cold-Gas Accretion
Abstract
We present results from Chandra X-ray and Spitzer mid-infrared observations of the interacting galaxy pair NGC 6872/IC 4970 in the Pavo galaxy group and show that the smaller companion galaxy IC 4970 hosts a highly obscured active galactic nucleus (AGN). The keV X-ray luminosity of the nucleus is variable, increasing by a factor to erg s-1 (bright state) on ks timescales. The X-ray spectrum of the bright state is heavily absorbed ( cm-2 for power law models with ) and shows a clear keV Fe K line with equivalent width of eV. Limits on the diffuse emission in IC 4970 from Chandra X-ray data suggest that the available power from Bondi accretion of hot interstellar gas may be an order of magnitude too small to power the AGN. Spitzer images show that nonstellar emission is concentrated in the central kpc of IC 4970, consistent with high obscuration in this region. The mid-infrared colors of the nucleus are consistent with those expected for a highly obscured AGN. Taken together these data suggest that the nucleus of IC 4970 is a Seyfert , triggered and fueled by cold material supplied to the central supermassive black hole as a result of the off-axis collision of IC 4970 with the cold-gas rich spiral galaxy NGC 6872.
Subject headings:
galaxies: active – galaxies:clusters: general – galaxies: individual (IC 4970) – galaxies: interactions – infrared: galaxies – X-rays: galaxies1. INTRODUCTION
Supermassive black holes are known to exist at the centers of most galaxies. The strong correlation of the central supermassive black hole mass with the mass of the host galaxy’s stellar bulge, as represented by the central stellar velocity dispersion (Ferrarese & Merritt 2000; Gebhardt et al. 2000) or K-band absolute magnitude (Marconi & Hunt 2003), indicates that the evolution of the central black hole and that of its host galaxy are inextricably linked. Most recent work relating the activity of the central supermassive black hole to galaxy evolution has focused on the interaction of radio-loud active galactic nuclei (AGN) with their environment, in order to resolve the cooling flow problem in galaxy clusters and bring hierarchical models of galaxy formation into agreement with observations of galaxies at low redshift (see, e.g., Dunn & Fabian 2006; Best et al. 2006; Croton et al. 2006). Hardcastle et al. (2007) separated these AGN into two classes, low excitation and high excitation radio galaxies, based on their optical emission line characteristics, and suggested that the observed differences between the two classes are determined by the fuel source and accretion mode of the central black hole. Low excitation radio galaxies tend to be massive, dominant elliptical galaxies, residing in the deep dark matter potentials near the cores of large groups and rich clusters, and are surrounded by an ample supply of hot gas from the intracluster medium falling into their large gas halos. They show no evidence for a standard, geometrically thin, optically thick, luminous accretion disk. Radiatively inefficient Bondi accretion of hot gas accreted from their surroundings onto the central supermassive black hole is sufficient to supply the total energy, mechanical as well as radiative, observed in these systems. In contrast, high excitation radio galaxies (containing the most powerful radio galaxies known) exhibit high-excitation, narrow-line optical emission in their spectra, characteristic of emission from an accretion disk. Hardcastle et al. (2007) argue that AGN activity in these galaxies is powered by radiatively efficient accretion of cold gas acquired in a major merger with a massive cold-gas-rich partner. The high radio power and jets observed in high excitation radio galaxies often may result from the formation of a rapidly spinning nucleus from the coalescence of the merging galaxies’ two massive black holes (Wilson & Colbert 1995; Capetti & Balmaverde 2005).
Since cold-gas accretion is associated with the galaxy’s interaction and merger history, and does not depend on the depth of the dark matter potential or the presence of a hot intracluster medium, galaxy collisions of lower mass galaxies with dusty, gas-rich partners in galaxy groups also would be expected to trigger AGN activity and black hole growth. Gravitational and hydrodynamical forces, induced by the galaxies’ mutual interaction, funnel dust and cold gas from the gas-rich partner into the interacting, lower-mass companion galaxy’s nuclear region, where it settles into an optically thick accretion disk before subsequently accreting onto the central black hole. As in the evolutionary model of Churazov et al. (2005), accretion onto the supermassive black hole is radiatively efficient and radio emission from the AGN may be weak or absent. Such galaxy collisions were likely frequent at high redshift (), when the fraction of blue, gas-rich starforming galaxies in moderately massive galaxy groups was high and galaxies were rapidly evolving (Cooper et al. 2006; Gerke et al. 2007). Thus, while perhaps less dramatic than radio-loud systems, cold-gas accretion in off-axis galaxy collisions and minor mergers may play an equally important role in the evolution of lower mass galaxies and moderately massive galaxy groups into what we see today.
Observations of nearby interacting galaxies in similarly moderately massive groups offer a unique window into the dynamical processes that triggered AGN activity in lower mass galaxies and influenced the coevolution of the host galaxy with its central supermassive black hole at this earlier epoch, when galaxies were rapidly transforming. The Pavo group is such a nearby () group with a cool keV intra-group medium, member galaxies and velocity dispersion km s-1 (Machacek et al. 2005) similar to the properties of groups observed in the DEEP2 survey (Gerke et al. 2005). In the top panel of Figure 1, we present a Bj-band image of the dominant Pavo group galaxies, showing the elliptical galaxy NGC 6876 at the Pavo group center and the large, gas-rich tidally-distorted SAB(rs)c spiral galaxy NGC 6872, located to the northwest. The smaller lenticular galaxy IC 4970, that is only to as massive as the spiral galaxy NGC 6872 (Mihos et al. 1993), is located to the north of NGC 6872’s center near a break (‘knee’) in NGC 6872’s northern tidal arm. The small km s-1 line-of-sight velocity difference111All line-of-sight velocities in this paper are taken from the CfA Redshift Survey by Martimbeau & Huchra. Online versions of the catalog, supporting software, and documentation on the CfA Redshift Survey are available at http://cfa-www.harvard.edu/~huchra/zcat. between IC 4970 and NGC 6872 suggests that the galaxy pair forms a spiral-dominated subgroup, while XMM-Newton observations of a hot, gas trail linking, in projection, the central elliptical galaxy NGC 6876 and NGC 6872/IC 4970 indicate that the NGC 6782/IC 4970 subgroup has recently passed supersonically through the Pavo group core (Machacek et al. 2005). Thus the Pavo group, like groups at high redshift, may be dynamically young and the interactions between galaxies representative of those important to galaxy evolution at that earlier epoch.
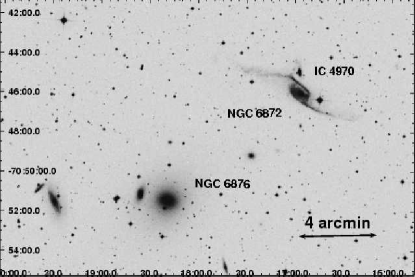
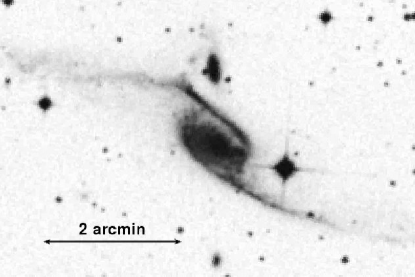
IC 4970 and NGC 6872 have long been known to be a tidally interacting galaxy pair (Vorontsov-Velyaminov 1959). As shown in the bottom panel of Figure 1, tidal tails extend outward more than kpc () to the east and west from the tip of NGC 6872’s spiral arms. A stellar bridge connects the ‘knee’ in NGC 6872’s northern arm and tidal tail to the lenticular companion galaxy IC 4970, indicating that tidal interactions between IC 4970 and NGC 6872 are ongoing. The spiral galaxy NGC 6872 is gas rich. From CO J=1-0 line emission, Horellou & Booth (1997) infer of molecular hydrogen in NGC 6872’s central region. Although atomic hydrogen is not observed near the center of the spiral galaxy, of HI gas is distributed along the full extent of NGC 6872’s spiral arms and associated tidal tails (Horellou & Booth 1997; Horellou & Koribalski 2007) and of HI gas is seen along the direction of IC 4970, that may be associated with the companion galaxy (Horellou & Koribalski 2007). H emission traces ionized gas from recent star formation along NGC 6872’s outer spiral arms to the ends of the tidal tails and from the ‘knee’ north in the stellar bridge (Mihos et al. 1993). The distribution of H corresponds closely to the distribution of young star clusters observed in this system (Bastian et al. 2005). However, Mihos et al. (2003) found no H emission from the central regions of NGC 6872 or associated with the companion galaxy IC 4970.
In this paper we focus on the effects of the IC 4970/NGC 6872 collision on the lower mass participant IC 4970, based on Chandra X-ray and Spitzer mid-infrared observations that show IC 4970 hosts a highly-obscured active nucleus. Results for the two massive galaxies, NGC 6872 and NGC 6876, and the Pavo group gas from these observations will be reported in subsequent papers (Machacek et al. 2007a,b in preparation). Our discussion is organized as follows: In §2 we briefly review the Chandra and Spitzer observations and our data reduction and processing procedures. In §3 we present our main analysis results. We discuss the X-ray time variability of the nuclear point source in §3.1, its X-ray spectral properties in §3.2, and mid-infrared flux densities and colors in §3.3, and show that these properties are consistent with the classification of IC 4970’s nucleus as a highly obscured Seyfert . In §3.4 we briefly discuss the properties of a nearby ultra-luminous X-ray source and in §3.5 place limits on the amount of hot gas outside the central region of the galaxy. In §4 we determine the mass of the central black hole in IC 4970 and discuss possible accretion modes, concluding that nuclear activity in IC 4970 is most likely triggered and fueled by cold gas driven into the nucleus during IC 4970’s ongoing off-axis collision with the dust- and gas-rich spiral galaxy NGC 6872. We summarize our results in §5. Unless otherwise indicated, we quote confidence levels for the uncertainties in spectral parameters and uncertainties on counts and count rates. Coordinates are J2000.0. Adopting the flat CDM cosmology from the three year WMAP results ( km s-1 Mpc-1 , , Spergel et al. 2007), the luminosity distance to the Pavo Group () is Mpc and corresponds to a distance scale of kpc.
2. OBSERVATIONS AND DATA REDUCTION
2.1. Chandra Observations
Our X-ray data consist of two observations of the Pavo galaxy group, including IC 4970, taken with the ACIS-I detector (Garmire et al. 1992; Bautz et al. 1998) on board the Chandra X-ray Observatory on 2005 December 14-15 (OBSID 7248) and 2005 December 16-17 (OBSID 7059) with total exposures of and ks, respectively. The nominal ACIS-I aimpoint was adjusted in the negative Y-axis direction away from the nucleus of the spiral galaxy NGC 6872 to prevent chip gaps from falling on the tidal features and diffuse emission regions of interest. The data were analyzed using standard X-ray analysis packages CIAO3.3, FTOOLS, and XSPEC 11.3.0. The data were filtered to remove events with bad grades (, , ), and those that fell on hot pixels. Events, flagged in VFAINT mode as having excessive flux in the border pixels surrounding event islands were also removed, resulting in a factor improvement in the rejection of particle backgrounds at energies below keV. We then reprocessed the data and created response files using the most recent gain tables and instrumental corrections, including corrections for the charge transfer inefficiency of the ACIS-I forward illuminated CCDs, the time-dependent build-up of contaminants on the telescope optical filter (Plucinsky et al. 2003), and the secular drift of the average pulse height amplitude for photons of fixed energy (tgain).222See http://cxc.harvard.edu/contrib/alexey/tgain/tgain.html Periods of anomalously high and low count rates were removed from each observation using the script lc_clean acting on events in the keV energy band from the I0 CCD, where there were no bright sources. This resulted in useful exposures of s for OBSID 7248 and s for OBSID 7059.
Background files for image analysis were generated using the s source free data set acisi_D_01236_bg_evt_010205.fits, appropriate for the date and instrument configuration of our observation.333see http://cxc.harvard.edu/contrib/maxim/acisbg The background files were normalized by comparing rates in the keV energy band, where particle background dominates. We found that the keV event rates in our observations were () higher in OBSID 7248 (7059), respectively, than that found in the source free datasets. We thus applied an additional scaling factor of () to the source free data sets for OBSID 7248 (7059), respectively, to bring the keV source free event rates into agreement with the observations.
2.2. Spitzer Observations
We observed NGC 6872/IC 4970 in the mid-infrared (, , , and wavebands) on 2005 September 18 using the Infrared Array Camera (IRAC; Fazio et al. 2004; Hora et al. 2004) on board the Spitzer Space Telescope (Werner et al. 2004), as part of a s Spitzer IRAC observation (AORID 14699264) of the Pavo Galaxy Group. Our IRAC observation of the Pavo group used two fixed positons to ensure coverage of both the central group elliptical galaxy NGC 6876 and the NGC 6872/IC 4970 interacting galaxy pair. We used the s HDR mode and a -position, large-scale random dithering pattern to minimize latency artifacts, while providing sufficient redundancy for reliable removal of cosmic rays and scattered light artifacts. This resulted in an effective integration time at the position of IC 4970 of s in the and wavebands and s in the and wavebands. We used Basic Calibrated Data reprocessed by the Spitzer Science Center S14.0 pipeline on 31 May 2006 to include the super-boresight correction for improved astrometry. The Basic Calibrated Data frames in all four IRAC wavebands were cleaned using the script cosmetic.pl in the Spitzer Science Center data analysis software suite MOPEX (version 030106) to mitigate muxiplexer bleed, and to correct for column pulldown and dropouts. We then used the ‘post-Basic Calibrated Data’ processing suite IRACproc 4.1.2 (Schuster et al. 2006) with linear interpolation and pixel size to reject outliers and prepare mosaics, registered on the same sky grid, in each waveband. A small, residual background gradient persisted across the mosaics in each channel. We modeled this background gradient using the SExtractor 2.5.0 software package (Bertin & Arnouts 1996). All of the resulting background maps were inspected and found free of anomalies that would contaminate the photometry. We then subtracted the background map for each channel from the data to create the final background-subtracted mosaics.
3. Data Analysis
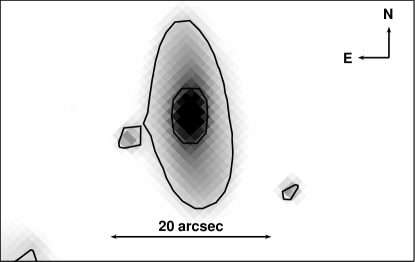
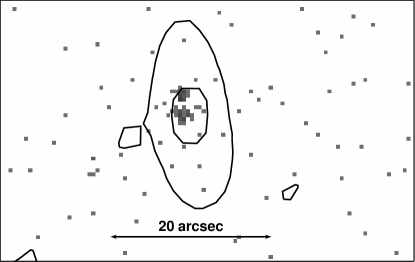
In the top panel of Figure 2 we show a Spitzer IRAC image of IC 4970, tracing the stellar distribution in the galaxy. For reference, and mJy arcsec-2 contour levels for the emission are also shown. The emission seen in the lower southeast corner of the image is from the northern spiral arm of NGC 6872. In the bottom panel of Fig. 2 we show the keV Chandra X-ray image of the same field, using the superposed contours from the top panel to delineate the stellar extent of IC 4970. X-ray emission from IC 4970 is concentrated in two point sources within the central kpc () of the galaxy with one point source located at the nucleus (, ), and one kpc () to the north (, ). The analysis regions we use to study these sources and diffuse emission in IC 4970 are listed in Table 1.


3.1. Nuclear X-ray Variability
The X-ray luminosity of IC 4970 is dominated by emission from the nuclear point source. Enhanced nuclear activity is often found as a result of gas rich mergers, either in the form of a circumnuclear starburst or increased AGN activity. To explore the nature of the nuclear source in IC 4970, we constructed light curves in the keV energy band for our two observations, that were taken ks apart, using an elliptical region with semiaxes of and (denoted ‘nucleus’ in Table 1) and ks binning to reduce statistical scatter. Errors were calculated using the Gehrels method for low count rate data (Gehrels 1986). Light curves for the nucleus, calculated with and without background subtraction, showed no significant difference. Figure 3 shows that the nucleus is highly variable, with the mean count rates, cnts s-1 for Obsid 7248 (left panel) and cnts s-1 for Obsid 7059 (right panel), increasing by a factor over the ks interval between the observations. To check for any systematic variation in count rate between the two observations, we used the same energy band and time binning to compute the light curve for a circular region outside IC 4970 (denoted ‘IGM’ in Table 1). We find no statistically significant time variation between the two observations for region ‘IGM’. Scaling the observed IGM count rate by the ratio of the solid angles for the two regions (‘nucleus’ and ‘IGM’), we find that the mean IGM background count rates for IC 4970’s nucleus, cnts s-1 and cnts s-1 for the two observations, agree within their uncertainties.
Short time scale variability is not expected for circumnuclear starbursts. Thus the observed variability strongly suggests that the nucleus of IC 4970 is an AGN.
3.2. Nuclear X-ray Spectra and Luminosities


We extracted the spectrum of IC 4970’s nucleus in the same elliptical region used to construct the light curves, and used a local background annulus concentric with the nucleus with inner and outer radii of and , respectively, (denoted ‘nucleus bkg’ in Table 1) to subtract the background.
3.2.1 Bright State
We found net source counts in the keV energy band for the bright state (Obsid 7059). Bright unresolved sources observed with ACIS may be subject to pileup, where two or more photons incident on the same detection cell are recorded as a single event with a pulse height amplitude that is roughly the sum of the individual event pulse height amplitudes (Davis 2001). From the observed mean count rate per s frame ( cnts frame-1) for the nucleus in the bright state, we used PIMMS to estimate a pileup fraction of in our data, such that pileup should not significantly affect our results. We grouped the spectrum to ensure a minimum of counts per bin. As shown in the left panel of Figure 4, the spectrum is highly absorbed and shows a clear keV Fe K line.
We model the spectrum over the keV range using a power law model with an added narrow Gaussian to model the Fe K line. The model is corrected for absorption using photoelectric cross sections from Morrison & McCammon (1983). For the narrow Gaussian line profile, we fix the central line energy at keV, and redshift at . If we allow all other parameters to vary freely, we find a best fit hydrogen absorbing column of cm-2 . Although the central value for the photon index from this fit () is consistent with that expected for an AGN, is poorly constrained. We thus also fix the photon index in our models to lie in the range typical for highly obscured AGN (Cappi et al. 2006). The results of our spectral fits are summarized in Table 2. For , we find column densities of cm-2 with uncertainties and Fe K line equivalent widths of eV. The intrinsic X-ray luminosity of the nucleus in the bright state is high, with a keV luminosity of erg s-1 , where the errors reflect the uncertainty in the photon index in the spectral models.
3.2.2 Faint State
The spectrum of the faint state (Obsid 7248) is shown in the right panel of Figure 4. There are net source counts for the faint state in the keV energy band with only net source counts below keV. We grouped the spectrum using a predefined grouping for very faint sources that results in channels of approximately constant logarithmic width, and restricted our spectral fits to the keV energy band. We again model the spectrum using absorbed power law models with fixed photon index in the range . The in the model fits to the faint state favor steeper , as expected for a Seyfert nucleus. The hydrogen absorption column for these models is cm-2 , with uncertainties from the spectral fits, in agreement with the spectral model fits for the bright state (See Table 2). The keV X-ray luminosity of the nucleus in the faint state is erg s-1 , where the uncertainties are due to the uncertainty in the spectral model .
Thus, with these data, we see no significant difference between the bright and faint states in either the power law slope or hydrogen absorption column. We find only that the X-ray luminosity is reduced by a factor .
3.2.3 Soft Emission in the Nucleus
There are a total source counts from the nuclear region in the keV energy band for the combined observations. If we assume that this soft emission is solely due to thermal emission from hot gas in the nuclear region outside the obscuring torus, we can place an upper limit on the amount of hot gas within kpc of the nucleus. Using Anders & Grevasse (1989) abundances and assuming solar metallicity, the spectrum of this soft emission is consistent with an absorbed thermal APEC model (Smith et al. 2001) with absorbing column cm-2 and temperature keV (), and an estimated keV intrinsic luminosity of erg s-1 . From the spectral model normalization and assuming uniform filling, we estimate an electron density and hot gas mass in the nuclear region of cm-3 and , respectively.
3.3. IRAC Mid-Infrared Colors of the Nucleus
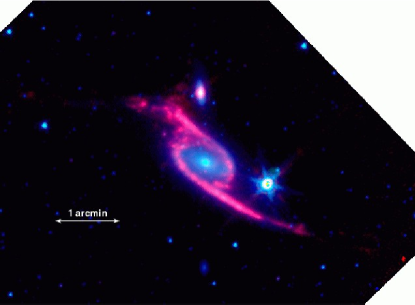
Heavily absorbed nuclear regions of galaxies are typically bright in the mid-infrared. Figure 5 shows a composite IRAC mosaic of the NGC 6872/IC 4970 system. Blue and green denote and emission, respectively, that trace old stars in the galaxies. The emission is a combination of starlight and ‘nonstellar’ emission sources such as warm dust and AGN. We model the stellar contribution by averaging background-subtracted and emission maps that have each been aperture corrected and scaled to the waveband using the mid-infrared colors of M0III stars. We then subtract this model from the background-subtracted mosaic to produce a map of ‘nonstellar’ emission, shown in red (Pahre et al. 2004; Machacek et al. 2007a, in preparation). Figure 5 shows that the nonstellar emission in IC 4970 is concentrated in the inner ( kpc) of the galaxy, with the peak of the nonstellar emission at the nucleus of IC 4970, qualitatively consistent with a heavily obscured active nucleus (Pahre et al. 2004). To check whether the nonstellar emission is extended or consistent with an unresolved point source, we extracted wide vertical and horizontal cuts through the nonstellar surface brightness distribution at the nucleus. The full width at half-maximum of the resulting projected surface brightness distribution in each case was , a factor larger than that of the IRAC point spread function in this waveband, suggesting part of the emission arises from a roughly spherical distribution of warm dust in the central region of the galaxy outside the luminous accretion disk of the AGN. The bright patches of nonstellar emission from polycyclic aromatic hydrocarbons (warm dust) along NGC 6872’s northern arm and at the ‘knee’ and ‘bridge’, that trace the collision path of IC 4970 through NGC 6872, also show that IC 4970 has recently tidally interacted with a region in the spiral that is rich in cold gas and dust, such that the spiral galaxy NGC 6872 could be one source for the obscuring material now found in the less massive, tidal perturber IC 4970.
We perform fixed aperture photometry on the background-subtracted mosaiced-images in all four IRAC wavebands (, , , and ), using a circular aperture and background annulus with inner, outer radii of , , respectively, centered on the nucleus of IC 4970. The data were aperture corrected using point source aperture corrections for each IRAC waveband appropriate for the chosen aperture and background geometries, and the resulting flux densities converted to Vega relative magnitudes. For completeness, the aperture correction factors and Vega relative zeropoints used for each IRAC channel are listed in Table 3. Our results for the IRAC-band flux densities (magnitudes) of IC 4970’s nucleus are given in Table 4.
We find IRAC mid-infrared colors of and . These mid-infrared colors fall outside the mid-infrared color selection criteria used by Stern et al. (2005) to separate active galaxies from normal galaxies. The color of IC 4970’s nucleus is too blue, falling below the color-color selection ‘wedge’ shown in their Figure 1, but the color of IC 4970’s nucleus is far redder than the zero redshift endpoint of the evolutionary track for the normal S0/Sa galaxy NGC 4429, also shown in that figure. However, the Stern et al. selection ‘wedge’ was based on a photometrically identified sample of bright quasars and Seyfert galaxies, rather than highly obscured Seyfert s. Given that of the narrow line AGN identified in their sample also fall outside the color-color selection ’wedge’, these criteria likely do not apply to IC 4970. Lacy et al. (2004) used quasars from the Sloan Digital Sky Survey to empirically define a selection region in the mid-infrared color-color space defined by the and flux density ratios. Objects red in both colors are likely AGN. These mid-infrared colors for the nucleus of IC 4970 ( and ) are both red and are consistent with the colors of obscured AGN candidates in the Lacy et al. sample (See Fig. 1 in Lacy et al. 2004).
Thus both the X-ray properties (spectrum and variability) and mid-infrared colors suggest IC 4970 hosts a highly obscured Seyfert nucleus.
3.4. Near-Nuclear X-ray Source
We use a circular source region and the same annular background region that was used for the nucleus (‘north source’ and ‘nucleus bkg’, respectively, in Table 1) to measure the net X-ray source counts in the combined ks observation from the near-nuclear X-ray source, located kpc to the north of the AGN (see the right panel of Figure 2). Since the near-nuclear X-ray source is separated from the nucleus by only and the nucleus is located from the ACIS-I aim point for this observation, the AGN and near-nuclear point source are resolved in the keV energy band, but are not resolved in the keV energy band. We find a total of net source counts in the keV energy band for the northern, near-nuclear X-ray source and, to avoid contamination from the nucleus, use only the keV count rate to determine its luminosity. Assuming Galactic absorption of cm-2 , and absorbed power law spectral models with photon indices , typical for luminous X-ray point sources (see, e.g. Colbert et al. 2004; Swartz et al. 2004), we find a keV luminosity for the near-nuclear X-ray point source of erg s-1 , where the errors reflect both the range of photon indices considered in our spectral models and the statistical uncertainty in the keV count rate. Thus the near-nuclear X-ray point source is an ultra-luminous X-ray source. Our estimate for the luminosity of the near-nuclear X-ray source should be considered a lower bound on its intrinsic luminosity, since nonstellar emission in the center of IC 4970 suggests that obscuring material may extend outside the nucleus (see §3.3), and ultra-luminous X-ray sources, on average, tend to be moderately absorbed ( cm-2 ; Swartz et al. 2004).
3.5. Diffuse Emission Outside the Central Region
To estimate the amount of hot gas in IC 4970 outside the nucleus, we measure the X-ray emission from an elliptical region, based on the distribution of starlight in the image of IC 4970 shown in the right panel of Figure 1, excluding a central ellipse containing the two point sources near the nucleus (denoted ‘full extent’ and ‘central’ in Table 1). The local background is again the nearby circular region ‘IGM’ in Table 1. X-ray emission outside the central region is weak with only net source counts in the keV energy band, for the combined ks observation. We estimate the amount of this emission that is the result of low mass X-ray binaries in IC 4970 using the low mass X-ray binary cumulative luminosity function for early type galaxies from Gilfanov (2004), normalized by the stellar mass determined from K-band photometry of the Micron All Sky Survey image of the same region. We model the excess keV emission with a Raymond-Smith thermal plasma model, assuming a gas temperature of keV and metallicities of , typical for the interstellar medium of early type galaxies (see, e.g. Machacek et al. 2004, 2006), and Galactic absorption of cm-2 (Dickey & Lockman 1990). We find a total keV luminosity outside the central region of IC 4970 of erg s-1 , with erg s-1 () from the thermal component and erg s-1 () from low mass X-ray binaries. Using the Raymond-Smith spectral model normalization to estimate the mean electron density and gas mass outside IC 4970’s central region, we find (for uniform filling) mean electron densities of cm-3 and hot gas masses of , where the ranges reflect uncertainties in the assumed metal abundance and geometry. This is a factor less than the amount of cold HI gas that may be associated with the galaxy (Horellou & Koribalski 2007). Thus either the gravitational potential of IC 4970 is too shallow to hold a significant hot gas halo or, alternatively, the hot gas has been stripped during the collision of IC 4970 with the spiral galaxy NGC 6872 and/or by its interaction with the Pavo group intra-group medium during the supersonic passage of the NGC 6872/IC 4970 galaxy pair through the Pavo group core.
4. Fueling the Central Black Hole
4.1. Determining the Black Hole Mass
The mass of the central black hole in galaxies is tightly correlated with the absolute K-band luminosity of the galaxy bulge,
| (1) |
where is the mass of the black hole in solar masses and and is the absolute K-band luminosity of the galaxy’s bulge in solar luminosities (Marconi & Hunt 2003). For early type galaxies, like IC 4970, the bulge luminosity in eq. 1 is replaced by the total K-band luminosity of the galaxy as a whole. Thus we use photometry of the ‘full extent’ source region from Table 1, with the ‘IGM’ region as a local background, on images from the Micron All Sky Survey to measure the K-band luminosity of IC 4970. Since it is likely that IC 4970 and NGC 6872 lie near the core of the Pavo group (Machacek et al. 2005), such that the luminosity distance is Mpc, we find and the central black hole mass of . If instead we use the B-band mass-to-light ratio ( ) for IC 4970, that was needed in simulations to reproduce the tidal features observed in the spiral galaxy NGC 6872 (Mihos 1993; Horellou & Koribalski 2007), we find a dynamical mass of within a B-band effective radius of ( kpc), implying a line-of-sight velocity dispersion of km s-1 . Then from the relationship (Gebhardt et al. 2000; Ferrarese & Merritt 2000), we infer a central black hole mass for IC 4970 of , a factor smaller than that obtained from the relationship, but consistent within its dex scatter (Hardcastle et al. 2007).
4.2. Mass Accretion Rates and Modes
From the X-ray properties of the nuclear region of IC 4970, we can estimate the accretion power available from hot gas in the nuclear region, and compare the available accretion power from hot gas to the luminosity of the nucleus to constrain the accretion mode of the AGN. For a black hole the Eddington luminosity is erg s-1 , such that for the bright state, , consistent with observed for heavily absorbed, accretion powered radio galaxies (Evans et al. 2006). Thus, even in the bright state, the radiative power is sub-Eddington. The mass accretion rate needed to produce the observed X-ray luminosity is given by , where is the radiative efficiency and is the speed of light. Assuming a radiative efficiency, the mass accretion rate needed to power the AGN in IC 4970 is g s-1. This should be considered a lower limit on the required mass accretion rate, since for accretion powered AGN, the bolometric luminosity is likely a factor higher (Elvis et al. 1994) than , and radiative efficiencies may be more common (Evans et al. 2006).
The accretion rate available from the Bondi accretion of hot gas onto the central black hole is given by
| (2) |
where is the gravitational constant, is the black hole mass, is the sound speed and is the gas density at the Bondi radius (see, e.g., Allen et al. 2006). In our case the Bondi radius is small ( pc), so we use the limits on the hot gas near the nucleus derived from assuming all of the excess keV emission in the nuclear region was thermal (see §3.2). For hot gas with temperature keV and electron density cm-3 accreting onto a black hole, we find a Bondi accretion rate of g s-1. This is less than of the lower limit on the mass accretion rate needed to power the AGN.
The available Bondi accretion power is very sensitive to the temperature of the hot gas through the dependence of eq. 2 on the gas sound speed, with lower gas temperatures allowing higher accretion rates. However, even for the confidence lower limit on the gas temperature ( keV) for hot gas in the nuclear region, the available mass accretion rate ( g s-1) is still a factor of three too small to power the observed X-ray luminosity and likely an order of magnitude too small to provide the total bolometric power for the AGN. Furthermore, if we have overestimated the black hole mass by a factor two, as suggested by previous numerical simulations of the interaction of IC 4970 with the larger spiral galaxy NGC 6872 (Mihos et al. 1993, Horellou & Koribalski 2007), the Bondi accretion rates quoted above would be reduced by an additional factor of four.
Thus the most likely explanation for the nuclear activity in IC 4970 is that the active nucleus was triggered by the accretion of cold (HI) gas and dust driven into its center as a result of IC 4970’s ongoing interaction with the spiral galaxy NGC 6872. Since numerical simulations of the NGC 6872/IC 4970 system by Horellou & Koribalski (2007) suggest that IC 4970 will accrete significant amounts of matter during this interaction, some, if not all, of the dust and cold gas fueling IC 4970’s nucleus may have been acquired by IC 4970 during its passage through the northern spiral arm of its much larger, gas-rich spiral partner. Such interactions would have been frequent between galaxies in groups at high redshift, when the fraction of gas-rich spirals was high, thereby promoting AGN activity and black hole growth in lower mass galaxies, that are unable to retain significant hot gas halos because of their shallow gravitational potentials.
5. Conclusions
In this paper we use Chandra X-ray and Spitzer IRAC mid-infrared observations to probe nuclear activity in IC 4970, the interacting companion galaxy to the large spiral galaxy NGC 6872 in the Pavo galaxy group. We find the following:
-
•
X-ray emission from the nucleus of IC 4970 is time variable with the mean keV count rate increasing by a factor of three on ks time scales. This strongly suggests IC 4970’s nucleus hosts an AGN rather than a compact nuclear starburst.
-
•
The X-ray spectrum of IC 4970’s nucleus in the bright state shows a clear Fe K line and is well described by an absorbed power law plus narrow Gaussian line model with absorption column cm-2 , fixed photon indices , and an Fe K line equivalent width of eV. The keV X-ray luminosity of the nucleus in the bright state is erg s-1 and in the faint state is erg s-1 . With these data, we find no significant difference in the power law slope or intrinsic absorption between the bright and faint nuclear states.
-
•
Nonstellar emission is concentrated in the central kpc () of IC 4970, consistent with high obscuration in this region. The mid-infrared colors of the nucleus, , , are consistent with the mid-infrared colors expected for highly obscured AGN candidate sources. Thus the X-ray and mid-infrared properties of the nucleus of IC 4970 suggest that it is a highly obscured Seyfert .
-
•
Assuming that the keV X-ray emission observed in the nuclear region is all thermal, the spectrum is consistent with an absorbed keV APEC model with solar metallicity, a hydrogen absorbing column of cm-2 , and intrinsic luminosity of erg s-1 . For uniform filling, the inferred mean electron density and hot gas mass in the nuclear region are cm-3 and , respectively.
-
•
An ultra-luminous X-ray source with keV intrinsic luminosity of erg s-1 is found kpc from IC 4970’s nucleus.
-
•
Little diffuse X-ray emission is observed outside the nuclear region. Assuming keV interstellar galaxy gas, the X-ray luminosity of diffuse gas outside the central kpc of the galaxy is erg s-1 and gas mass is . Either the gravitational potential of IC 4970 is too shallow to retain a significant hot gas halo, or that halo has been stripped by the interaction of IC 4970 with NGC 6872 and the Pavo group intra-group medium.
-
•
From the correlation between black hole mass and K-band luminosity, we expect IC 4970 to host a black hole. Bondi accretion of hot gas in the nuclear region of IC 4970 onto the black hole can account for only of the observed X-ray luminosity of the AGN, such that the dominant power source for the active nucleus is likely the accretion of dust and cold gas driven into IC 4970’s nuclear region by the galaxy’s ongoing interaction with the gas-rich spiral galaxy NGC 6872.
References
- Allen et al. (2006) Allen, S.W., Dunn, R.J.H., Fabian, A.C., Taylor, G.B., Reynolds, C.S. 2006, MNRAS, 372, 21
- Anders & Grevasse (1989) Anders, E. & Grevesse, N. 1989, Geochimica et Cosmochimica Acta, 53, 197
- Bastian et al. (2005) Bastian, N., Hempel, M., Kissler-Patig, M., Homeier, N. & Trancho, G. (2005), A&A, 435, 65
- Bautz et al. (1998) Bautz, M.W., et al. 1998, in Proceedings of the SPIE, 3444, X-ray Optics, Instruments and Missions, ed. R.B. Hoover & A.B. Walker, 210
- Bertin & Arnouts (1996) Bertin, E. & Arnouts, S. 1996, A&AS, 117, 393
- Best et al. (2006) Best, P.N., Kaiser, C.R., Heckman, T.M., & Kauffmann, G. 2006, MNRAS, 368, L67
- Capetti & Balmaverde (2006) Capetti, A. & Balmaverde, B. 2006, A&A, 453, 27
- Cappi et al. (2006) Cappi, M. et al. 2006, A & A, 446, 459
- Churasov et al. (2005) Churasov, E., Sazonov,S, Sunyaev, R., Forman, W.R., Jones, C. & Böhringer, H. 2005, MNRAS, 363, L91
- Colbert et al. (2004) Colbert, E., Heckman, T.M., Ptak, A. & Strickland, D.K. 2004, ApJ, 602, 231
- Croton et al. (2006) Croton, D., Springel, V., White, S.D.M., De Lucia, G., Frenk, C.S., Gao, L., Jenkins, A, Kauffmann, G., Navarro, J.F., Yoshida, Y., 2006, MNRAS, 365, 11
- Cooper et al. (2006) Cooper, M.C. et al. 2006, MNRAS, 370, 198
- Davis (2001) Davis, J.E. 2001, ApJ, 562, 575
- Dickey & Lockman (1990) Dickey, J.M. & Lockman, F.J., 1990, ARAA, 28, 215
- (15) Dunn, R.J.H. & Fabian, A.C. 2006, MNRAS, 373, 959
- Elvis et al. (1994) Elvis, M. et al. 1994, ApJS, 95, 1
- Evans et al. (2006) Evans, D.A., Worall, D.M., Hardcastle, M.J., Kraft, R.P., & Birkinshaw, M. 2006, ApJ, 642, 96
- Fazio et al. (2004) Fazio, G. et al. 2004, ApJS, 154, 10
- Ferrarese & Merritt (2000) Ferrarese, L. & Merritt, D. 2000, ApJ, 539, L9
- Garmire et al. (1992) Garmire, G.P. et al. 1992, AIAA, Space Programs and Technologies Conference, March 24-27, 1992 (Paper 92-1473; New York: AIAA)
- Gebhardt (2000) Gebhardt, K., Bender, R., Bower, G., et al. 2000, ApJ, 539, L13
- Gehrels (1986) Gehrels, N. 1986, ApJ, 303, 336
- Gerke, B.F. et al. (2005) Gerke, B.F. et al. 2005, ApJ, 625, 6
- Gerke et al. (2007) Gerke, B.F. et al. 2007, MNRAS, 376, 1425
- Gilfanov (2004) Gilfanov, M. 2004, MNRAS, 349, 146
- Hardcastle, Evans & Croston (2007) Hardcastle, M.J., Evans, D. & Croston, J.H. 2007, MNRAS, 376, 1849
- Hora et al. (2004) Hora, J., et al. 2004 in Proceedings of the SPIE, Volume 5487, Optical, Infrared, and Millimeter Space Telescopes, ed. J.C. Mather, 77
- Horellou & Booth (1997) Horellou, C. & Booth, R. 1997, A&AS, 126, 3
- Horellou & Koribalski (2006) Horellou, C. & Koribalski, B. 2007, A&A, 464, 155
- Lacy et al. (2004) Lacy, M. et al. 2004, ApJS, 154, 166
- [Machacek et al. (2004) Machacek, M.E., Dosaj, A., Forman, W., Jones, C., Markevitch, M., Vikhlinin, A., Warmflash, A. & Kraft, R. 2004, ApJ, 621, 663
- Machacek et al. (2005) Machacek, M.E., Nulsen, P.E.J., Stirbat, L., Jones, C. & Forman, W.R. 2005, ApJ, 630, 280
- Machacek et al. (2006) Machacek, M.E., Jones, C., Forman, W.R. & Nulsen, P.E.J. 2006, ApJ, 644, 155
- Marconi & Hunt (2003) Marconi, A. & Hunt, L.K. 2003, ApJ, 589, L21
- Mihos et al. (1993) Mihos, C., Bothun, G. & Richstone, D. 1993, ApJ, 418, 82
- Morrison & McCammon (1983) Morrison, R. & McCammon, D. 1983, ApJ, 270, 119
- Pahre et al. (2004) Pahre, M., Ashby, M.L.N, Fazio, G.G., & Willner, S.P. 2004, ApJS, 154, 229
- Plucinsky et al. (2003) Plucinsky, P.P. et al. 2003 in Proceedings of The SPIE, 4851, X-ray and Gamma-Ray Telescopes and Instruments for Astronomy, ed. J.E. Trluemper & H. Tannenbaum, 89
- Reach et al. (2005) Reach, W.T. et al. 2005, PASP, 117, 978
- Schuster et al. (2006) Schuster, M.T., Marengo, M., & Patten, B.M. 2006, in Proceedings of the SPIE, 6270, Observatory Operations: Strategies, Processes, and Systems, ed. D.R. Silva & R.E. Doxsey, 65
- Smith et al. (2001) Smith, R.K., Brickhouse, N.S., Liedahl, D. A. & Raymond, J.D. 2001, ApJ, 556, L91
- Spergel et al. (2007) Spergel, D.N. et al. 2007, ApJS, 170, 377
- Stern et al. (2005) Stern, D. et al. 2005, ApJ, 631, L163
- Swartz et al. (2006) Swartz, D., Ghosh, K.K., Tennant, A.F. & Wu, K. 2004, ApJS, 154, 519
- Vorontsov-Velyaminov (1959) Vorontsov-Velyaminov, B. 1959, Atlas and Catalog of Interacting Galaxies, Sternberg Institute, Moscow: Moscow University
- Werner, M. et al. (2004) Werner, M.W. et al. 2004, ApJS, 154, 1
- Wilson & Colbert (1995) Wilson, A.S. & Colbert, E. 1995, ApJ, 438, 62
| Source | Geometry | Center | Radii | PA |
|---|---|---|---|---|
| RA, DEC | arcsec,arcsec | deg | ||
| Nucleus | ellipse | , | , | |
| Nucleus Bkg | annulus | , | , | … |
| North Source | circle | , | … | |
| Central | ellipse | , | , | |
| Full Extent | ellipse | , | , | |
| IGM | circle | , | … |
Note. — Columns are (1) region label, (2) region geometry, (3) region center in J2000.0 coordinates, (4) radius (circle), outer, inner radii (annulus), and major, minor semiaxes (ellipse), and (5) position angle measured counterclockwise from west for elliptical regions.
| State | Fe EqWidth | |||
|---|---|---|---|---|
| cm-2 | eV | |||
| Bright | ||||
| Faint | ||||
| … | ||||
| … | ||||
| … | ||||
| … |
Note. — Spectral models are an absorbed power law for the faint state (Obsid 7248) and an absorbed power law plus narrow Gaussian, with line energy ( keV) and redshift () fixed, for the bright state. The photon index was also not allowed to vary in the fits. Spectral models were fit over the keV ( keV) for the bright (faint) state, respectively. Errors are confidence levels.
| waveband | aperturea | zeropointb |
|---|---|---|
| correction | Jy | |
Note. — a Infrared Array Camera Data Handbook 3.0 (2006), http://ssc.spitzer.caltech.edu/irac/dh/iracdatahandbook3.0.pdf, p. 53. b Vega relative zeropoints from Reach et al. (2005).
| waveband | flux density | magnitude |
|---|---|---|
| mJy | ||
Note. — Results are for a fixed radius circular aperture centered on the nucleus of IC 4970 (, ) with a concentric background annulus whose (inner, outer) radii are (, ). Photometric corrections and zeropoints are listed in Table 3. IRAC photometric uncertainties are .