K. Sugiyama et al.6.7 GHz Methanol Masers with JVN \Received2007/05/16\Accepted2007/09/10
masers: methanol — techniques: interferometric — very-long-baseline interferometry
Mapping Observations of 6.7 GHz Methanol Masers
with Japanese VLBI Network
Abstract
We have observed 13 methanol maser sources associated with massive star-forming regions; W3(OH), Mon R2, S 255, W 33A, IRAS 181511208, G 24.780.08, G 29.950.02, IRAS 185560136, W 48, OH 43.80.1, ON 1, Cep A and NGC 7538 at 6.7 GHz using the Japanese VLBI Network (JVN). Twelve of the thirteen sources were detected at our longest baseline of 50 M, and their images are presented. Seven of them are the first VLBI images at 6.7 GHz. This high detection rate and the small fringe spacing of 4 milli-arcsecond suggest that most of the methanol maser sources have compact structure. Given this compactness as well as the known properties of long-life and small internal-motion, this methanol maser line is suitable for astrometry with VLBI.
1 Introduction
The class II methanol masers are well-known as tracers of early stages of high-mass star formation ([Walsh et al. (1998)]; [Minier et al. (2001)]; [Ellingsen (2006)]). Classes I and II are defined on the basis of associated sources ([Batrla et al. (1987)]; [Menten (1991a)]); different pumping mechanisms are proposed for them ([Cragg et al. (1992)], [Sobolev et al. (1997)]). The class II masers are represented by 6.7 and 12.2 GHz lines ([Menten (1991b)]; [Batrla et al. (1987)]). The spot size of class II masers is several AU ([Menten et al. (1992)]; [Moscadelli et al. (1999)]), while the class I masers are resolved out with Very Long Baseline Interferometric (VLBI) technique (Lonsdale et al., 1998).
VLBI observations for astrometry with hydroxyl, water and methanol masers have been made using the phase referencing technique. The accuracy of measuring with hydroxyl masers is 1 milli-arcsecond (mas) (Vlemmings et al., 2003), while that achieved with water masers is up to a few tens of micro-arcsecond (as) (Hachisuka et al., 2006). Xu et al. (2006) also have achieved the positional accuracy of 10 as with methanol maser at 12.2 GHz. This observation has been the only one astrometric observation with methanol masers. Internal proper motions are often measured typically at a few mas per year for water masers at 22 GHz (e.g., Genzel et al. (1981a), \yearcite1981ApJ…244..884G) and this motion sometimes prevents the separation of the annual parallax from the internal proper motion. The internal proper motion for class II methanol masers are small and have been measured only for W3(OH) at 12.2 GHz (Moscadelli et al., 2002). The lifetime of 22 GHz water masers is sometimes too short for measuring annual parallax. For example, several spots disappear over timescales of 1 month for Cepheus A and IRAS 213915802 (Torrelles et al. (2001a), \yearcite2001Natur.411..277T; Patel et al. (2000)). A monitoring of variability of 6.7 GHz methanol line for four years showed that each spectral feature survives regardless of some variability (Goedhart et al., 2004), namely the lifetime of this maser is usually long enough for measuring annual parallax. There are 519 sites of 6.7 GHz methanol maser in a list compiled by Pestalozzi et al. (2005). Recently, new 48 sources have been detected using the 305 m Arecibo radio telescope (Pandian et al., 2007). For the above reasons, i.e., compactness, small internal proper motion, long-life and large number of known sources, class II methanol masers may also be a useful probe for astrometry.
The VLBI Exploration of Radio Astrometry (VERA; Kobayashi et al. (2003)) is a dedicated VLBI network for astrometry, which mainly observes galactic water masers for measuring their distance and motion. Methanol masers at 6.7 GHz would also contribute to revealing the Galactic structure as well as water masers. The spot size of methanol maser should be small enough for high precision astrometry. The study of spot size, however, have been made only a few cases so far. The number of sources imaged with baseline of 50 M at 6.7 GHz were only four (Menten et al. (1992); Bartkiewicz et al. (2005); Pestalozzi et al. (2006); Goddi et al. (2007)). Minier et al. (2002) discussed the size and structure of individual masing regions in detail based on their 12.2 and 6.7 GHz observations. They showed that the majority of the masing regions consist of a compact maser core surrounded by extended emission (halo), and derived the core size of 2 to 20 AU.
We have started investigations of methanol masers using the Japanese VLBI Network (JVN) for astrometry. The network is a newly-established one with 50–2560 km baselines across the Japanese islands (Doi et al., 2006a) and consists of ten antennas, including four radio telescopes of the VERA. We have installed 6.7 GHz receivers on three telescopes of the JVN and have made a snap-shot imaging survey toward thirteen sources associated with massive star-forming regions. The aims of this observation are to investigate the detectability of 6.7 GHz masers with our longest baseline of 50 M corresponding fringe spacing of 4 mas, and to verify the imaging capability of this network.
In this paper, we describe the detail of this observation and data reduction in section 2. In section 3 we present the images of the detected sources and report the results on each individual source. Finally, we discuss the properties of this maser for astrometry in section 4, based on the results of this observation.
| Source | Coordinates(J2000) | Ref. | VLBI obs. | |||
| RA | Dec | |||||
| (h m s) | (∘ ′ ′′) | (Jy) | (kpc) | |||
| W3(OH) | 02 27 03.820 | 61 52 25.40 | 10 | 3294 | 1.95 | 1 |
| Mon R2 | 06 07 47.867 | 06 22 56.89 | 4 | 104 | 0.83 | 6, 7 |
| S 255 | 06 12 54.024 | 17 59 23.01 | 6 | 79 | 2.5 | 6, 7 |
| W 33A | 18 14 39.52 | 17 51 59.7 | 13 | 297 | 4.0 | … |
| IRAS 181511208 | 18 17 58.07 | 12 07 27.2 | 13 | 119 | 3.0 | 8 |
| G 24.780.08 | 18 36 12.57 | 07 12 11.4 | ∗*∗*footnotemark: | 84 | 7.7 | … |
| G 29.950.02 | 18 46 03.741 | 02 39 21.43 | 6 | 182 | 9.0 | … |
| IRAS 185560136 | 18 58 13.1 | 01 40 35 | 12 | 191 | 2.0 | … |
| W 48 | 19 01 45.5 | 01 13 28 | 3 | 733 | 3.4 | 6 |
| OH 43.80.1 | 19 11 53.987 | 09 35 50.308 | 2 | 51 | 2.8 | … |
| ON 1 | 20 10 09.1 | 31 31 34 | 12 | 107 | 1.8 | … |
| Cep A | 22 56 17.903 | 62 01 49.65 | 13 | 371 | 0.73 | … |
| NGC 7538 | 23 13 45.364 | 61 28 10.55 | 6 | 256 | 2.8 | 5, 6, 7, 9, 11 |
| Col (1) source name; Col (2)–(3) coordinates in J2000; Col (4) reference of coordinates; Col (5) peak flux densities from the single-dish observations by Yamaguchi 32 m; Col (6) source distance; Col (7) Published VLBI observations at 6.7 GHz. References — (1) Menten et al. (1992); (2) Kurtz et al. (1994); (3) Caswell et al. (1995a); (4) Walsh et al. (1998); (5) Minier et al. (1998); (6) Minier et al. (2000); (7) Minier et al. (2001); (8) Voronkov et al. (2002); (9) Pestalozzi et al. (2004); (10) Etoka et al. (2005); (11) Pestalozzi et al. (2006); (12) Joint Iras Science (1994); (13) Fringe rate mapping in our observations (accuracy of position is from 100 to 300 mas).∗*∗*footnotemark: The coordinate of this source is not used for this data reduction. This coordinate is obtained from the observations made in the following year. It is coincident with the coordinate in the catalog listed by Pestalozzi et al. (2005). | ||||||
2 Observations and Data Reduction
2.1 VLBI Observation
The methanol transition at 6668.518 MHz was observed on 2005 September 26 from 5:00 to 21:00 UT using three telescopes (Yamaguchi 32 m, VERA-Mizusawa 20 m, VERA-Ishigaki 20 m) of the JVN. The maximum fringe spacing was 9.1 mas (Yamaguchi–Mizusawa, 22 M) and the minimum was 4.1 mas (Mizusawa–Ishigaki, 50 M). Right-circular polarization was received at Yamaguchi with system noise temperature of 220 K, while linear polarization was received at Mizusawa and Ishigaki stations with system noise temperatures of 120 K. The data were recorded on magnetic tapes using the VSOP-terminal system at a data rate of 128 Mbps with 2-bit quantization and 2 channels, and correlated at the Mitaka FX correlator (Shibata et al., 1998). From the recorded 32 MHz bandwidth, 8 MHz (6664 MHz to 6672 MHz) was divided into 1024 channels and used for data analysis, yielding a velocity resolution of 0.35 km s-1.
Sources that are bright and have widespread velocity range were selected as targets of this observation. The following thirteen sources were observed; W3(OH), Mon R2, S 255, W 33A, IRAS 181511208, G 24.780.08, G 29.950.02, IRAS 185560136, W 48, OH 43.80.1, ON 1, Cep A and NGC 7538. The details of each source are shown in table 1. Scans of 15 minutes duration were made for 2-4 times on each source at different hour angles in order to improve uv-coverages. The number of scans for each source is shown in table 2. Strong continuum sources, NRAO 530, 3C 454.3, and 3C 84, were observed every two hours for bandpass and delay calibration.
The data were reduced using the Astronomical Image Processing System (AIPS; Greisen (2003)). Correlator digitization errors were corrected using the task ACCOR. Clock offsets and clock rate offsets were corrected using strong continuum calibrators in the task FRING. Bandpass calibration was performed using strong continuum calibrators in the task BPASS. Doppler corrections were made by running the tasks SETJY and CVEL. Amplitude calibration parameters were derived from the total-power spectra of maser lines using template-method in the task ACFIT. Fringe-fitting was conducted using one spectral channel including a strong maser feature in the task FRING. The solutions were applied to all the other channels.
We have searched maser spots over an area of \timeform4”.0 \timeform4”.0 with the Difmap software (Shepherd, 1997). Structure models were made by model-fitting with point sources and self-calibration algorithms iteratively. The phase solutions of self-calibration were applied to all the other channels.
In addition to the analyses described above, special amplitude calibrations were necessary because different polarizations (circular/linear) were correlated. Since a visibility amplitude reduces by in correlation between linear and single circular polarization, the factor was corrected. For the case of linear and linear polarization, the amplitude varies with time depending on position angle between antennas. Amplitude correction factors were calculated for each observational scan and applied to the visibilities. We made a baseline-based correction to each observational scan. The correction procedure was confirmed in some observations at different date by applying the task BLCAL for bright continuum sources. This process indicated that an accuracy of this calibration was 10 %.
2.2 Spectroscopic Single-Dish Observation
We also have made a series of single-dish observation of 6.7 GHz methanol maser with the Yamaguchi 32 m telescope. The single-dish observations were made about one month before the VLBI observation (August 2005). In this paper, we use the spectra as the total-power (not cross-correlated) spectra in comparison with cross-correlated spectra. The accuracy of correlated flux density depends on the accuracy of the single-dish observation.
The received signal at dual circular polarizations with a bandwidth of 4 MHz each was divided into 4096 channels, yielding a velocity resolution of 0.044 km s-1. The flux density calibration was made using an aparture efficiency of 70 % and a system noise temperature (220 K) measured on the first day of the single-dish observation. The accuracy of the calibration was 10 %. The rms of noise was typically 1.0 Jy, for data combined from dual polarizations with a 14 minutes integration. We used source positions listed in the IRAS Point Source Catalog (PSC; Joint Iras Science (1994)). Error in the LSR velocity was potentially to be km s-1.
3 Results
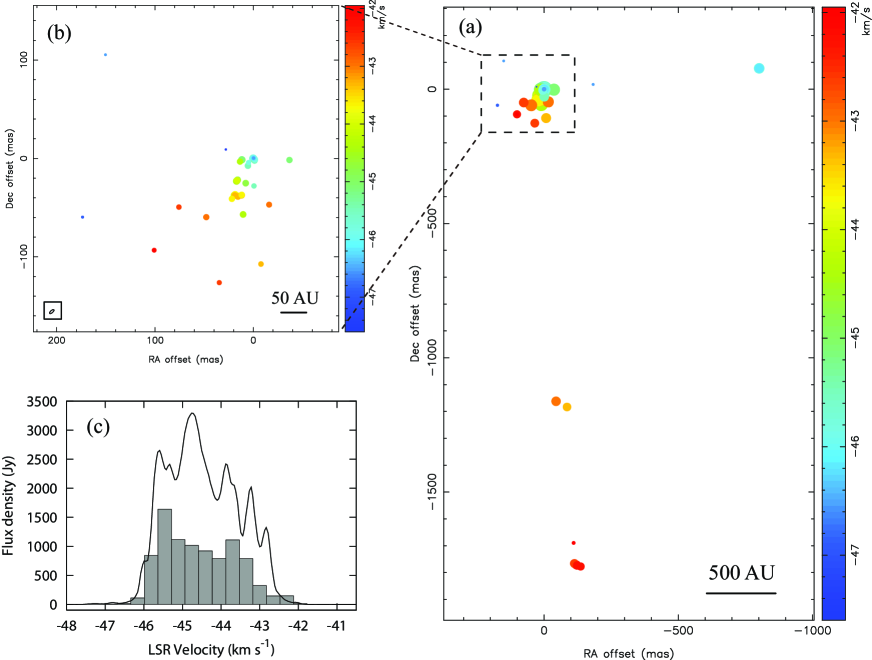
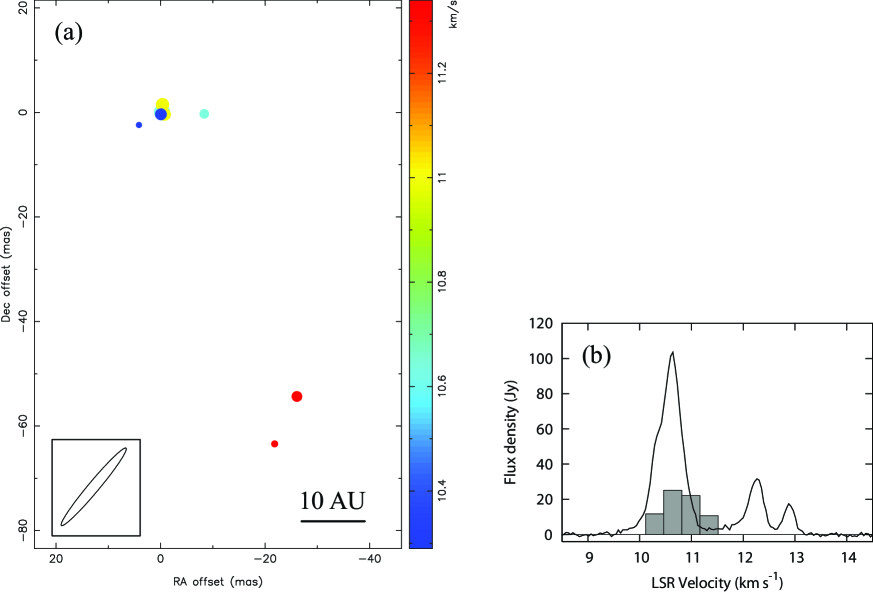
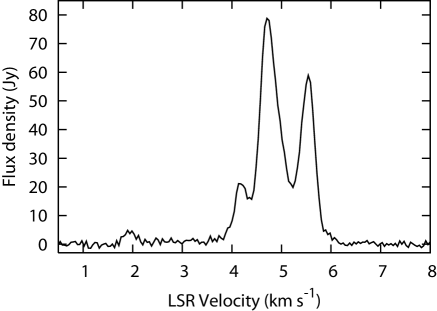
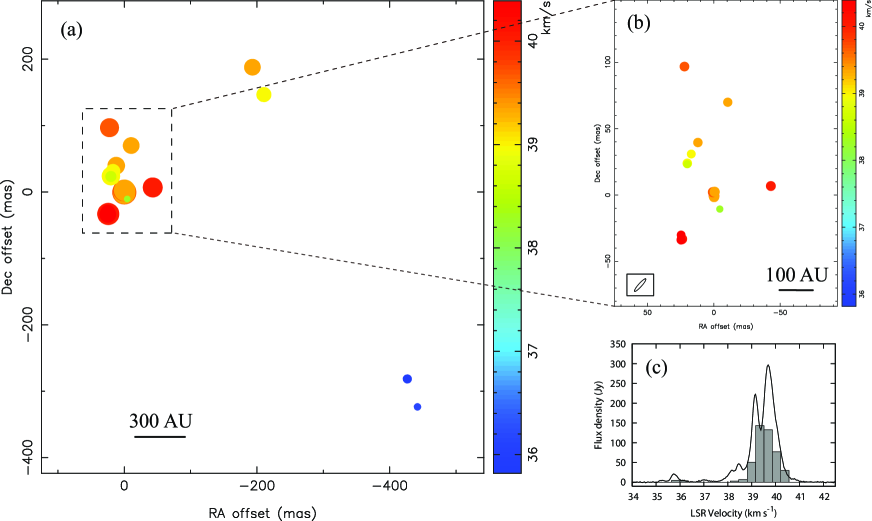
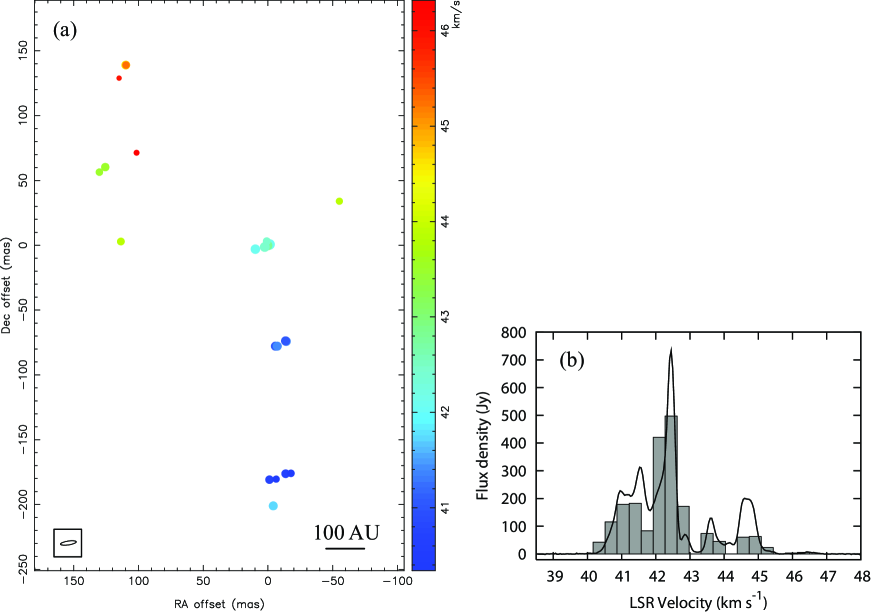
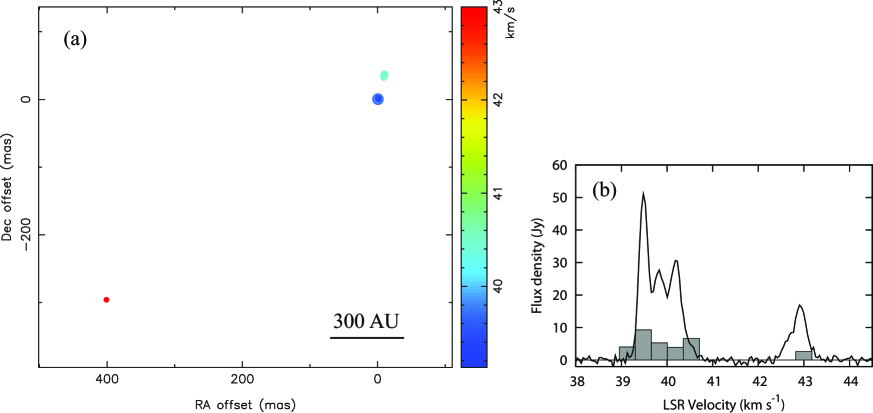
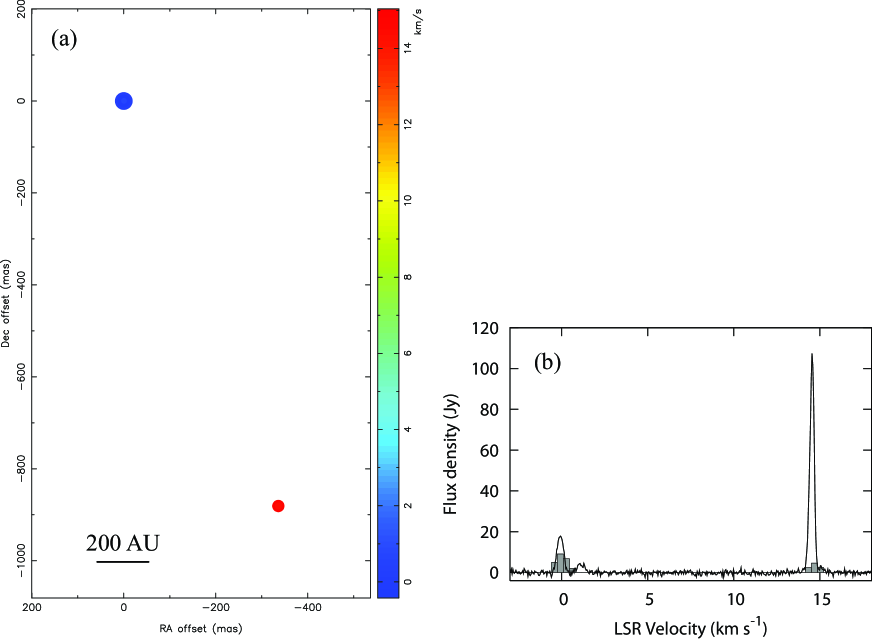
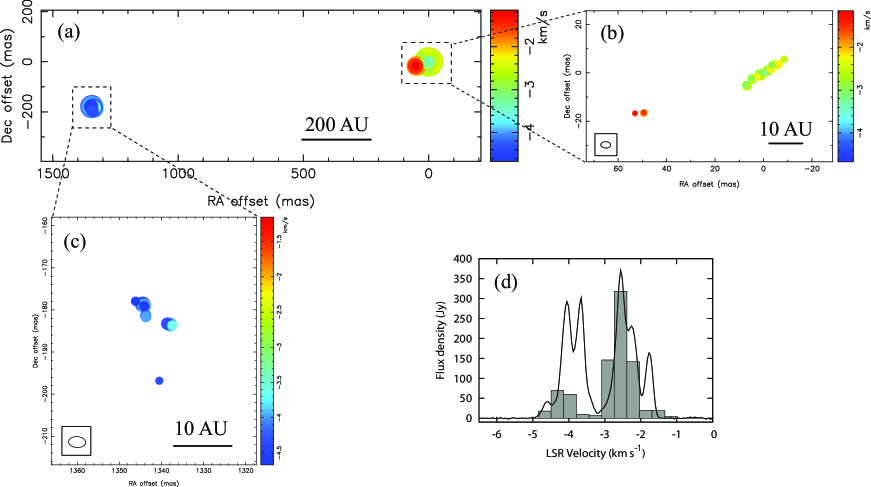
All the targets except for S 255 were detected. The channel-velocity maps of the detected sources are presented in figures 1–13. Only total-power spectrum is shown in figure 3 for S 255. The maps indicates positions of maser spots relative to that of the reference spot; the size and color of a spot represent its flux density in logarithmic scale and radial velocity, respectively. Correlated spectra (total CLEANed components) are shown in addition to total-power spectra for each source. The rms of image noise in a line-free channel ranges from 200 to 670 mJy beam-1. The minimum detectable sensitivities of 7 were in the range from 1.4 to 4.7 Jy beam-1. The maximum dynamic range was 196 for W3(OH). The projected baseline ranged from 11 to 50 M for all sources except for W 33A, IRAS 181511208 and G 24.780.08 (7 to 50 M). Flux ratios of correlated to total spectra at the peak channel of total spectra, and that of the integrated spectra are shown on column 7, 8 in table 2, respectively. Ratio of correlated flux densities at the longest baseline of 50 M to that at zero-baseline (total-power) was 20 % on average. We describe the results on each individual source below in Right Ascension order.
| Source | |||||||
| (mas mas) | (deg) | (%) | (%) | ||||
| W3(OH) | 3 | 131 | 0.24 | 45.46 | 31 | 45 | |
| Mon R2 | 2 | 140 | 0.30 | 10.64 | 24 | 33 | |
| S 255 | 2 | 144 | … | … | … | … | |
| W 33A | 3 | 138 | 0.37 | 39.69 | 45 | 51 | |
| IRAS 181511208 | 3 | 138 | 0.63 | 27.83 | 84 | 208 | |
| G 24.780.08 | 3 | 135 | 0.28 | 113.43 | 33 | 27 | |
| G 29.950.02 | 2 | 139 | 0.46 | 96.10 | 86 | 78 | |
| IRAS 185560136 | 3 | 135 | 0.32 | 28.57 | 37 | 36 | |
| W 48 | 3 | 99 | 0.67 | 42.45 | 68 | 91 | |
| OH 43.80.1 | 2 | 139 | 0.36 | 39.48 | 18 | 30 | |
| ON 1 | 4 | 112 | 0.23 | 0.07 | 4 | 27 | |
| Cep A | 4 | 87 | 0.62 | 2.56 | 86 | 65 | |
| NGC 7538 | 4 | 95 | 0.20 | 56.10 | 69 | 30 | |
| Col (1) source name; Col (2) number of scans; Col (3) FWMHs of major and minor axes of synthesized beam; Col (4) position angle of major axis of beam; Col (5) rms of image noise in line-free channels; Col (6) reference velocity channel; Col (7) flux ratio of correlated to total spectra at the peak channel of total spectra; Col (8) flux ratio of correlated to total spectra of the integrated spectra. | |||||||
3.1 W3(OH)
W3(OH) (figure 1) is a well-studied star-forming region at a distance of 1.95 0.04 kpc (Xu et al., 2006) containing a hot molecular core (HMC) and an UC H\emissiontypeII region (Turner & Welch, 1984). The central object is thought to be an O9O7 young star with an estimated mass of (Dreher & Welch, 1981). W3(OH) has been imaged with the Multi-Element Radio-Linked Interferometer Network (MERLIN, Etoka et al. (2005); Vlemmings et al. (2006); Harvey-Smith & Cohen (2006)) and VLBI array at 6.7 GHz (Menten et al., 1992), and with the VLBA at 12.2 GHz (Menten et al. (1988); Moscadelli et al. (1999), \yearcite2002ApJ…564..813M, \yearcite2003ApJ…583..776M; Xu et al. (2006)).
In our observation, 48 maser spots were detected. The velocity of reference feature is 45.46 km s-1 (45.37 km s-1 appeared in Etoka et al. (2005)). We detected the maser clusters 1, 5, 6 and 7 defined by Menten et al. (1992), and found a new spot of 46.51 km s-1 at 180 mas west from the reference feature. There are 38 spots within a 200 mas area of the cluster 6. The other three clusters locate \timeform0”.8 west, \timeform1”.2 south, and \timeform1”.7 south form the main cluster, respectively.
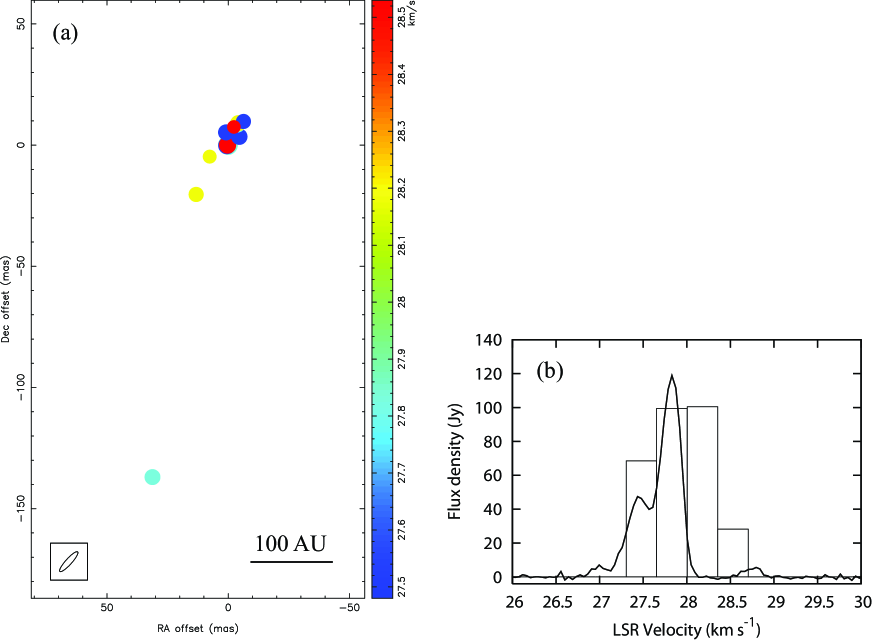
3.2 Mon R2
The Monoceros R2 (Mon R2, figure 2) molecular cloud has a cluster of seven bright infrared sources (Beckwith et al., 1976). The cluster is one of the closest massive star forming regions to the solar system at a distance of 830 pc (Racine (1968); Herbst & Racine (1976)). The 6.7 GHz methanol maser of Mon R2 has been observed with the Australia Telescope Compact Array (ATCA, Walsh et al. (1998)) and with European VLBI Network (EVN, Minier et al. (2000), \yearcite2001A&A…369..278M). Although there are several peaks in the total-power spectrum, our VLBI observation detected only one spectral feature around 10.64 km s-1 as eight maser spots. This eight spots ( 10.29 to 11.34) correspond to ’C’ defined by Walsh et al. (1998), and also are identified with that five of fourteen spots detected by Minier et al. (2000).
3.3 S 255
S 255 locating at a distance of 2.5 kpc (Mezger et al., 1988) includes one UC H\emissiontypeII region G 192.58-0.04 (Kurtz et al., 1994). S 255 has been observed with EVN at 6.7 GHz (Minier et al. (2000), \yearcite2001A&A…369..278M), and seven spots were detected with the longest projected baselines of 30 M. We observed this source and correlated with the coordinates that are used by Minier et al. (2000), (\yearcite2001A&A…369..278M), but no spot was detected. This source might be resolved out with our baselines. The single-dish spectrum observed by Yamaguchi 32 m is shown in figure 3.
3.4 W 33A
W 33A (figure 4) is a highly luminous object (, Stier et al. (1984)) and coincide a deeply embedded massive young stars (van der Tak et al., 2000). The kinematic distance based on CS and observations is 4 kpc (van der Tak et al., 2000). A map consisting eleven maser spots has been obtained with the ATCA (Walsh et al., 1998).
Our observation, the first VLBI for this source, detected 19 maser spots which correspond to ’F’, ’G’, and ’K’ defined by the ATCA observation. The total-power spectrum having several peaks, but weak spectral peaks were not detected in the VLBI map. This source consists of two clusters, and each clusters are separated larger than 1000 AU.
3.5 IRAS 181511208
IRAS 181511208 (figure 5) is embedded in a high-density cloud (Bronfman et al., 1996) and thought to be in pre-UC H\emissiontypeII phase (Davis et al., 2004). The kinematic distance based on CS line observation is 3.0 kpc (Brand & Blitz, 1993). Thirteen maser spots were detected by our observation. This source has been observed with the ATCA (Beuther et al., 2002) and with EVN (Voronkov et al., 2002). A spot of 27.83 km s-1 at 137 mas south from the main cluster was newly detected one.
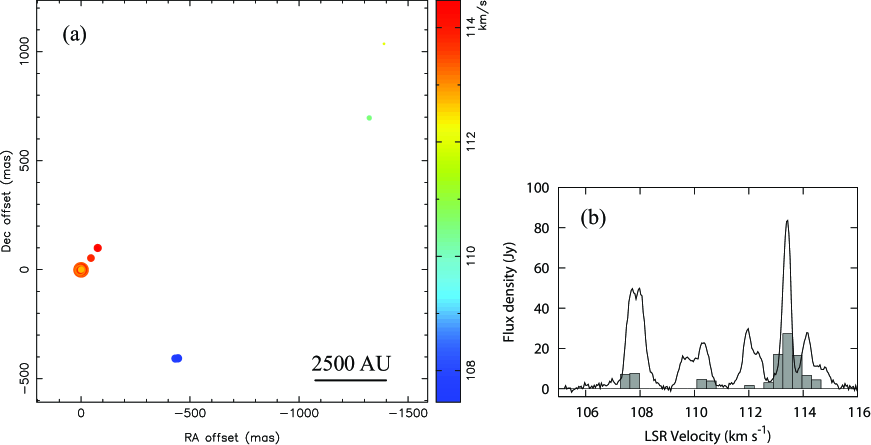
3.6 G 24.780.08
G 24.780.08 (figure 6) is a cluster of massive protostars at a distance of 7.7 kpc (Forster & Caswell, 1989). A pair of cores associated with a compact bipolar outflow have been detected (Furuya et al., 2002). Beltrán et al. (2004) have detected rotating disks associated with high-mass YSOs by observing 1.4 mm continuum and CH3CN ( 12–11) line emission. Our observation provides the first VLBI image of methanol masers at 6.7 GHz for this source. This source consists of three clusters separated larger than 3000 AU.
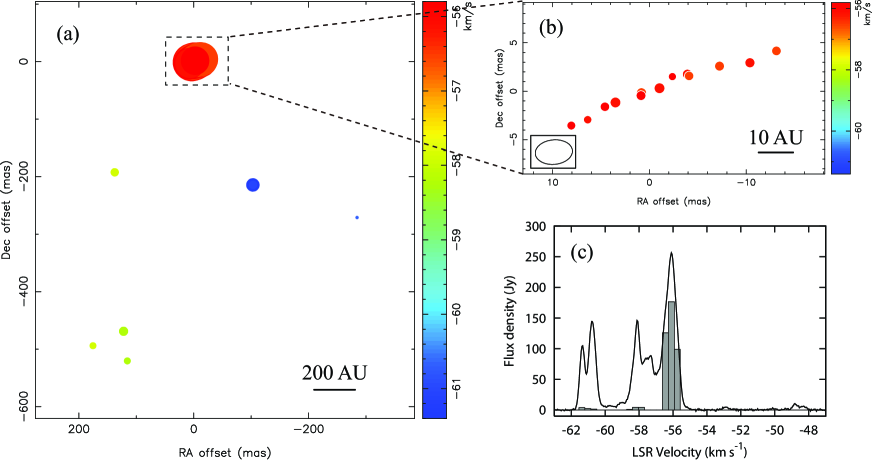
3.7 G 29.950.02
G 29.950.02 (figure 7) is at a distance of 9 kpc (Wood & Churchwell, 1989) and coincides an NH3 hot core, but is offset by a few arcsec from the continuum peak of a UC H\emissiontypeII region (Cesaroni et al., 1998). The methanol masers of G 29.950.02 has been observed with the ATCA at 6.7 GHz (Walsh et al., 1998) and with the VLBA at 12.2 GHz (Minier et al. (2000), \yearcite2001A&A…369..278M). Our observation at 6.7 GHz provides the first VLBI image for this source, in which fourteen spots were detected. Twelve of which were clustered within 10 mas, the other two spots were isolated \timeform0”.76 east from the main cluster. These two clusters detected in our map correspond to ’M’ and ’G’ defined by Walsh et al. (1998), respectively. There are several spectral features between 95 and 105 km s-1 in contrast to 12.2 GHz spectrum, most of weak features could not be detected by our VLBI observation.
3.8 IRAS 185560136
IRAS 185560136 (figure 8) is at a distance of 2 kpc (Brown et al., 1982) and associated with a CO outflows (Dent et al., 1985). Our VLBI observation is the first one for this source, and six maser spots were detected. This source consists of two clusters which are separated larger than 5000 AU. Although there are several spectral peaks, most of weak features could not be detected.
3.9 W 48
W 48 (figure 9) is a well-known H\emissiontypeII region at a distance of 3.4 kpc (Vallee & Avery, 1990). This source has a bright UC H\emissiontypeII region that could be an on-going massive star formation (Wood & Churchwell, 1989). W 48 has been observed with EVN at 6.7 GHz (Minier et al., 2000) and with the VLBA at 12.2 GHz (Minier et al., 2000). The maser of this source is strong and the spectrum is widespread, 24 spots forming a ring like structure were detected as observed by Minier et al. (2000). A spot of 43.86 km s-1 at 34 mas north and 55 mas west from the reference spot was newly detected one by this observation.
3.10 OH 43.80.1
OH 43.80.1 (figure 10) is a star-forming region at a distance of 2.8 0.5 kpc (Honma et al., 2005). This star-forming region coincides with IRAS 190950930 which is an UC H\emissiontypeII region (Kurtz et al., 1994). This is the first VLBI observation at 6.7 GHz for this source and we detected nine maser spots. A spot of 43.00 km s-1 was located at \timeform0”.4 east and \timeform0”.3 south from the reference spot.
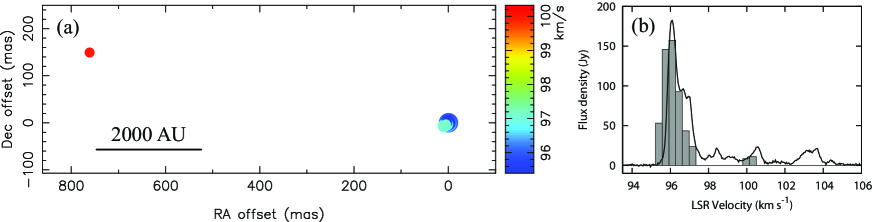
3.11 ON 1
Onsala 1 (ON 1, figure 11) is an UC H\emissiontypeII region located in the densest part of the Onsala molecular cloud (Israel & Wootten, 1983). This source is known to be associated with a massive star-forming region and IRAS 200813122. A kinematic distance of 1.8 kpc is used by MacLeod et al. (1998) and Kumar et al. (2004). Our observation is the first VLBI at 6.7 GHz and seven maser spots were detected. The redshifted cluster and blueshifted cluster are separated about 1700 AU from each other. It is surprising that the redshifted cluster corresponds to the narrow (0.5 km s-1) spectral maximum with a flux density of 107 Jy, the correlated flux density is only 4.6 Jy. The flux ratio of correlated to total spectrum is 4.3 %. On the other hand, the blueshifted cluster correspond to relatively weak (20 Jy) and wide spectral peak, while the flux ratio is about 50 %.
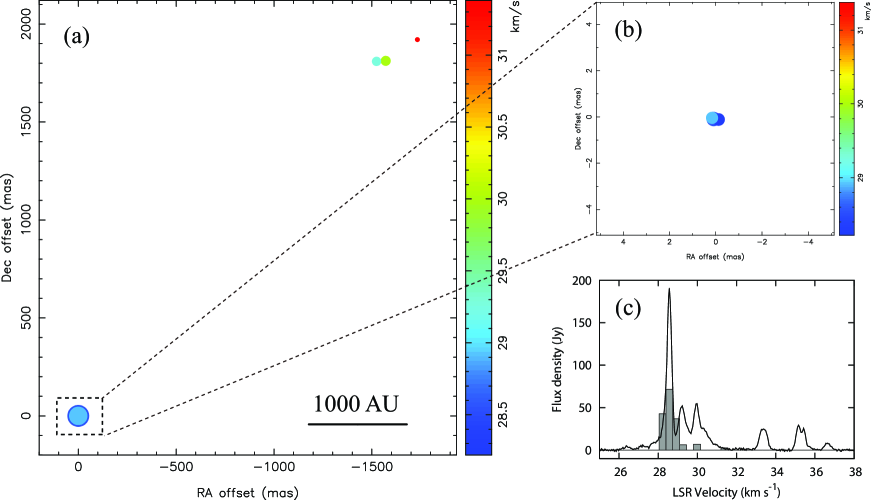
3.12 Cep A
Cepheus A (Cep A, figure 12) is a CO condensation at a distance of 730 pc (Johnson, 1957). One of massive star forming regions in Cep A is an UC H\emissiontypeII region, CepA-HW 2 (Hughes & Wouterloot, 1984). Cep A has been observed at 12.2 GHz with the VLBA (Minier et al. (2000), \yearcite2001A&A…369..278M), while our observation is the first VLBI at 6.7 GHz. We found 30 maser spots, 20 of which had ranging from 1.15 to 3.26 km s-1 and the other ten spots had ranging from 3.61 to 4.67 km s-1. It is notable that spots in the redshifted cluster aligned in the linear structure. The blueshifted cluster is located at \timeform1”.34 east from the redshifted cluster.
3.13 NGC 7538
The NGC 7538 (figure 13) is a star forming region at a distance of 2.8 kpc (Blitz et al. (1982); Campbell & Thompson (1984)) including at least 11 high luminosity infrared sources (NGC 7538 IRS 111), which are probably young massive stars (Kameya et al., 1990). The central star has been thought as O6 (Willner (1976); Campbell & Thompson (1984)), so the luminosity of the central source is and the mass is . It is known that this object is associated with an UC H\emissiontypeII region that is observed with the Very Large Array (VLA, Campbell (1984); Gaume et al. (1995)). The methanol maser of NGC 7538 has been observed with the MERLIN (Pestalozzi et al., 2006) and EVN at 6.7 GHz (Minier et al. (1998); Minier et al. (2000), \yearcite2001A&A…369..278M; Pestalozzi et al. (2004), \yearcite2006A&A…448L..57P), and with the VLBA at 12.2 GHz (Minier et al. (1998); Minier et al. (2000), \yearcite2001A&A…369..278M). The distribution of maser spots in our map corresponds to IRS 1 region (Minier et al., 1998). The map is in good agreement with that of Minier et al. (2000). The redshifted cluster spots with ranging from 56.45 to 55.75 km s-1 aligned in the linear structure as well as previous studies (Minier et al. (1998); Pestalozzi et al. (2004)). The spectral features of 53.07 km s-1 and 48.99 km s-1 corresponding to infrared sources IRS 11 and IRS 9 (Pestalozzi et al., 2006), respectively, were not detected.
4 Discussions
We have presented maps of twelve sources of methanol maser emission, and the seven of them are the first VLBI results at 6.7 GHz. The spatial distributions of maser spots show various morphology, such as linear (Cep A, NGC 7538), ring like structure (W 48), largely separated clusters (W3(OH), W 33A, G 24.780.08, G 29.950.02, IRAS 185560136, OH 43.80.1, ON 1, Cep A).
We discuss the properties of methanol maser at 6.7 GHz as a possible probe for astrometry comparing with the methanol maser at 12.2 GHz and the water maser at 22 GHz. We have detected twelve out of thirteen methanol masers at 6.7 GHz with the longest baseline of 50 M of our array. The integrated flux density of the correlated spectra account for 50 % of the total flux, and some of which account for more than 90 %. This high detection rate, flux recovery, and the small fringe spacing of 4 mas suggest that most of the methanol maser emission have compact structure. This result is consistent with a previous study for W3(OH) by Menten et al. (1992). We also showed that the correlated flux density at 50 M is typically 20 % of the total flux density. The size of maser spot inferred from the flux ratio varies from 2 to 30 AU (at a distance from 0.73 to 9 kpc of the sources). This is consistent with the core size of 2 to 20 AU obtained by Minier et al. (2002). The velocity range of typically 10 km s-1 (Caswell et al., 1995a) is narrow compared to that of water masers. Given this compactness and narrow velocity range as well as the known properties of long-life and small internal-motion, this methanol maser line is suitable for astrometry with VLBI.
From the viewpoint of observation, atomospheric fluctuation is a significant problem for observations at higher frequency. Strong absorption by water vapor in the atomosphere makes observations relatively difficult at 22 GHz in summer. This would be a potential problem in measurement of annual parallax. This is not the case for 6.7 GHz observation.
The astrometric VLBI observation uses continuum reference sources which are usually distant quasars. Such continuum sources show power-law, decreasing spectra, and the flux density is larger at 6.7 GHz than that of 12.2 GHz or 22 GHz. This property makes the astrometric observations easier in terms of detectability of reference sources.
The 6.7 GHz line might have some disadvantages due to its lower frequency in comparison with the 12.2 GHz line: The interstellar scintillation broadens the size of maser and reference sources. The interstellar broadening is stronger at lower frequency, and might affect to measure the precise position of the sources. Also the ionospheric density fluctuation changes path-length, consequently affects phase measurement at lower frequency. These effects depend on frequency as , i.e., affect 3.3 times larger for 6.7 GHz than for 12.2 GHz. Although Minier et al. (2002) discussed that the interstellar broadening is not significant at a scale larger that 1 mas, we have to take account of these effects for astrometry.
We have made a phase-referencing VLBI observation with the JVN and achieved that the positional accuracy of 50 as at 8.4 GHz and the image dynamic range of 50 on a target (Doi et al., 2006b). The Bigradient Phase Referencing (BPR) was used for this observation, and a reference calibrator was separated by a \timeform2D.1 from the target source. The following equation (1) can be used to derive an accuracy of annual parallax,
| (1) |
where is the minimum fringe spacing, is Dynamic range of the image, is the number of spots used in measuring annual parallax, and is the number of observations. If we make a series of observations for nine methanol maser spots for five epochs as in the cases of the observation by Xu et al. (2006), it is expected that an accuracy of 12 as in annual parallax would be achieved.
The flux density at 6.7 GHz is typically 10 times larger than that of 12.2 GHz (Caswell et al., 1995b), and the number of observable sources of 6.7 GHz is much larger than that of 12.2 GHz. This practical reason let us choose 6.7 GHz line than 12.2 GHz one.
We have started to improve the JVN at 6.7 GHz in terms of sensitivity and the number of stations to detect weak masers and reference sources. Usuda 64 m is one of the newly participating telescopes. Assuming an aperture efficiency of 50 % and of 50 K for all telescopes, it is expected that sensitivity for fringe detection (7 ) would be less than 5 Jy. We showed that the correlated flux density at 50 M is typically 20 % of the total flux density. Hence, sources with total flux density of larger than 25 Jy would be potential targets for astrometric observation. The number of such sources found in the catalog by Pestalozzi et al. (2005) is larger than 150.
The authors wish to thank the JVN team for observing assistance and support. The JVN project is led by the National Astronomical Observatory of Japan (NAOJ) that is a branch of the National Institutes of Natural Sciences (NINS), Hokkaido University, Gifu University, Yamaguchi University, and Kagoshima University, in cooperation with Geographical Survey Institute (GSI), the Japan Aerospace Exploration Agency (JAXA), and the National Institute of Information and Communications Technology (NICT).
References
- Bartkiewicz et al. (2005) Bartkiewicz, A., Szymczak, M., & van Langevelde, H. J. 2005, A&A, 442, L61
- Batrla et al. (1987) Batrla, W., Matthews, H. E., Menten, K. M., & Walmsley, C. M. 1987, Nature, 326, 49
- Beckwith et al. (1976) Beckwith, S., Evans, N. J., II, Becklin, E. E., & Neugebauer, G. 1976, ApJ, 208, 390
- Beltrán et al. (2004) Beltrán, M. T., Cesaroni, R., Neri, R., Codella, C., Furuya, R. S., Testi, L., & Olmi, L. 2004, ApJ, 601, L187
- Beuther et al. (2002) Beuther, H., Walsh, A., Schilke, P., Sridharan, T. K., Menten, K. M., & Wyrowski, F. 2002, A&A, 390, 289
- Blitz et al. (1982) Blitz, L., Fich, M., & Stark, A. A. 1982, ApJS, 49, 183
- Brand & Blitz (1993) Brand, J., & Blitz, L. 1993, A&A, 275, 67
- Bronfman et al. (1996) Bronfman, L., Nyman, L.-A., & May, J. 1996, A&AS, 115, 81
- Brown et al. (1982) Brown, A. T., Little, L. T., MacDonald, G. H., & Matheson, D. N. 1982, MNRAS, 201, 121
- Campbell (1984) Campbell, B. 1984, ApJ, 282, L27
- Campbell & Thompson (1984) Campbell, B., & Thompson, R. I. 1984, ApJ, 279, 650
- Caswell et al. (1995b) Caswell, J. L., Vaile, R. A., Ellingsen, S. P., & Norris, R. P. 1995b, MNRAS, 274, 1126
- Caswell et al. (1995a) Caswell, J. L., Vaile, R. A., Ellingsen, S. P., Whiteoak, J. B., & Norris, R. P. 1995a, MNRAS, 272, 96
- Cesaroni et al. (1998) Cesaroni, R., Hofner, P., Walmsley, C. M., & Churchwell, E. 1998, A&A, 331, 709
- Cragg et al. (1992) Cragg, D. M., Johns, K. P., Godfrey, P. D., & Brown, R. D. 1992, MNRAS, 259, 203
- Davis et al. (2004) Davis, C. J., Varricatt, W. P., Todd, S. P., & Ramsay Howat, S. K. 2004, A&A, 425, 981
- Dent et al. (1985) Dent, W. R. F., Little, L. T., Kaifu, N., Ohishi, M., & Suzuki, S. 1985, A&A, 146, 375
- Doi et al. (2006a) Doi, A., et al. 2006a, ArXiv Astrophysics e-prints, arXiv:astro-ph/0612528
- Doi et al. (2006b) Doi, A., et al. 2006b, PASJ, 58, 777
- Dreher & Welch (1981) Dreher, J. W., & Welch, W. J. 1981, ApJ, 245, 857
- Ellingsen (2006) Ellingsen, S. P. 2006, ApJ, 638, 241
- Etoka et al. (2005) Etoka, S., Cohen, R. J., & Gray, M. D. 2005, MNRAS, 360, 1162
- Forster & Caswell (1989) Forster, J. R., & Caswell, J. L. 1989, A&A, 213, 339
- Furuya et al. (2002) Furuya, R. S., Cesaroni, R., Codella, C., Testi, L., Bachiller, R., & Tafalla, M. 2002, A&A, 390, L1
- Gaume et al. (1995) Gaume, R. A., Goss, W. M., Dickel, H. R., Wilson, T. L., & Johnston, K. J. 1995, ApJ, 438, 776
- Genzel et al. (1981a) Genzel, R., et al. 1981a, ApJ, 247, 1039
- Genzel et al. (1981b) Genzel, R., Reid, M. J., Moran, J. M., & Downes, D. 1981b, ApJ, 244, 884
- Goedhart et al. (2004) Goedhart, S., Gaylard, M. J., & van der Walt, D. J. 2004, MNRAS, 355, 553
- Goddi et al. (2007) Goddi, C., Moscadelli, L., Sanna, A., Cesaroni, R., & Minier, V. 2007, A&A, 461, 1027
- Greisen (2003) Greisen, E. W. 2003, Information Handling in Astronomy - Historical Vistas, 109
- Hachisuka et al. (2006) Hachisuka, K., et al. 2006, ApJ, 645, 337
- Harvey-Smith & Cohen (2006) Harvey-Smith, L., & Cohen, R. J. 2006, MNRAS, 371, 1550
- Herbst & Racine (1976) Herbst, W., & Racine, R. 1976, AJ, 81, 840
- Honma et al. (2005) Honma, M., et al. 2005, PASJ, 57, 595
- Hughes & Wouterloot (1984) Hughes, V. A., & Wouterloot, J. G. A. 1984, ApJ, 276, 204
- Israel & Wootten (1983) Israel, F. P., & Wootten, H. A. 1983, ApJ, 266, 580
- Johnson (1957) Johnson, H. L. 1957, ApJ, 126, 121
- Joint Iras Science (1994) Joint Iras Science, W. G. 1994, VizieR Online Data Catalog, 2125, 0
- Kameya et al. (1990) Kameya, O., Morita, K.-I., Kawabe, R., & Ishiguro, M. 1990, ApJ, 355, 562
- Kobayashi et al. (2003) Kobayashi, H., et al. 2003, Astronomical Society of the Pacific Conference Series, 306, 367
- Kumar et al. (2004) Kumar, M. S. N., Tafalla, M., & Bachiller, R. 2004, A&A, 426, 195
- Kurtz et al. (1994) Kurtz, S., Churchwell, E., & Wood, D. O. S. 1994, ApJS, 91, 659
- Lonsdale et al. (1998) Lonsdale, C. J., et al. 1998, Bulletin of the American Astronomical Society, 30, 1355
- MacLeod et al. (1998) MacLeod, G. C., Scalise, E. J., Saedt, S., Galt, J. A., & Gaylard, M. J. 1998, AJ, 116, 1897
- Menten et al. (1988) Menten, K. M., Reid, M. J., Moran, J. M., Wilson, T. L., Johnston, K. J., & Batrla, W. 1988, ApJ, 333, L83
- Menten (1991a) Menten, K. 1991a, ASP Conf. Ser. 16: Atoms, Ions and Molecules: New Results in Spectral Line Astrophysics, 16, 119
- Menten (1991b) Menten, K. M. 1991b, ApJ, 380, L75
- Menten et al. (1992) Menten, K. M., Reid, M. J., Pratap, P., Moran, J. M., & Wilson, T. L. 1992, ApJ, 401, L39
- Mezger et al. (1988) Mezger, P. G., Chini, R., Kreysa, E., Wink, J. E., & Salter, C. J. 1988, A&A, 191, 44
- Minier et al. (1998) Minier, V., Booth, R. S., & Conway, J. E. 1998, A&A, 336, L5
- Minier et al. (2000) Minier, V., Booth, R. S., & Conway, J. E. 2000, A&A, 362, 1093
- Minier et al. (2001) Minier, V., Conway, J. E., & Booth, R. S. 2001, A&A, 369, 278
- Minier et al. (2002) Minier, V., Booth, R. S., & Conway, J. E. 2002, A&A, 383, 614
- Moscadelli et al. (1999) Moscadelli, L., Menten, K. M., Walmsley, C. M., & Reid, M. J. 1999, ApJ, 519, 244
- Moscadelli et al. (2002) Moscadelli, L., Menten, K. M., Walmsley, C. M., & Reid, M. J. 2002, ApJ, 564, 813
- Moscadelli et al. (2003) Moscadelli, L., Menten, K. M., Walmsley, C. M., & Reid, M. J. 2003, ApJ, 583, 776
- Pandian et al. (2007) Pandian, J. D., Goldsmith, P. F., & Deshpande, A. A. 2007, ApJ, 656, 255
- Patel et al. (2000) Patel, N. A., Greenhill, L. J., Herrnstein, J., Zhang, Q., Moran, J. M., Ho, P. T. P., & Goldsmith, P. F. 2000, ApJ, 538, 268
- Pestalozzi et al. (2004) Pestalozzi, M. R., Elitzur, M., Conway, J. E., & Booth, R. S. 2004, ApJ, 603, L113
- Pestalozzi et al. (2005) Pestalozzi, M. R., Minier, V., & Booth, R. S. 2005, A&A, 432, 737
- Pestalozzi et al. (2006) Pestalozzi, M. R., Minier, V., Motte, F., & Conway, J. E. 2006, A&A, 448, L57
- Racine (1968) Racine, R. 1968, AJ, 73, 233
- Shepherd (1997) Shepherd, M. C. 1997, ASP Conf. Ser. 125: Astronomical Data Analysis Software and Systems VI, 125, 77
- Shibata et al. (1998) Shibata, K. M., Kameno, S., Inoue, M., & Kobayashi, H. 1998, ASP Conf. Ser. 144: IAU Colloq. 164: Radio Emission from Galactic and Extragalactic Compact Sources, 144, 413
- Sobolev et al. (1997) Sobolev, A. M., Cragg, D. M., & Godfrey, P. D. 1997, MNRAS, 288, L39
- Stier et al. (1984) Stier, M. T., et al. 1984, ApJ, 283, 573
- Szymczak et al. (2000) Szymczak, M., Hrynek, G., & Kus, A. J. 2000, A&AS, 143, 269
- Torrelles et al. (2001a) Torrelles, J. M., et al. 2001a, ApJ, 560, 853
- Torrelles et al. (2001b) Torrelles, J. M., et al. 2001b, Nature, 411, 277
- Turner & Welch (1984) Turner, J. L., & Welch, W. J. 1984, ApJ, 287, L81
- Vallee & Avery (1990) Vallee, J. P., & Avery, L. W. 1990, A&A, 233, 553
- van der Tak et al. (2000) van der Tak, F. F. S., van Dishoeck, E. F., Evans, N. J., II, & Blake, G. A. 2000, ApJ, 537, 283
- Vlemmings et al. (2006) Vlemmings, W. H. T., Harvey-Smith, L., & Cohen, R. J. 2006, MNRAS, L65
- Vlemmings et al. (2003) Vlemmings, W. H. T., van Langevelde, H. J., Diamond, P. J., Habing, H. J., & Schilizzi, R. T. 2003, A&A, 407, 213
- Voronkov et al. (2002) Voronkov, M. A., Slysh, V. I., Palagi, F., & Tofani, G. 2002, Proceedings of the 6th EVN Symposium, 213
- Walsh et al. (1998) Walsh, A. J., Burton, M. G., Hyland, A. R., & Robinson, G. 1998, MNRAS, 301, 640
- Willner (1976) Willner, S. P. 1976, ApJ, 206, 728
- Wood & Churchwell (1989) Wood, D. O. S., & Churchwell, E. 1989, ApJ, 340, 265
- Xu et al. (2006) Xu, Y., Reid, M. J., Zheng, X. W., & Menten, K. M. 2006, Science, 311, 54