Evolution of the Bar Fraction in COSMOS: Quantifying the Assembly of the Hubble Sequence
Abstract
We have analyzed the redshift-dependent fraction of galactic bars over 0.2z0.84 in 2,157 luminous face-on spiral galaxies from the COSMOS 2-square degree field. Our sample is an order of magnitude larger than that used in any previous investigation, and is based on substantially deeper imaging data than that available from earlier wide-area studies of high-redshift galaxy morphology. We find that the fraction of barred spirals declines rapidly with redshift. Whereas in the local Universe about 65% of luminous spiral galaxies contain bars (SBSAB), at this fraction drops to about 20%. Over this redshift range the fraction of strong (SB) bars drops from about 30% to under 10%. It is clear that when the Universe was half its present age, the census of galaxies on the Hubble sequence was fundamentally different from that of the present day. A major clue to understanding this phenomenon has also emerged from our analysis, which shows that the bar fraction in spiral galaxies is a strong function of stellar mass, integrated color and bulge prominence. The bar fraction in very massive, luminous spirals is about constant out to z0.84 whereas for the low mass, blue spirals it declines significantly with redshift beyond z=0.3. There is also a slight preference for bars in bulge dominated systems at high redshifts which may be an important clue towards the co-evolution of bars, bulges and black holes. Our results thus have important ramifications for the processes responsible for galactic downsizing, suggesting that massive galaxies matured early in a dynamical sense, and not just as a result of the regulation of their star formation rate.
Subject headings:
galaxies: evolution — galaxies: high-redshift — galaxies: spiral — galaxies: structure — galaxies: general1. Introduction
How, when and at what rate did the Hubble sequence form? This question is central to the field of galaxy formation and evolution. We examine it by measuring the evolution of the bar fraction with redshift using the 2-square degree Cosmic Evolution Survey (COSMOS). In nearly all simulations, the formation timescale for a bar is rapid once the necessary conditions (a massive, dynamically cold and rotationally-supported disk) are met. Therefore the redshift evolution of the bar fraction is a fundamental probe of the evolutionary history of disk galaxies.
The bar fraction is defined simply as:
| (1) |
In the local Universe the value of is quite well established. When only strongly barred111Bars that are highly elliptical and have rectangular isophotes are classified as strongly barred (SB) galaxies whereas those with more oval shapes are classified as SAB or ovally distorted galaxies galaxies (SB) are counted, the RSA, RC3 and UGC (Sandage & Tammann, 1987; De Vaucouleurs, 1991; Nilson, 1973) all give values of . When ovally distorted (SAB) are also counted the situation becomes a little less clear-cut, because, unlike the RC3, the UGC and RSA do not attempt to carefully compile an inventory of such galaxies. If ovally distorted systems in the RC3 are included in the computation of then the local bar fraction rises to . This result is in good agreement with recent infrared studies which have measured the local bar fraction to be 0.65 (Eskridge et al., 2000; Whyte et al., 2002; Menéndez-Delmestre et al., 2007; Marinova & Jogee, 2007). In the infrared, a majority of the SAB galaxies are classified as strongly barred SB systems (Eskridge et al., 2000). As noted by Eskridge et al. (2000) and Menéndez-Delmestre et al. (2007), the overall bar fraction is the same in the infrared and the optical (although there is a small number of cases where bars are unveiled at infrared wavelengths). This is not surprising, because bars are primarily stellar structures whose visibility only declines sharply at ultraviolet wavelengths, short wards of the Balmer break (see also §A.1). We conclude that the consensus value of the local barred fraction is for strongly barred systems, and for all barred galaxies, and that these values are so well-known that they have not changed significantly in over four decades.
In sharp contrast with the rapid and stable consensus reached on the local bar fraction, attempts to measure the bar fraction at high redshift have proven difficult. The earliest analyses of the bar fraction in the Hubble Deep Fields (HDFs) found a dramatic paucity of barred spirals at z0.5 (Abraham et al., 1996; van den Bergh et al., 1996; Abraham et al., 1999). These authors concluded that at lookback times greater than 5 Gyr disks were either dark matter dominated or dynamically too hot (perhaps due to the increased merging activity) to host bars. However, the small volume probed by the HDFs (only thirty bright, face-on spiral galaxies between ) led to concerns that the bar fraction at high redshift may not be adequately measured. Sheth et al. (2003) investigated whether a significant number of bars could have been missed, as suggested by Bunker (1999) using the H-band NICMOS HDF. Sheth et al. (2003) found four bars and two candidate bars out of 95 galaxies at z0.7. Overall, the fraction of barred spirals in the NICMOS HDF remained extremely low, as in the optical HDF studies. But Sheth et al. (2003) noted that their study was limited by the coarse NICMOS resolution (015) such that only the largest (and rarest) bars could be identified (bars with semi-major axis 5 kpc). When the fraction of these large bars at z0.7 was compared to local samples, there was no compelling evidence for a decline in barred spirals, but likewise the NICMOS data did not unveil any new bars at low redshifts; all except one of the four bars in the Sheth et al. (2003) study are at z0.9, where k-correction effects are important (§A.1).
A major advance in spatial resolution was possible with the Advanced Camera for Surveys (ACS) whose 005 pixels are able to resolve all but the smallest (nuclear, 2 kpc diameter) bars at all redshifts. Using ACS data, two studies (Elmegreen, Elmegreen & Hirst, 2004; Jogee et al., 2004) found that contrary to the previous HDF results, the bar fraction is constant at 30% over the last 8 Gyr (since ). The sample sizes, however remained modest in these studies (186 in Elmegreen, Elmegreen & Hirst 2004, and 258 in Jogee et al. 2004).
In this paper we examine in detail the redshift evolution of the bar fraction using the unparalleled wide and deep 2-square degree COSMOS data set. The plan for the paper is as follows: in Section 2 we describe our sample selection procedure. The classification methodology we have adopted is described in Section 3. Our main results are presented in Section 4, before being discussed in Section 5. Our conclusions are summarized in Section 6. An Appendix to this paper provides a detailed analysis of possible selection effects at high redshift and a discussion of our local calibration sample of 139 galaxies from the Sloan Digital Sky Survey (SDSS) Data Release 4 (Adelman-McCarthy et al., 2006). Throughout this paper we adopt a flat -dominated cosmology with =70 km s-1 Mpc-1, , and .
2. Sample Selection
An overview of the COSMOS program is given in Scoville et al. (2007a) and details of the HST observations are described in Scoville et al. (2007b). The COSMOS observations are undertaken in the F814W filter (‘I-band’) and reach a depth of I 27 (10). The photometric catalog and redshift measurements used in this paper are given in Mobasher et al. (2007) and Capak et al. (2007).
The most important and difficult step in studying the evolution of galactic structures is choosing comparable samples at different lookback times. For nearby galaxies, multi-waveband data with sufficient spatial resolution are available. Therefore galaxy properties (e.g., Hubble type, inclination, distance) are accurately known for nearby spirals. The underlying disk is also well-imaged and multiple techniques for identifying a bar may be employed. However, for high redshift galaxies, the situation is more complicated. Here we summarize the steps we have taken to overcome these problems.
We choose all galaxies brighter than L with an empirically determined luminosity evolution of 1 magnitude from Capak (2003), such that M = -21.7 at z=0.9 (Capak, 2003). This criterion is specifically targeted for choosing galaxies from the same portion of the galaxy luminosity distribution at all redshifts. As we shall see later, a no-evolution luminosity model would have only steepened the overall decline in the bar fraction, further strengthening the results presented in this paper. For this luminosity criterion, at a redshift of z=0.9, the sample is complete for all galaxies with a half-light radius smaller than 10 kpc (see Figure 6, Scoville et al. 2007b). The number of galaxies with a half light radius larger than 10 kpc is extremely low (e.g., Figure 10 in Sargent et al. 2007, or Figure 10 in Barden et al. 2005) and thus our sample is essentially complete.
We eliminate all elliptical and lenticular galaxies based on the galaxy’s spectral energy distribution (SED) type Tphot, choosing all galaxies with T 2. Tphot is the best fit spectral template ordered by the 4000Å break strength (see Mobasher et al. 2007). The Tphot sequence can be thought of as a photometric Hubble type going from the reddest early type (Tphot=1) galaxies to bluest late type (Tphot=6) galaxies. Types 1 through 4 are defined by the templates from Coleman et al. (1980) and correspond to Elliptical, Sbc, Scd, and Irregular Hubble types respectively. Types 5 and 6 correspond to Kinney et al. (1996) type SB3 and SB2 respectively which are local star-burst galaxies with little or no extinction. Typical uncertainties in Tphot are 0.2.
The Tphot values are robust descriptors of galaxies to z1.2 as confirmed by a comparison of the photometric and spectroscopic redshifts for over eight hundred galaxies (Mobasher et al., 2007). Comparison of galaxy types based on morphological parameters such as Gini and asymmetry and the Tphot type shows that T selects all spirals to z1.2 (Capak et al., 2007; Ilbert et al., 2007). With increasing redshift there is an increase in the population of blue ellipticals and blue-bulge dominated spirals; however these galaxies are only significant at the faint end of the luminosity function (e.g., Ilbert et al. 2006; Capak et al. 2007; Ilbert et al. 2007). For instance, at M-20, the blue-bulge dominated spiral population is less than 1% of the total disk population (Ilbert et al., 2006). At z0.8, amongst elliptical galaxies (identified by the Gini and asymmetry parameters), the contribution of blue ellipticals to the total volume density is significant at the very low mass end (109 ). For the high luminosity (massive) galaxies, which are studied in this sample, the contribution from blue ellipticals is no more than a few percent. We do find a small fraction of compact systems with blue colors which we identify and reject from our analysis.
We impose a redshift cutoff of so that the F814W filter does not probe bluer than rest-frame g-band. The rationale for probing no bluer than rest-frame g-band is described in detail in §A.1 of the Appendix, but we also note here that at this redshift the angular diameter of a 0.05 ACS pixel subtends a physical scale of 0.4 kpc. At this resolution we expect to detect easily the entire population of bars in nearby spiral galaxies (see Figure 3 of Sheth et al. 2003, or Figure 7 of Menéndez-Delmestre et al. 2007). We note that all our galaxies subtend at least 10 pixels. The smallest petrosian radius in our sample is 5.2 pixels.
Imposing these cuts reduces our sample to 3886 spirals. However, galactic structures like bars are difficult to identify and quantify in edge-on galaxies. Therefore, we further eliminate all galaxies with inclinations 65∘, the same limiting inclination used in studies of the bar fraction in nearby spirals (e.g., Menéndez-Delmestre et al. 2007). Inclination values for our sample are determined from the axial ratio of the galactic disk, which is identified using a two dimensional decomposition with a bulge and exponential component for each galaxy using GALFIT (Peng et al., 2002). The inclination cut eliminates an additional 986 objects, leaving 2900 galaxies.
Finally, we discard all galaxies that were obviously merging, or too irregular or peculiar to be fit with ellipses. This eliminates 743 galaxies, leaving a final sample of 2,157 spiral galaxies which were then classified as barred or unbarred. The importance of eliminating peculiar objects from our analysis is investigated further in §A.2 of the Appendix, but we note here that including these objects would not have changed any of our conclusions.
All galaxies are detected in at least thirteen, sometimes all sixteen available photometric bands. The galaxy luminosities, masses and colors are measured from the photometric redshift code (Mobasher et al., 2007) which simultaneously solves for observed galaxy flux, redshift, galaxy type, and extinction intrinsic to the galaxy. The galaxy type combined with the flux-normalization yields rest frame, extinction corrected, luminosities and colors for each object. The rest frame color and luminosity is then converted into stellar mass using the Bell et al. (2005) relation. Errors in the mass estimate are within a factor of 3 due to systematics. With our deep multi-wavelength photometry these parameters are robust and non-degenerate at z1.2. Over this redshift range we have at least two data points red-ward of the 4000 Å break ( and at z=1.2) and two points blue-ward ( and at z=0.3), which allows us to break the 4000Å break strength-extinction degeneracy. More detailed SED fits using spectroscopic redshifts yield similar results for the galaxy luminosity, mass and color (Mobasher et al., 2007; Ilbert et al., 2007).
3. Bar Classification Methodology
We identified bars using two methods and the results were cross-checked for consistency. We use the same methods for the local SDSS calibration sample (see A.1) and the COSMOS data to reduce biases that can be induced by the use of different classification methods.
Our first method was to use the ellipse fitting technique that has been used widely by multiple studies of both nearby and high redshift galaxies (e.g., Regan & Elmegreen 1997; Sheth et al. 2000; Knapen et al. 2000; Sheth et al. 2002; Laine et al. 2002; Sheth et al. 2003; Jogee et al. 2004; Menéndez-Delmestre et al. 2007; Marinova & Jogee 2007). For a detailed discussion of the ellipse fitting method and the classification scheme we refer the reader to Menéndez-Delmestre et al. (2007). Briefly, bars are identified from a dual signature of the ellipticity and position angle profiles. We require that the ellipticity increases monotonically, exceeds 0.2, and then drops by at least 0.1. The position angle profile should show a relatively constant position angle over the bar region and change by at least 10o after the bar as the isophotes enter the disk. In general the fitting procedure is extremely robust and fits ellipses to the 1 noise level in the images – in the case of COSMOS this means we are able to fit galaxies to the outermost disk isophotes (at =24.5 mag arcsec-2, see Figure 9) in the highest redshift bins. In a small number of cases, the ellipse fitting method can miss an existing bar (see Figure 3 in Menéndez-Delmestre et al. 2007). This usually happens when the position angle of the disk and bar are aligned or when the ellipticity drop is moderated by open spiral arms.
In addition to the ellipticity and position angle profiles, we classified the bars further into strong bars and intermediate bars by visually examining the isophote shapes. The strong bars are those with an ellipticity greater than 0.4 to be consistent with previous work in this field (e.g., Jogee et al. 2004). However we note that the definition is arbitrary because there is a continuum of bar strengths (Block et al., 2002; Whyte et al., 2002; Buta, Laurikainen & Salo, 2004; Buta et al., 2005; Menéndez-Delmestre et al., 2007). We refer to this first method as the ‘ElPa’ classification method for the remainder of the paper.
Our second method for classifying galaxies was visual identification of galaxies into categories of SA (unbarred), SAB, and SB by one of the authors (DME). Not all galaxies were classified into these three neat categories. DME also classified galaxies as edge-on, clump-cluster galaxy, or compact (spheroidal) galaxy following her work on the Ultra Deep Field (Elmegreen & Elmegreen, 2005a; Elmegreen et al., 2005b, c; Elmegreen & Elmegreen, 2006; Elmegreen et al., 2007). Galaxies that were visually classified as edge-on, clump-cluster, or compact are not included in the visual classification results. The total number of galaxies classified visually into barred and unbarred spirals is 1,705.
The classification by DME was cross-checked for five hundred galaxies by another author (KS), and also cross-checked against the ellipse fitting method. The cross checks between the two methods finds agreement for 85% of the sample. In general we found that we classified more galaxies as barred by eye than using the ellipse fitting profile. This is as expected because there are particular morphologies where the ellipticity and position angle signature can be masked by the relative orientation of the bar and disk, and the pitch angle of the spiral arms. As noted earlier, a detailed discussion of such cases can be found in Menéndez-Delmestre et al. (2007). Only in 5% of the cases is there a gross mismatch where one method differed from the other by two classes, i.e. bar in one and spiral in the other. This generally occurred for very faint or small nuclei where the ellipse fitting method has problems fitting the isophotes. In the remaining 10% of the cases, the methods agreed to within one class, i.e. intermediate bar in one, and a spiral or strong bar in the other. The cross checks were internally consistent at all redshifts.
4. Results
4.1. The Declining Bar Fraction

Figure 1 shows the evolution of the bar fraction in COSMOS as a function of redshift in six equal redshift bins (z = 0.117), starting at z=0.14 at a lookback time of 1.8 Gyr. The redshift bins correspond to lookback times of 1.8–3.0, 3.0–4.1, 4.1–5.0, 5.0–5.8, 5.8–6.5, and 6.5–7.1 Gyr respectively. The two rows show the bar fractions measured from the two classification methods described above (§3). The left column shows the total bar fractions (strong bars oval bars) and right column shows the strong-bar fraction (SB). For each data point we list the number of bars and the total number of galaxies classified in each bin. The error bars reflect the statistical uncertainty in the fraction and are calculated from the expression for fraction and number of galaxies .
We find that the bar fraction (for all galaxy luminosities combined) has evolved dramatically over the last 7 Gyr. At z=0.84, the total bar fraction using the ElPa classification method is fbar = 0.220.02 (0.310.02 for visual classification method), one-third (one-half) its present-day value. We see the same trend when we consider only the strong bar fraction: fSB evolves from 0.270.05 (0.350.05) at z=0.0 to 0.090.01 (0.170.02) at z=0.835.
When combined with the z=0.0 data point from our analysis of a local SDSS sample (Table 1, Figure 6, & §A.1), we also find that the evolutionary trend is weaker in the first three bins at . Within the error bars, the data at these redshifts are consistent with a roughly constant bar fraction (fbar=0.6, fSB = 0.3). These results are summarized in Table 1.
4.2. Bar Fraction as a Function of Galaxy Mass & Luminosity
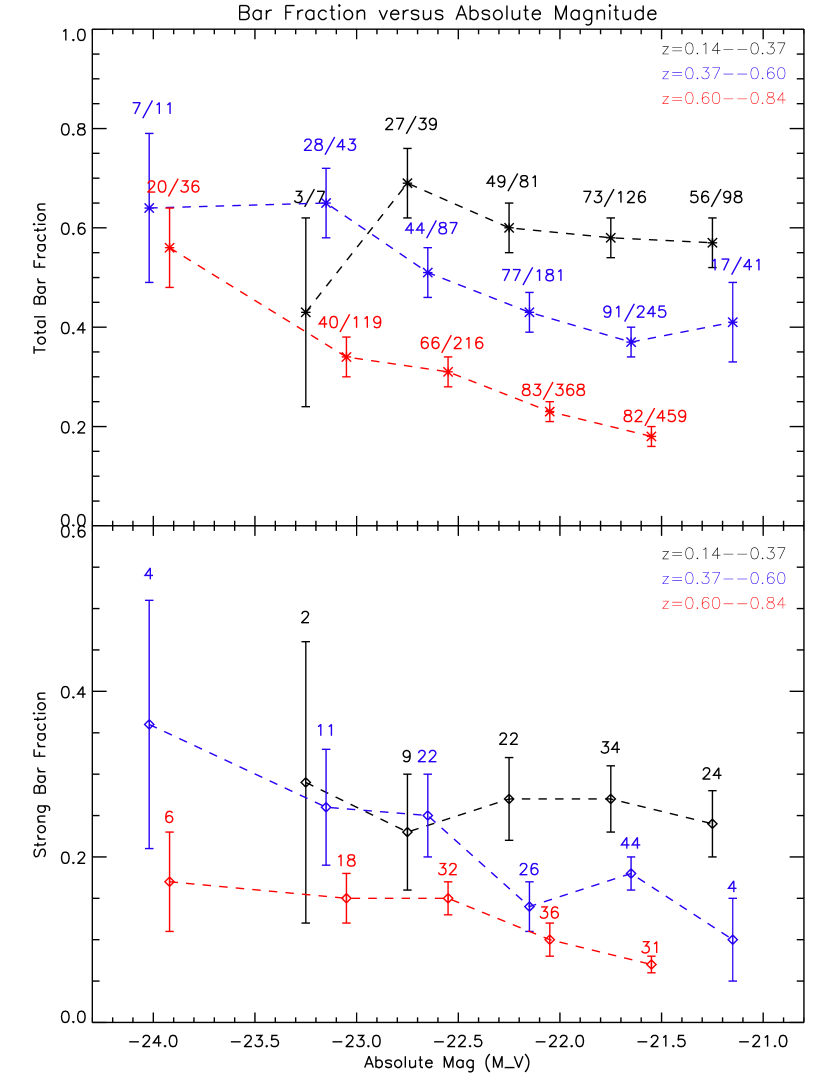
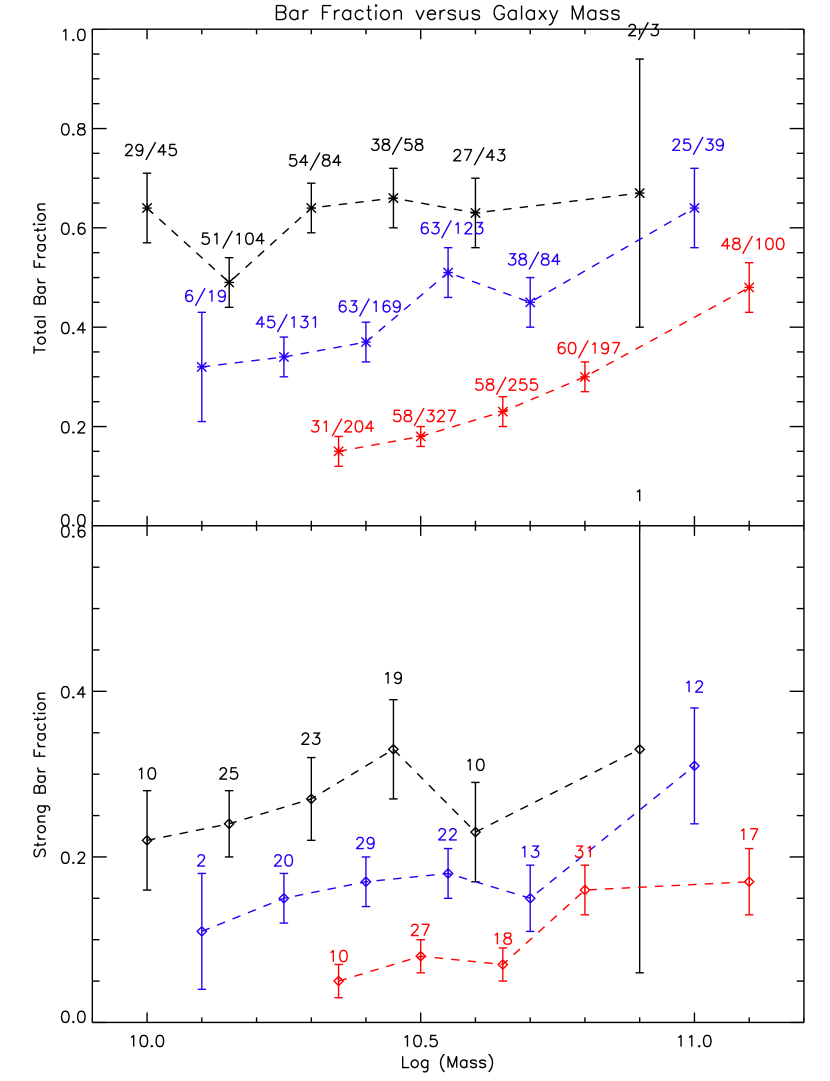
Figures 2 and 3 show fbar versus the absolute luminosity and mass of the disk, respectively, in the three redshift bins from z=0.14 to z=0.84. We find that in the highest redshift bin, galaxies with masses log M () 10.9 and luminosities M -23.5 have f0.5, which is about the local value. In contrast, the low mass (log M 10.5) and low luminosity (M -22.5) galaxies have f 0.2 at high redshift. The same trend is seen for strong bars, fSB. At low redshifts, the bar fraction is roughly equal for all luminosities.
This trend is not due to incompleteness in the sample. We establish the completeness of our sample by measuring the mass limit based on our selection criteria. Since we choose galaxies based on a luminosity cutoff and galaxy colors, the mass completeness is most likely to be an issue for the reddest systems at the highest redshift. For our luminosity cutoff and Tphot criteria, our sample is complete for galaxies with masses greater than 3–41010 at z=0.9 for the reddest (Tphot=2, rest-frame m 0.56) galaxies. Obviously, for the bluest systems (e.g., Tphot = 6), our sample is complete to 0.9–1 1010 . These values are calculated from the Maraston (2005) and Bell et al. (2005) models respectively. Note that at z=0.6, the mass limit for completeness in the sample is lowered by another 25%. Our lowest mass data point in the 0.6z0.84 bin (the highest redshift bin) in Figure 3 is for galaxies with masses between 3–41010. It is therefore free from the possible mass selection bias. The data points at lower masses and lower redshifts are also computed from a complete sample of masses for a given bin. Thus we conclude that the observed strong correlation between the bar fraction and mass in the highest redshift bin is a robust result.
The most important result in these figures is that in the highest redshift bins in this study, a majority of the most massive and luminous systems are barred. There is little evolution in the bar fraction with redshift in these systems. Since bars form in massive, dynamically cold and rotationally supported galaxies, the high bar fraction indicates that the most massive systems are already “mature” enough to host bars. This agrees with the analysis of the evolution of the size function of disk galaxies of several studies (Sargent et al., 2007; Ravindranath et al., 2004; Barden et al., 2005; Sheth et al., 2007b), which find that large disks are already in place by z=1 and little or no evolution in disk sizes from z1 to the present epoch. Conversely the low bar fraction in the lower luminosity, lower mass systems indicates that these systems are either dynamically hot, not rotationally supported and/or have not accreted sufficient mass to host bars. Merging activity, which is more common at higher redshifts, is also likely to affect the less massive systems more severely and may be responsible for heating them up more than high mass systems. Bar formation may be delayed in these hot disks if they are embedded in a massive dark matter halo. Although the exact nature of these disks is not yet well-known, there is an indication that later type systems may be dynamically hotter (Kassin et al., 2007). We consider these points further in following sections.
4.3. Bar Fraction as a Function of Galaxy Color & Bulge Luminosity
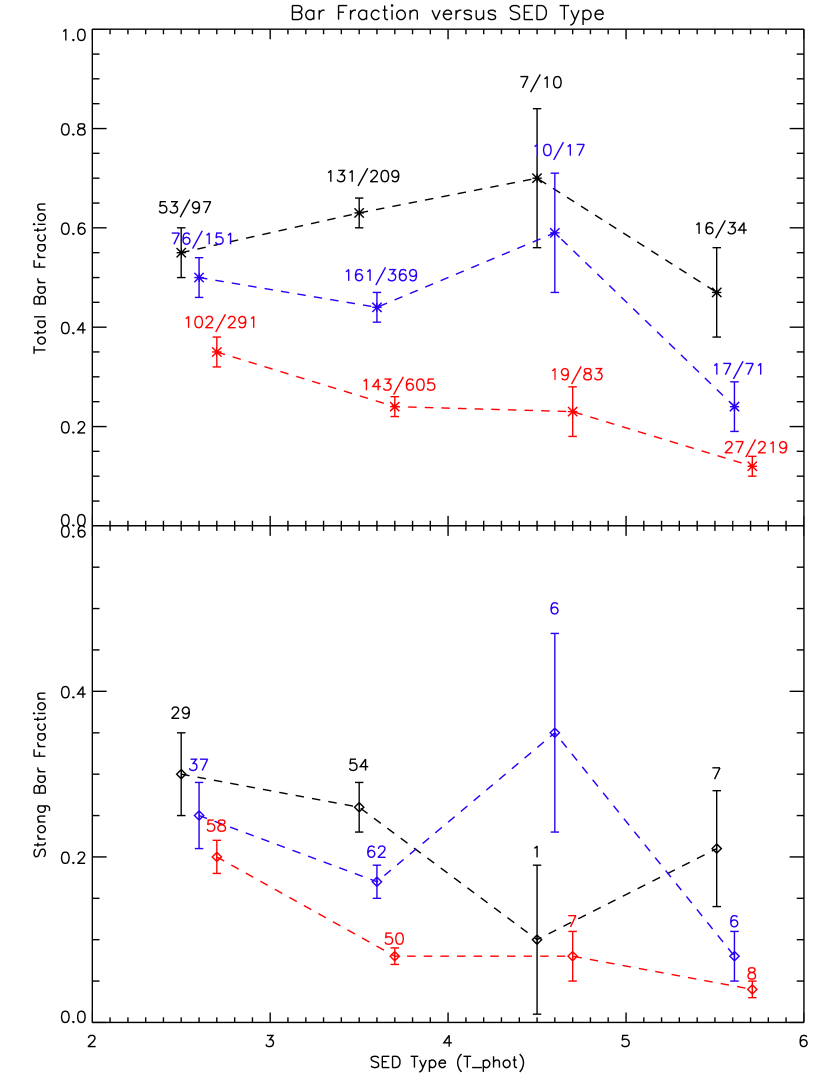
Figure 4 shows how fbar varies with galaxy SED type (Tphot) and redshift. At low redshift, fbar is independent of Tphot, and at high redshift, decreases from early (T3) to late types (T3). Similarly, decreases with redshift more strongly for the late types than the early types. This latter trend is consistent with the previous result that the bar fraction changes with redshift primarily for the low mass galaxies, which tend to have late SED types.
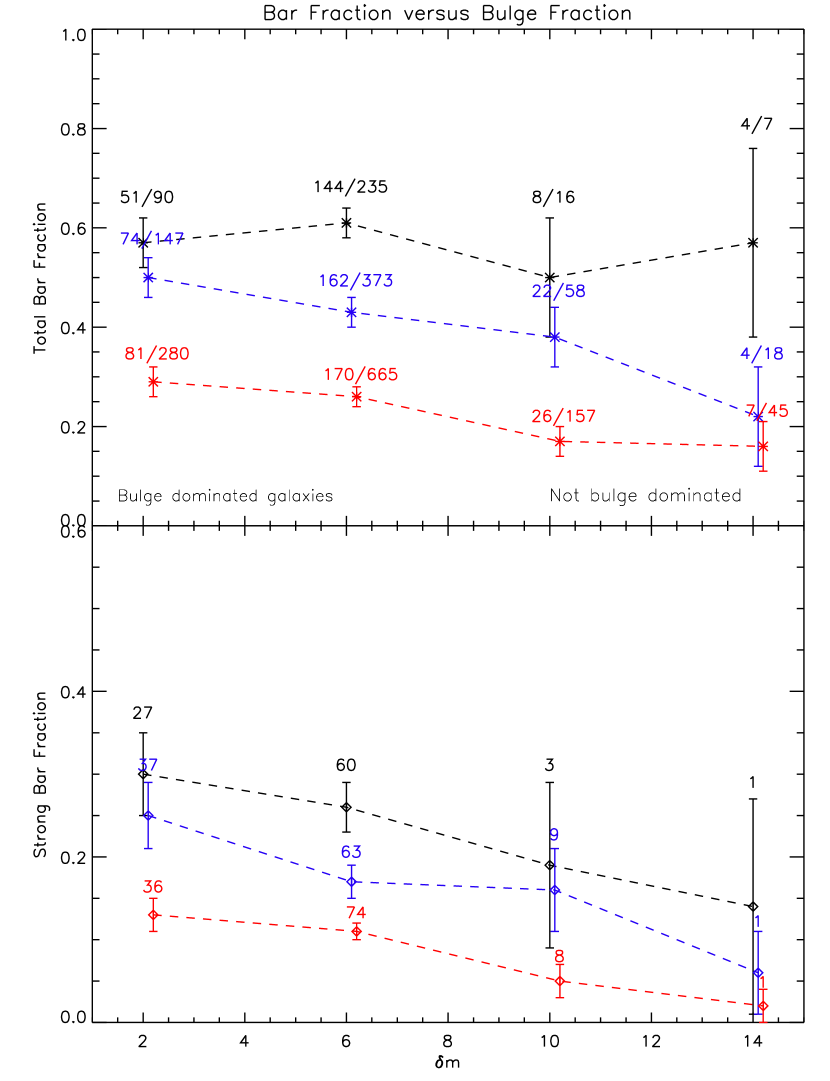
Finally we consider how the bar fraction varies as a function of the bulge light in galaxies. Figure 5 shows fbar versus the fraction of bulge luminosity in a galaxy for different redshift bins. The bulge magnitude is calculated from fitting each galaxy with a Sersic exponential profile using GALFIT (Peng et al., 2002). The x-axis in this figure is the difference between the bulge magnitude measured from the GALFIT fitting and the total (disk + bulge) apparent magnitude. We note that the relative calibration across redshift bins should be treated with caution because we are not correcting for k-correction effects that are known to affect two dimensional decomposition of galaxies. Within a given redshift bin, however, the bulge contribution measurement should be robust except for one important caveat. The fitting algorithm is not designed to decompose a bar separately. As a result the bar light is likely to be split between the exponential and Sersic components. If the light profile of a bar is exponential, as it is in later Hubble type galaxies locally, the majority of that light is likely to be part of the exponential component. On the other hand if the bar is relatively short and not highly elliptical, its light is likely to be added to the Sersic component. The detailed decomposition of the bulgebardisk will require a more sophisticated approach, which is beyond the scope of this paper.
Keeping the above caveat in mind, we find that fbar is slightly higher for galaxies that are “bulge dominated” compared to galaxies which are not bulge dominated in the highest redshift bin. In the lowest redshift bin the slight trend disappears and the bar fraction is roughly constant for all types of bulges, although there are only a few galaxies that are not bulge dominated. This correlation together with the previous correlations (Figures 2, 3, 4) suggests that the galaxies that are red, luminous and massive are also bulge dominated, and in these galaxies the bar fraction does not vary strongly with redshift. We discuss the implications of the bar-bulge correlation in §5.4.
5. Discussion
5.1. Comparison with Previous Studies
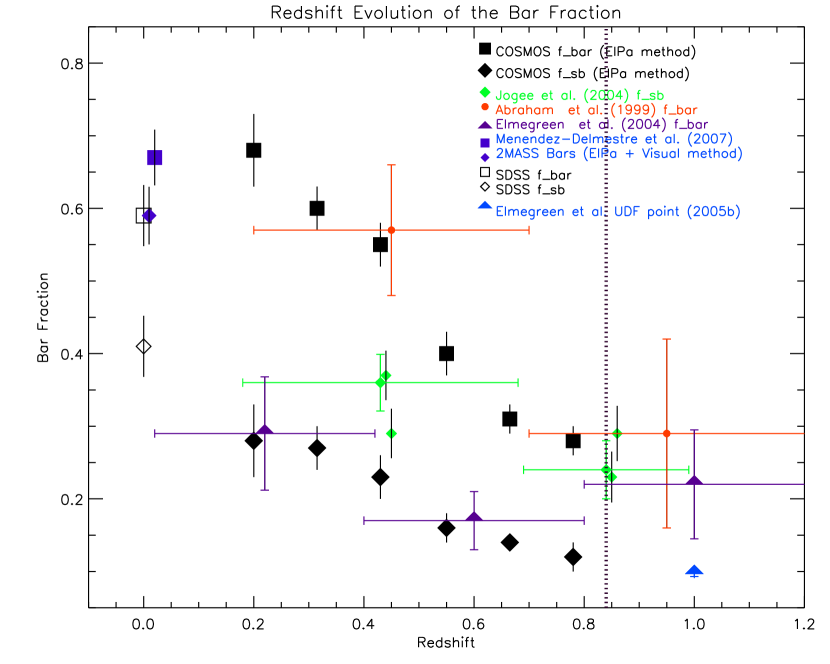
In Figure 6 we plot all of the data from previous studies of the evolution of the bar fraction for comparison to the COSMOS results. In all cases there is a general decline in the bar fraction. However the interpretation of the data has been very different amongst these studies as we discuss below.
Our basic result of a decline in the bar fraction is consistent with the earliest HDF studies (Abraham et al., 1996; van den Bergh et al., 1996; Abraham et al., 1999) shown with the red data points in Figure 6. These studies reported a striking decline in the fraction of bars at z0.5. But re-analysis of their Figure 4 shows that, in fact, at z0.5, there are 10 barred spirals out of 29 galaxies, and at z0.8, there are 3 barred spirals out of 11 galaxies, consistent with the COSMOS results presented here. Similarly our result is consistent with the very low bar fraction (5–10%) measured from the NICMOS HDF (Sheth et al., 2003) at z0.7. But it is difficult to compare this bar fraction to the ours because the NICMOS data can only probe the largest bars. Of course the volume probed by the HDF studies was too small to allow evolution in to be probed with much confidence.
On the other hand, our central result is fundamentally different from that reported by Jogee et al. (2004) and Elmegreen, Elmegreen & Hirst (2004); these studies have reported a constant bar fraction with redshift to z1. In the Jogee et al. (2004) study, the authors classified 258 galaxies as either strongly barred or unbarred. Their modest sample size however prevented them from studying the fbar evolution in detail. Their first bin, for example, encompasses our central four redshift bins. Nevertheless we can compare their measurement of fSB to ours. Over the same redshift range in the COSMOS data, we measure a strong bar fraction, fSB = 0.230.01 for the visual classification, and 0.170.01 for the ElPa classification methods. In comparison, Jogee et al. (2004) reports a f 0.30.03222Errors are not reported in the Jogee et al. (2004) study. We measure an error for their data using the bar fraction and total number of galaxies reported, in the same way as we measured for the COSMOS data. Even though the Jogee et al. (2004) study probes fainter galaxies (M-19.3), which should have resulted in a lower bar fraction, their fSB is 50% higher than the COSMOS results. Some possible reasons for the discrepancy in the value of fSB may be the different use of inclination cuts (they used 60o compared to our cut at 60o) and selection criteria. We chose our sample based on a galaxy luminosity with an evolving luminosity function, spectral type/color and visual classification, whereas Jogee et al. (2004) chose their sample based on a fixed (lower) luminosity, range of U-V colors (which is similar to our cut in Tphot), and a Sersic parameter from a single fit to the galaxies or a concentration index. Given the various uncertainties at hand, we conclude that the data presented by Jogee et al. (2004) can be interpreted as being consistent with the more significant decline seen in our sample.
Elmegreen, Elmegreen & Hirst (2004) also reported a constant bar fraction to based on an analysis of 186 background galaxies larger than 10 pixels in diameter in the multi-color ACS image of the Tadpole galaxy. These data points are shown with the the purple triangles in Figure 6. The data show a declining bar fraction from % to % out to with uncertainty, and a rise in the bar fraction from , which is beyond the redshift investigated here333Four galaxies in their Fig. 10 at are incorrect because of a photometric redshift error - the corrected data point is shown here. Their conclusion that the bar fraction is flat on average followed primarily from the second rise at ; otherwise their fractions agree with ours to within statistical uncertainties. Our results are also in line with a recent analysis of the Hubble Ultra Deep Field where the bar fraction, shown with the blue triangle, is 10% (Elmegreen et al., 2005b) at z1, consistent with the previous HDF studies and the values obtained in this paper.
Although we have attempted to put all the data from various studies into context, we emphasize that it is not straightforward to make direct comparisons because of different selection criteria and bar identification methods between these studies. These may be responsible for some of the observed differences. The main point to note is that in nearly every study, the data have shown a decline in the bar fraction, although the interpretations of the data have ranged from a constant bar fraction to a dramatic paucity of bars at z1. It is only with the COSMOS data set that we are able to robustly quantify the decline in the bar fraction and show that the evolution is a strong function of the galaxy luminosity, mass, color and bulge dominance.
5.2. Formation of the Hubble Sequence: Assembling the Spiral Galaxies
The declining bar fraction reported in this paper shows that at a lookback time of 7 Gyr () only about one-fifth of L∗ spiral galaxies were barred, which is about one-third the present day value. During the following 3 Gyr (from to ) the bar fraction increased to roughly its present value. Only small changes occurred in the last 4 Gyr (z0.3).
This evolution can be understood within the framework of classical bar formation theory. -body simulations have long suggested that bars form spontaneously in galactic disks, usually on relatively fast dynamical timescales. There are, however, two ways of slowing this down. One is to increase the halo mass fraction within the disk radius, and the other is to heat up the disk Athanassoula & Sellwood (1986). Self-consistent three-dimensional (3D) simulations essentially agree with this, although the role of the halo is now understood to be more complex, so that the final bar can be considerably stronger in cases where it grows slower Athanassoula (2002, 2003a). Thus, the time it takes for an unbarred disk galaxy to become barred can vary widely. In cold, disk-dominated cases, the bar forms within a Gyr or less, but sufficiently hot disks embedded in very massive halos can stay unbarred several Gyrs. Such a delay might well explain the time evolution of the barred galaxy fraction shown in Fig. 1. Furthermore, observations show that the halo-to-disk mass ratio is higher in low mass, low luminosity galaxies than in bright, massive galaxies (Bosma, 2004; Kranz et al., 2003) so that bars are expected to grow later in the former, as we indeed find here. Hence if galactic disks are formed with a variety of velocity dispersions and a variety of halo-to-disk mass ratios, there should be a continuous increase with time in the barred fraction, as observed here. The slope of this evolution will depend on the distribution of the initial disk and halo parameters. On the contrary, if all galaxy disks were, in the relevant time-period, similar, then the fraction of disk galaxies that are barred would be more or less constant with time, or show only a very small increase.
The preceding paragraphs assumed the existence of the appropriate set of physical conditions needed to form bars from the classical disk instability. Alternatively, bar formation may coincide with inner disk growth. This, however, would imply considerable growth of the inner disk even for z0.84, which seems inconsistent with recent results that show no evolution in the disk scale-lengths at z1 (Ravindranath et al., 2004; Barden et al., 2005; Sargent et al., 2007; Sheth et al., 2007b). A further point to take into consideration is that bars may dissolve when a gaseous component is included in the angular momentum exchange cycle, and/or in the presence of a sufficiently massive, centrally concentrated object, as e.g., a black hole (Friedli & Benz, 1993; Berentzen et al., 1998; Fukuda et al., 2000; Bournaud & Combes, 2002; Shen & Sellwood, 2004; Athanassoula, Lambert & Dehnen, 2005; Bournaud, Combes & Semelin, 2005). Observational evidence for bar dissolution, however, is at present rather sparse (Das et al., 2003; Block et al., 2002), while the amount of mass necessary seems to be larger than what is currently observed for central mass concentrations (Shen & Sellwood, 2004; Athanassoula, Lambert & Dehnen, 2005). Nevertheless, it is by no means clear that this mechanism is unimportant.
We have so far discussed only isolated galaxies. Let us now turn to the effect of interactions and mergings. The number of interactions are known to increase dramatically with redshift (e.g., Kartaltepe et al. 2007 and references therein). Interactions and merging activity are most likely to influence (heat up) the less massive galaxies. It is precisely in such galaxies that we see significantly lower bar fractions compared to the high mass galaxies at the highest redshifts (Figure 3, 4). Although indirect, there is observational evidence that later type and less massive systems are dynamically hotter. The top row of panels in Figure 1 of Kassin et al. (2007) clearly shows that late-type spirals and irregulars have larger disordered motions compared to early-type spirals particularly at high redshifts. These are precisely the type of systems within which we find fewer bars. Moreover, in the same figure, the higher mass galaxies also have a higher fraction of ordered motions than disordered motion, although the trend is hard to see in the relatively modest sample size in the high redshift bins. These data suggest that the lack of bars may therefore be related to the dynamic hotness and the mass surface density of these disks. We are currently identifying bars and measuring the bar fraction in this sample of galaxies and should be able to provide a direct answer for the said hypothesis (Sheth et al., in preparation).
Simulations show that interactions speed up bar formation in direct encounters, but have little effect in retrograde ones (Toomre & Toomre, 1972; Noguchi, 1987; Gerin, Combes & Athanassoula, 1990; Steinmetz & Navarro, 2002), in good agreement with observations (Kormendy & Norman, 1979; Elmegreen & Elmegreen, 1982). Thus one might have expected higher rates of bar formation at high , where interactions are common. On the contrary, it is possible for mergings to destroy or severely weaken the bar, without destroying the disk (e.g. Berentzen et al. 2003, and references therein). More modeling needs to be done before we can say with any certainty what the combined effect of interactions and mergings is. Note that we discarded from our statistics obviously interacting systems based on tidal features or obvious distortions. However, if a galaxy is weakly interacting, it would be difficult to distinguish it from a non-interacting system; this is already the case even in the local Universe. So our sample of galaxies is most likely probing quiescent, post-merger or weakly interacting disks.
5.3. The Downsizing Signature in Formation of Galactic Structure
Galaxy “downsizing” was coined by Cowie et al. (1996) to refer to an evolutionary history in which the most massive galaxies formed first. There is strong observational evidence for the downsizing phenomena: the presence of massive systems at high redshifts (e.g., Daddi et al. 2004, 2005; Scarlata et al. 2006, 2007), an order of magnitude decline in the typical star formation rate (Arnouts et al., 2005), a change in the star formation activity to lower mass systems with decreasing redshifts (Treu et al., 2005; Glazebrook et al., 2004; Fontana et al., 2004; Maier et al., 2005, 2006; Bundy et al., 2006), and the decrease in characteristic luminosity of active galactic nuclei at low redshifts (Pei, 1995; Ueda et al., 2003).
The results presented here show a downsizing signature in the formation of bars. The most massive, luminous and red galaxies have a higher bar fraction in the highest redshift bin with the most massive and luminous systems having a bar fraction close to the present-day value. The early presence of bars in these galaxies in the context of bar formation (§5.2) suggests that these systems “matured” early, i.e. they became dynamically cool and sufficiently massive to host bars at z 0.8. In contrast, the lower mass systems which are also bluer, acquired a majority of their bars at z0.8. Thus the downsizing phenomenon must be considered to be an effect more fundamental than one concerned solely with the regulation of ongoing star formation; it seems to be intimately connected with the dynamical maturity of the stellar disk.
5.4. The Co-Evolution of Bulges & Bars
Figure 5 shows that in our highest redshift bin there is a somewhat higher fraction of bars in galaxies with more massive bulges. This is consistent with the structural downsizing discussed in the previous section because galaxies with bulges are denser and more evolved in the center than galaxies without bulges. Bars and bulges apparently form at about the same time, with later times for lower mass galaxies. Some care is necessary in the interpretation of this result, however, since bulges are an inhomogeneous class of objects. In this paper, we defined the bulge as the component in the central part that contributes extra light above an extrapolated exponential fit to the outer part. This definition includes both classical (3D) bulges and disk-like pseudo-bulges (Kormendy & Kennicutt, 2004; Athanassoula, 2005). Pseudo-bulges form by gas inflow and star formation. Because bars drive inflow (Sheth et al., 2005; Sakamoto et al., 1999), there should be a correlation between disky bulges and bars, independent of dynamical downsizing. Bars may also contribute to the growth of nuclear black holes if they correlate with bulges, because there is a tight correlation between black hole mass, stellar velocity dispersion, and luminosity of bulges (Kormendy & Richstone, 1995; Magorrian et al., 1998; Ferrarese & Merritt, 2000). It will be interesting to test such differences with subsequent analysis of the bulges and bars in the COSMOS data.
6. Conclusions
Bars are an important signpost of galaxy evolution because once a galaxy disk is sufficiently massive, dynamically cold and rotationally supported it forms a bar. Therefore the evolution of the bar fraction over time is an important indicator of the evolutionary history of disk galaxies and the assembly of the Hubble sequence. Using a detailed analysis of 2,157 L∗ face-on, spiral galaxies from 0.0z0.84 in the COSMOS 2-square degree survey we have investigated the evolution of the bar fraction over the last 7 Gyr. We have undertaken an extensive and careful analysis of selection effects (k-correction, surface brightness dimming, inclination, spatial resolution, etc.) which is detailed in the Appendix. Our main results are as follows:
The bar fraction for L∗ galaxies drops from about 65% in the local Universe to about 20% at z=0.84. Over this redshift range the fraction of strong bars (SB) drops from about 30% to under 10%. Thus at a lookback time of 7 Gyr, when the Universe was half its present age, fundamental aspects of Hubble’s ‘tuning fork’ classification sequence had not yet fallen into place. Only about one fifth of all spiral galaxies were “mature” enough (dynamically cold, massive and rotationally supported) to host galactic structures of the type we see today.
For the total fbar (SB+SAB), the change is far less dramatic between z=0.3 and z=0.0 indicating slow evolution in galactic structures in L∗ galaxies over the last 4 Gyr. It is likely that there is significant evolution in the formation of bars in the sub-L∗ galaxies over this period.
One of the most significant findings in this study is the correlation between fbar and the galaxy mass, luminosity and color. We find that in the highest redshift bins fbar is higher in the more massive, luminous and redder systems. In fact, in the most massive systems, fbar is already as high at z=0.8 as the local value. These systems thus had already arrived with their present Hubble types at a lookback time of 7 Gyr. In the subsequent 3 Gyr, from z=0.84 to z=0.3, the lower mass, bluer systems evolved more slowly toward their present Hubble types. Thus the signature of downsizing is intimately connected with dynamical maturity of disks and is present in the formation of galactic structure.
Finally, we find a slight preference for barred galaxies to be more bulge-dominated in the high redshift bin. This correlation is consistent with the dynamical downsizing found for bars in general if bars and bulges both form earlier and more prominently in the most massive galaxies. The lack of a stronger correlation may be related to the variety of bulges: bars are also likely to be involved with the inflow that builds pseudo-bulges. Given the strong correlation between bulge properties and black hole mass seen today, there may be a co-evolution of bars, bulges and black holes in some galaxies. The exact details of these processes remain to be investigated.
References
- Abraham et al. (1996) Abraham, R. G., Tanvir, N. R., Santiago, B. X., Ellis, R. S., Glazebrook, K., van den Bergh, S. 1996, MNRAS, 279, L47
- Abraham et al. (1999) Abraham, R. G., Merrifield, M. R., Ellis, R. S., Tanvir, N. R., & Brinchmann, J. 1999, MNRAS, 308, 569
- Adelman-McCarthy et al. (2006) Adelman-McCarthy, J. K., et al. 2006, ApJ, 162, 38S
- Arnouts et al. (2005) Arnouts, S. et al., ApJ, 619, 43
- Athanassoula (1999) Athanassoula, E. 1999, in Astrophysical discs, eds. J. A. Sellwood & J. Goodman, (San Fransisco:ASP), 351
- Athanassoula (2002) Athanassoula, E. 2002, ApJ, 569, 83
- Athanassoula (2003a) Athanassoula, E. 2003a, MNRAS, 341, 1179
- Athanassoula (2003b) Athanassoula, E. 2003b, in IAU Symposium 208, Astrophysical supercomputing using particles, eds. J. Makino & P. Hut, (San Fransisco:ASP), 177
- Athanassoula (2005) Athanassoula, E. 2005, MNRAS, 358, 1477
- Athanassoula, Lambert & Dehnen (2005) Athanassoula, E., Lambert, J.C., Dehnen, W. 2005, MNRAS, 363, 496
- Athanassoula & Sellwood (1986) Athanassoula, E., Sellwood, J. A. 1986, MNRAS, 221, 213
- Barden et al. (2005) Barden, M., et al. 2005, ApJ, 635, 959
- Bell et al. (2005) Bell, E. F., et al. 2005, ApJ, 625, 23
- Berentzen et al. (1998) Berentzen, I., Heller, C. H., Shlosman, I., & Fricke, K. J. 1998, MNRAS, 300, 49
- Berentzen et al. (2003) Berentzen, I., Athanassoula, E., Heller, C., Fricke, K. 2003, MNRAS, 347, 220
- Blanton et al. (2003) Blanton, M. R. et al., 2003, AJ, 125, 2348
- Block et al. (2002) Block, D.L., Bournaud, F., Combes, F., Puerari, I., & Buta, R. 2002, A&ALetters, 394, 35
- Bosma (2004) Bosma, A. 2004, Dark Matter in Galaxies, 220, 39
- Bournaud, Combes & Semelin (2005) Bournaud, F., & Combes, F., Semelin, B. 2005, MNRAS, 364, L18
- Bournaud & Combes (2002) Bournaud, F., & Combes, F. 2002, A&A, 392, 83
- Bundy et al. (2006) Bundy, K., et al. 2006, ApJ, 651, 120
- Bunker (1999) Bunker, A.J. 1999, Photometric Redshifts and the Detection of High Redshift Galaxies, 191, 317
- Buta, Laurikainen & Salo (2004) Buta, R., Laurikainen, E., & Salo, H. 2004, AJ, 127, 279
- Buta et al. (2005) Buta, R., Vasylyev, S. Salo, H., & Laurikainen, E. 2005, AJ, 130, 506
- Capak (2003) Capak, P. 2003, Ph.D. Thesis, University of Hawaii
- Capak et al. (2007) Capak, P. et al. 2007, COSMOS Special Issue, ApJ, submitted
- Coleman et al. (1980) Coleman, G. D., Wu, C.-C., & Weedman, D. W. 1980, ApJS, 43, 393
- Cowie et al. (1996) Cowie, L. L., Songaila, A., Hu, E. M., & Cohen, J. G. 1996, AJ, 112, 839
- Daddi et al. (2005) Daddi, E., et al. 2005, ApJ, 631, L13
- Daddi et al. (2004) Daddi, E., et al. 2004, ApJ, 600, L127
- Das et al. (2003) Das, M., Vogel, S. N., Teuben, P. J., Regan, M. W., Sheth, K. , Harris, A. I., Jeffreys, W. H., 2003, ApJ, 582, 190
- De Vaucouleurs (1991) de Vaucouleurs, G., de Vaucouleurs, A., Corwin, H. G., Jr., Buta, R. J., Paturel, G., & Fouque, P. 1991, Third Reference Catalogue of Bright Galaxies (New York: Springer) (RC3)
- Elmegreen et al. (2007) Elmegreen, D. M., Elmegreen, B. G., Ravindranath, S., & Coe, D. A. 2007, ApJ, 658, 763
- Elmegreen & Elmegreen (1982) Elmegreen, D. M., & Elmegreen, B. G. 1982, MNRAS, 201, 1021
- Elmegreen & Elmegreen (2006) Elmegreen, D. M., & Elmegreen, B. G. 2006, ApJ, 651, 676
- Elmegreen et al. (2005c) Elmegreen, B. G., Elmegreen, D. M., Vollbach, D. R., Foster, E. R., & Ferguson, T. E. 2005, ApJ, 634, 101
- Elmegreen et al. (2005b) Elmegreen, D. M., Elmegreen, B. G., Rubin, D. S., & Schaffer, M. A. 2005, ApJ, 631, 85
- Elmegreen & Elmegreen (2005a) Elmegreen, B. G., & Elmegreen, D. M. 2005, ApJ, 627, 632
- Elmegreen, Elmegreen & Hirst (2004) Elmegreen, B. G., Elmegreen, D. M. 1985, & Hirst, A.C. 2004, ApJ, 612, 191
- Elmegreen et al. (1991) Elmegreen, D. M., Sundin, M., Sundelius, B., & Elmegreen, B. 1991, A&A, 244, 52
- Elmegreen & Elmegreen (1985) Elmegreen, B. G., & Elmegreen, D.M. 1985, ApJ, 288, 438
- Erwin (2005) Erwin, P. 2005, MNRAS, 364, 283
- Eskridge et al. (2000) Eskridge, P., et al. 2000,
- Eskridge et al. (2002) Eskridge, P., et al. 2002, ApJS, 143, 73
- Ferrarese & Merritt (2000) Ferrarese, L., & Merritt, D. 2000, ApJ, 539, L9
- Ferguson et al. (2004) Ferguson, H. C., et al. 2004, ApJ, 600, L107
- Fontana et al. (2004) Fontana, A., et al. 2004, A&A, 424, 23
- Friedli & Benz (1993) Friedli, D. & Benz, W. 1993, A&A, 268, 65
- Fukuda et al. (2000) Fukuda, H., Habe, A., & Wada, K. 2000, ApJ, 529, 109
- Gerin, Combes & Athanassoula (1990) Gerin, M., Combes, F., Athanassoula, E. 1990, A&A, 230, 37
- Giavalisco et al. (1996) Giavalisco, M., Livio, M., Bohlin, R. C., Macchetto, F. D., & Stecher, T. P. 1996, AJ, 112, 369
- Glazebrook et al. (2004) Glazebrook, K., et al. 2004, Nature, 430, 181
- Gunn et al. (1998) Gunn, J. E. et al., 1998, AJ 116, 3040
- Ilbert et al. (2006) Ilbert, O., et al. 2006, A&A, 453, 809
- Ilbert et al. (2007) Ilbert, O. et al. 2007, ApJ, in preparation
- Jogee et al. (2002) Jogee, S., Knapen, J. H., Laine,S., Shlosman, I., & Scoville, N. Z. 2002, ApJ, 570, 55
- Jogee et al. (2004) Jogee, S., et al. 2004, ApJ, 615, 105
- Kartaltepe et al. (2007) Kartaltepe, J. S., et al. 2007, ApJ, in press, ArXiv e-prints, 705, arXiv:0705.2266
- Kassin et al. (2007) Kassin, S. A., et al. 2007, ApJ, 660, L35
- Kinney et al. (1996) Kinney, A. L., Calzetti, D., Bohlin, R. C., McQuade, K., Storchi-Bergmann, T., & Schmitt, H. R. 1996, ApJ, 467, 38
- Knapen et al. (2000) Knapen, J. H., Shlosman, I., & Peletier, R. F. 2000, ApJ, 529, 93
- Kormendy & Norman (1979) Kormendy, J., Norman, 1979, ApJ, 233, 539
- Kormendy & Richstone (1995) Kormendy, J., & Richstone, D. 1995, ARA&A, 33, 581
- Kormendy & Kennicutt (2004) Kormendy, J., & Kennicutt, R. C., Jr. 2004, ARA&A, 42, 603
- Kranz et al. (2003) Kranz, T., Slyz, A., & Rix, H.-W. 2003, ApJ, 586, 143
- Laine et al. (2002) Laine, S., Shlosman, I., Knapen, J. H., & Peletier, R. F. 2002, ApJ, 567, 97
- Magorrian et al. (1998) Magorrian, J., et al. 1998, AJ, 115, 2285
- Maier et al. (2005) Maier, C., Lilly, S. J., Carollo, C. M., Stockton, A., & Brodwin, M. 2005, ApJ, 634, 849
- Maier et al. (2006) Maier, C., Lilly, S. J., Carollo, C. M., Meisenheimer, K., Hippelein, H., & Stockton, A. 2006, ApJ, 639, 858
- Maraston (2005) Maraston, C. 2005, MNRAS, 362, 799
- Marinova & Jogee (2007) Marinova, I., & Jogee, S. 2007, ApJ, 659, 1176
- Martin (1995) Martin, P. 1995, AJ, 109, 2428
- Menéndez-Delmestre et al. (2007) Menéndez-Delmestre, K., Sheth, K., Schinnerer, E., Jarrett, T. H., & Scoville, N. Z. 2007, ApJ, 657, 790
- Mobasher et al. (2007) Mobasher, B. et al. 2007, COSMOS Special Issue, ApJ, in press, astro-ph/0612344
- Nilson (1973) Nilson, P. 1973, Acta Universitatis Upsaliensis. Nova Acta Regiae Societatis Scientiarum Upsaliensis - Uppsala Astronomiska Observatoriums Annaler, Uppsala: Astronomiska Observatorium, 1973,
- Noguchi (1987) Noguchi, M. 1987, MNRAS, 228, 635
- Peng et al. (2002) Peng, C. Y., Ho, L. C., Impey, C. D., & Rix, H.-W. 2002, AJ, 124, 266
- Pei (1995) Pei, Y. C. 1995, ApJ, 438, 623
- Pfenniger (1991) Pfenniger, D. 1991, in Dynamics of Disc Galaxies, eds. B. Sundelius, (Gothenburg:Gothenburg University), 191
- Ravindranath et al. (2004) Ravindranath, S., et al. 2004, ApJ, 604, L9
- Regan & Elmegreen (1997) Regan, M. W., & Elmegreen, D. M. 1997, AJ, 114, 965
- Sakamoto et al. (1999) Sakamoto, K., Okumura, S. K., Ishizuki, S., Scoville, N. Z. 1999b, ApJ, 525, 691
- Sandage & Tammann (1987) Sandage, A., & Tammann, G. A. 1987, Carnegie Institution of Washington Publication, Washington: Carnegie Institution, 1987, 2nd ed.,
- Sargent et al. (2007) Sargent, M. T., et al. 2007, ApJ, in press, ArXiv Astrophysics e-prints, arXiv:astro-ph/0609042
- Scarlata et al. (2006) Scarlata, C., et al. 2006, ApJ, in press, ArXiv Astrophysics e-prints, arXiv:astro-ph/0611644
- Scarlata et al. (2007) Scarlata, C., et al. 2007, ApJ, in press, ArXiv Astrophysics e-prints, arXiv:astro-ph/0701746
- Sérsic & Pastoriza (1967) Sérsic, J. L. & Pastoriza, M. 1967, PASP, 79, 152
- Scoville et al. (2007a) Scoville, N.Z. et al. 2007a, COSMOS Special Issue, ApJ, in press, astro-ph/0612305
- Scoville et al. (2007b) Scoville, N.Z. et al. 2007b, COSMOS Special Issue, ApJ, in press, astro-ph/0612306
- Scoville et al. (2006b) Scoville, N.Z. et al. 2006b, COSMOS Special Issue, ApJ, in press, astro-ph/0612384
- Shen & Sellwood (2004) Shen, J., Sellwood, J.A., ApJ, 604, 614
- Sheth et al. (2000) Sheth, K., Regan, M.W., Vogel, S.N., & Teuben, P.J. 2000 ApJ, 532, 221
- Sheth et al. (2002) Sheth, K., Vogel, S.N., Regan, M.W., Teuben, P.J., Harris, A.I., & Thornley, M.D. 2002, AJ, 124, 2518
- Sheth et al. (2003) Sheth, K., Regan, M.W., Scoville, N.Z., & Strubbe, L.E. 2003, ApJ, 592, 13
- Sheth et al. (2005) Sheth, K., Vogel, S. N., Regan, M. W., Teuben, P.J., Harris, A. I., Thornley, M. D., & Helfer, T.T. 2003, ApJ, 632, 217
- Sheth et al. (2007b) Sheth, K. et al., ApJ, in preparation
- Shlosman et al. (2007) Shlosman, I., et al., 2007, Nature, in preparation.
- Steinmetz & Navarro (2002) Steinmetz, M., & Navarro, J. F. 2002, New Astronomy, 7, 155
- Toomre & Toomre (1972) Toomre, A., Toomre J. 1972 ApJ, 178, 623
- Treu et al. (2005) Treu, T., Ellis, R. S., Liao, T. X., & van Dokkum, P. G. 2005, ApJ, 622, L5
- Ueda et al. (2003) Ueda, Y., Akiyama, M., Ohta, K., & Miyaji, T. 2003, ApJ, 598, 886
- van den Bergh et al. (1996) van den Bergh, S., Abraham, R. G., Ellis, R.S., Tanvir, N. R., Santiago, B., & Glazebrook, K. G. 1996, AJ, 112, 359
- West et al. (2007) West, A. A., Garcia-Appadoo, D. A., Dalcanton, J. J., Disney, M. J., Rockosi, C. M., Ivezic, Z. & Bentz, M. C. 2007, AJ, submitted
- Whyte et al. (2002) Whyte, L. F., Abraham, R. G., Merrifield, M. R., Eskridge, P. B., Frogel, J. A., & Pogge, R. W. 2002, MNRAS, 336, 1281
- York et al. (2000) York, D. G., et al. 2000, AJ, 120, 1579
Appendices
Appendix A ANALYSIS OF SELECTION EFFECTS
Although we have carefully chosen a robust sample of galaxies, used multiple methods for identifying bars and analyzed a sample of local SDSS galaxies in the same manner as the COSMOS galaxies (§2), our results are in contradiction to some previous studies. Therefore we do additional investigation of the remaining possible selection effects (cosmological / surface brightness dimming and spatial resolution), which might produce a declining bar fraction.
A.1. K-Corrections and the Effects of Bandshifting
The ACS data for COSMOS utilizes the broad F814W filter which traces different rest-frame wavelengths at different redshifts. As a result it is imperative to understand the effects of k-correction (bandshifting) and correct them as necessary. To quantify the effects of k-correction on the identification of bars, we examined a local sample of 139 galaxies in all five Sloan bands (u,g,r,i and z). We selected nearby ( 100 Mpc), face-on (b/a 0.58), large (a 90% radius 2 kpc) and bright (MB -19.7, MB estimated from colors and -band magnitudes Blanton et al. 2003) spiral galaxies from the Sloan Digital Sky Survey (SDSS) (York et al., 2000; Gunn et al., 1998) Data Release 4 (Adelman-McCarthy et al., 2006). The data were mosaicked and calibrated using the methods described by West et al. (2007).

We used the same bar identification methods (ellipse fitting & visual classification, §3) for the SDSS data as for the COSMOS data and measured the bar fraction in each band. The results are shown in Figure 7. The bar fraction is unchanged from the z-band to the g-band at f0.6. This is consistent with a number of previous studies (e.g., Menéndez-Delmestre et al. 2007; Eskridge et al. 2002; Whyte et al. 2002) that have shown that the overall bar fraction does not change appreciably between the optical and near-infrared bands. This figure also demonstrates that the shifting rest-wavelength of observation in our sample does not bias our measurements of the bar fraction, provided we restrict the maximum redshift of our sample appropriately.
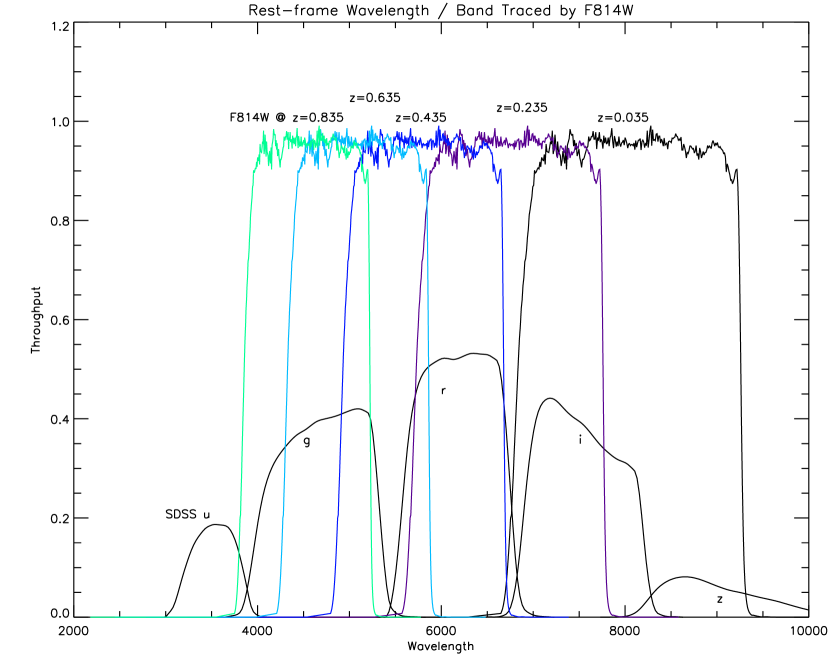
The maximum redshift chosen is important, because Figure 7 shows that the SDSS bar fraction does appear to decline markedly in the u-band. At this wavelength, in a majority of cases, the ellipse fitting technique fails completely. This is not unexpected, and a component of this decline may find its origin in the relatively poor signal-to-noise of the SDSS u-band data. However, we suspect that the bulk of this decline is real. Bars are primarily stellar structures and some become significantly fainter and sometimes disappear altogether short wards of the Balmer break. A dramatic example of this is shown for the nearby strongly barred spiral NGC 4303 in Figure 1 of Sheth et al. (2003). This is further justification for our chosen limiting redshift in this paper, because by restricting our sample to , the F814W filter does not probe bluer than rest-frame g-band, as shown in Figure 8.
A.2. Objects with Peculiar Morphology

We considered the possibility that the bar fraction may be incorrectly measured at high redshifts due to the presence of a more exotic variety of morphologies that have been observed at high redshifts. Elmegreen et al. (2007); Elmegreen & Elmegreen (2006, 2005a); Elmegreen et al. (2005b, c) have identified clump-cluster, compact, and chain galaxies at high redshifts which do not have counterparts in the local Universe. Could the fbar be artificially lower because we are including more of these objects in the total sample at the higher redshifts? As noted earlier, this is not the case for the visual classification method for which these objects were already excluded. We specifically exclude these objects for the ElPa classification method and recompute the evolution of the bar fraction. The results are shown in Figure 9. The drop in the bar fraction in this revised sample is less steep as expected. fbar drops to 0.280.2 at z=0.835, and fSB drops to 0.120.02. Both methods of classifying bars thus show declines of 50% in the bar fraction from the present day to z=0.835.
A.3. Cosmological Surface Brightness Dimming
Surface brightness dimming is critical even at z 1 because it evolves so strongly with redshift (). The measurement of the bar fraction may be affected if the data are too shallow because as the disk of the galaxy fades the bar, which usually has a higher mean surface brightness, may remain visible and therefore be misclassified as an inclined spiral (e.g., Jogee et al. 2002). To investigate this possibility we investigated the ability of the COSMOS data (and a few other surveys) to trace an outer disk (several times the typical bar semi-major axis) isophote as a function of redshift.
The median bar semi-major axis measured from the 2MASS Large Galaxy Atlas survey is abar=4.22.9 kpc and relative size is abar / R25 = 0.290.17 (Menéndez-Delmestre et al., 2007), where R25 is the classic 25 magnitude arcsec-2 isophote in the B-band. Thus the R25 radius is at least three times larger than a typical bar. In the outer regions of a galaxy, B-I = 1.5. So the corresponding limiting I-band isophote is at = 23.5. An isophote a full magnitude fainter (=24.5 magnitudes arcsec-2) can therefore be safely considered to be an outer disk isophote.
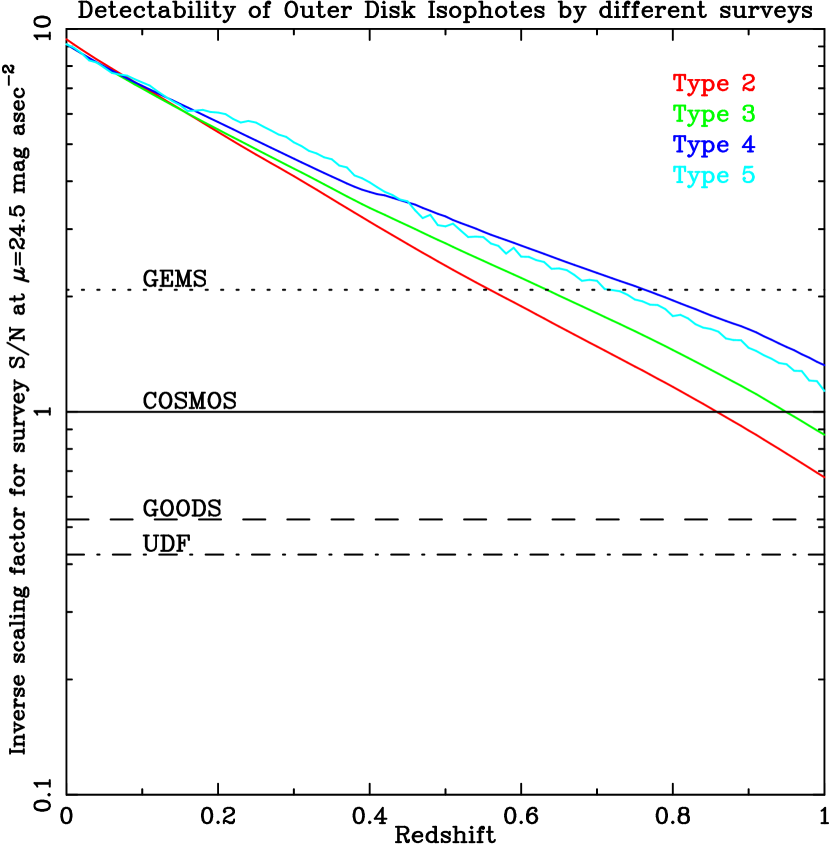
In Figure 10 we show the noise to signal value reached for a =24.5 magnitudes arcsec-2 isophote fading due to cosmological surface brightness dimming. The differently colored lines are for the different SED types. It is clear from this figure that COSMOS, GOODS, HDF and UDF are sufficiently deep to allow one to detect the outer edges of a typical L∗ disk to z1. This is not the case for the shallower GEMS data which are unable to quantify the outer disk isophotes for L∗ galaxies at z 0.5.
In this calculation we assume that the disks have evolved passively from z=1 to the present, when in fact there is a magnitude of luminosity evolution in disks from the increased star formation rate. Therefore choosing a luminosity evolution in the sample selection criteria, as we have done for the COSMOS data, further improves the signal to noise and ability to confidently trace the outermost disk isophotes with redshift. Based on this analysis we are confident that disk dimming is not responsible for the observed decline in the bar fraction with redshift in the COSMOS data.
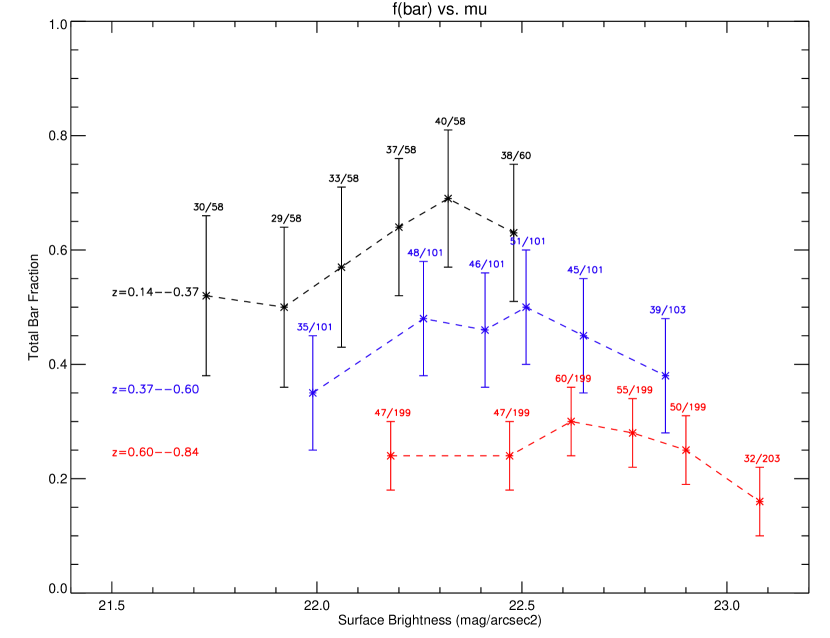
We further tested the effects of surface brightness dimming on the data with a second empirical check by comparing the bar fraction as a function of the observed surface brightness of the disks in each redshift bin. This test is shown in Figure 11. If indeed surface brightness dimming was responsible for a decline in the bar fraction and we were preferentially classifying lower surface brightness disks as unbarred, we should see a correlation of fbar with . We see no trends in the bar fraction with in any redshift bin. Thus we conclude that the observed evolution of the bar fraction shown in Figure 1 is not due to cosmological surface brightness dimming of the disks.
A.4. Spatial Resolution and the Bar Fraction
One possibility for the observed decline in the bar fraction could be that we are preferentially missing small bars at higher redshifts. As already noted earlier, (and as shown in Figure 3 of Sheth et al. 2003) ACS resolution (1 pixel = 005 = 0.38 kpc at z=0.835) is adequate for identifying all bars larger than 2 kpc at all z0.835. Bars smaller than this, at least in the local Universe, are nuclear bars and not the primary bars that we are concerned with in this paper. Very small bars in late type galaxies have been measured by Erwin (2005) in a local sample but it is unclear whether these galaxies are comparable to the large, L∗ and brighter galaxies being examined in our sample. For L∗ galaxies, there is substantial evidence that the size of galaxy disks does not change significantly to z1. For the COSMOS sample, the median disk scale length is unchanged over the redshift range under investigation, consistent with similar results found previously (Ravindranath et al., 2004; Barden et al., 2005; Sargent et al., 2007). Given that the bar semi-major axis is typically 0.3R25, the lack of a change in disk sizes also indicates that it is unlikely that bars change their sizes significantly as a function of redshift.
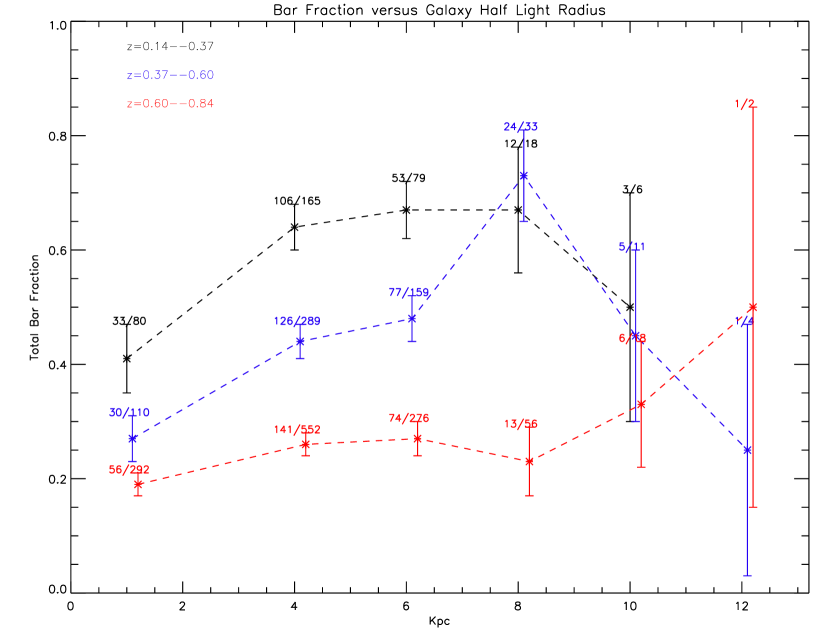
As another check we decided to see if the measurement of the bar fraction was affected by the size of galaxies in a given redshift bin. If the bar fraction was indeed declining because of smaller galaxy disks with unresolved bars, one would expect to see a decreasing fbar with smaller disks and this effect would be most pronounced at higher redshifts where the linear resolution of the ACS data is the coarsest. When we plot fbar versus the half light radius of galaxies in different redshift bins in Figure 12, we find no significant correlation between the bar fraction and the size of the disk in any of the redshift bins. There is a slight decline in the bar fraction for the smallest galaxies. This reflects the finding that bars are less frequent in less massive systems and not a selection effect. The result is the same when considering only fSB, or using the exponential scale length for an estimate of the galaxy disk size. We therefore conclude that there is not a preferential loss of bars in disks of any particular size at any redshift in this study.
Appendix B Artificially Redshifting Galaxies
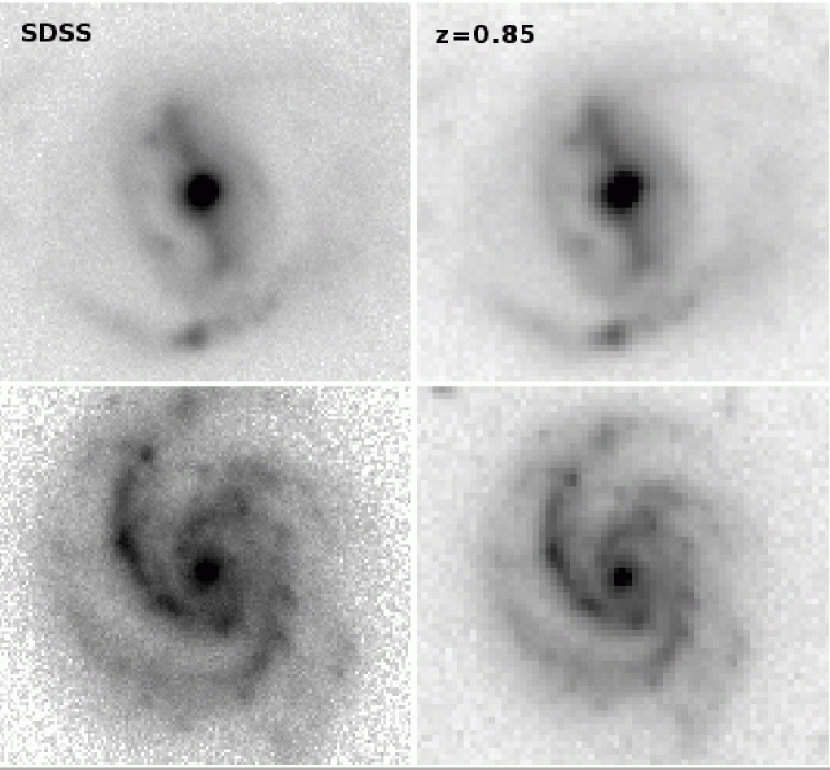
The above sections have addressed most of the classical selection effects that plague high redshift studies, namely k-correction, resolution, surface brightness dimming, etc. To conclusively test all of these effects we artificially redshifted the g-band images of all 139 SDSS galaxies to z=0.84 following the technique outlined in Giavalisco et al. (1996). We redshifted the galaxies to the F814W filter, rebinned the image, took into account surface brightness dimming and matched the noise characteristics of our ACS data. Examples of the artificially redshifted galaxies are shown in Figure 13. We re-classified these images into strongly barred, weakly barred and unbarred spirals as we had done before. In 127/139 galaxies the classification remained unchanged. Of the remaining twelve galaxies, seven are now classified as weakly barred in these images compared to the original SDSS images where they were classified as unbarred. Four galaxies classified previously as weakly barred are now classified as unbarred. And one galaxy that was classified as strongly barred is now classified as an unbarred spiral. So overall the bar fraction did not change appreciably (original SDSS images fbar=0.59, artificially redshifted SDSS images fbar=0.60). These results are remarkable but not unexpected and reflect the exquisite sensitivity of the ACS survey, which was designed to be as deep at z=1 as the SDSS survey is locally.
| zLaa zL: Lower limit of redshift bin | zUbb zU: Upper limit of redshift bin | Nbincc Nbin: Total number of spiral galaxies in bin | SPbindd SPbin: Number of galaxies classified as unbarred in bin | WBbinee WBbin: Number of galaxies classified as weak bars (SAB) in bin | SBbinff SBbin: Number of galaxies classified as strong bars (SB) in bin | fbargg fbar = WBbin SBbin / Nbin | 1ii Error assuming binomial statistics. 1=), where f is fbar or fSB | fSBhh fSB = SBbin / Nbin | 1ii Error assuming binomial statistics. 1=), where f is fbar or fSB |
|---|---|---|---|---|---|---|---|---|---|
| Visual Classification | |||||||||
| SDSS-i | 0.00 | 139 | 57 | 23 | 59 | 0.59 | 0.04 | 0.42 | 0.04 |
| 0.14 | 0.26 | 75 | 30 | 19 | 26 | 0.60 | 0.06 | 0.35 | 0.05 |
| 0.26 | 0.37 | 243 | 108 | 63 | 72 | 0.56 | 0.03 | 0.30 | 0.03 |
| 0.37 | 0.49 | 254 | 136 | 46 | 72 | 0.46 | 0.03 | 0.28 | 0.03 |
| 0.49 | 0.61 | 265 | 161 | 52 | 52 | 0.39 | 0.03 | 0.20 | 0.02 |
| 0.61 | 0.72 | 504 | 336 | 78 | 90 | 0.33 | 0.02 | 0.18 | 0.02 |
| 0.72 | 0.84 | 364 | 251 | 50 | 63 | 0.31 | 0.02 | 0.17 | 0.02 |
| Ellipse/PA Classification | |||||||||
| SDDS-i | 0.00 | 139 | 57 | 26 | 56 | 0.59 | 0.04 | 0.41 | 0.04 |
| 0.14 | 0.26 | 83 | 29 | 32 | 22 | 0.65 | 0.05 | 0.27 | 0.05 |
| 0.26 | 0.37 | 267 | 114 | 84 | 69 | 0.57 | 0.03 | 0.26 | 0.03 |
| 0.37 | 0.49 | 282 | 134 | 85 | 63 | 0.52 | 0.03 | 0.22 | 0.02 |
| 0.49 | 0.61 | 326 | 210 | 68 | 48 | 0.36 | 0.03 | 0.15 | 0.02 |
| 0.61 | 0.72 | 668 | 495 | 97 | 76 | 0.26 | 0.02 | 0.11 | 0.01 |
| 0.72 | 0.84 | 530 | 412 | 71 | 47 | 0.22 | 0.02 | 0.09 | 0.01 |