Department of Astronomy, Harvard University, 60 Garden St, MS-10, Cambridge, MA, 02138, USA; cgiguere@cfa.harvard.edu. Department of Astronomy and Astrophysics, UCO/Lick Observatory; University of California, 1156 High Street, Santa Cruz, CA, 95064, USA. \PACSes\PACSit98.62.Ra, 98.54.Aj, 98.80.EsIntergalactic opacity, Ly forest, quasars
A Direct Precision Measurement of the Intergalactic Lyman- Opacity at ††thanks: Some of the data presented herein were obtained at the W.M. Keck Observatory, which is operated as a scientific partnership among the California Institute of Technology, the University of California and the National Aeronautics and Space Administration. The Observatory was made possible by the generous financial support of the W.M. Keck Foundation. Other data analyzed in this work were gathered with the 6.5 meter Magellan Telescopes located at Las Campanas Observatory, Chile.
Abstract
We directly measure the evolution of the intergalactic Lyman- effective optical depth, , over the redshift range from a sample of 86 high-resolution, high-signal-to-noise quasar spectra obtained with Keck/ESI, Keck/HIRES, and Magellan/MIKE. We find that our estimates of the quasar continuum levels in the Ly forest obtained by spline fitting are systematically biased low, but that this bias can be accounted for using mock spectra. The mean fractional error is at , 4% at , and 12% at . We provide estimates of the level of absorption arising from metals in the Ly forest based on both direct and statistical metal removal results in the literature, finding that this contribution is at and decreases monotonically with redshift. The high precision of our measurement indicates significant departures from the best-fit power-law redshift evolution, particularly near .
1 INTRODUCTION
The evolution of the intergalactic medium (IGM) as traced by the Ly forest provides a powerful record of the thermal and radiative history of the Universe.
This power owes to our ability to measure the Ly opacity of the
IGM as a function of redshift, as well as to the relatively simple physics of the Ly forest.
In fact, cosmological simulations in which the forest arises from absorption by smooth density fluctuations imposed on the warm photoionized IGM as a natural consequence of hierarchical structure formation within cold dark matter models (e.g., 1996ApJ…457L..51H, ), have been remarkably successful at reproducing the properties of the absorption observed in actual quasar spectra.
This synergy between theory and observations make the Ly forest a particularly compelling probe of the diffuse Universe.
In this work, we present a direct precision measurement of the effective Ly optical depth and its evolution over the redshift range from a sample of 86 high-resolution, high signal-to-noise quasar spectra obtained obtained with Keck/ESI (16), Keck/HIRES (44), and with Magellan/MIKE (26).
The full details have been reported in (2007arXiv0709.2382F, ).
We assume a cosmology with (2007ApJS..170..377S, ).
2 ANALYSIS
2.1 Method
Let be a quasar’s absolute flux and be its continuum (unabsorbed) level as a function of observed wavelength . The corresponding redshift of Ly absorption is just , where Å. Dropping the Ly subscript on , we define the transmission as . Letting be the ensemble average over lines of sight, the effective optical depth is defined as The measurement consists of the following steps:
-
1.
Estimate the continuum level in the Ly forest of each quasar spectrum by fitting a cubic spline through its transmission peaks and calculate the corresponding ;
-
2.
apply masks to the data: quasar proximity regions, higher-order Lyman series forests, SLLS, DLAs, and associated metal lines;
-
3.
bin the remaining Ly forest pixels in redshift intervals;
-
4.
for each redshift bin, average the pixels to estimate and calculate ;
-
5.
correct this “raw” measurement for redshift-dependent continuum estimation error and, optionally, for metal absorption.
2.2 Continuum Correction
As the redshift increases, the IGM density increases and, as a result, the transmission peaks reaching unity become increasingly rare, causing us to underestimate the continuum level more at higher redshifts. Mock spectra, with continua blindly estimated following the same procedure as with the actual data, are used to quantify the mean fractional difference between the true and estimated continua, (where ), as function of redshift. We find that, for hydrogen background photoionization rates taken from the literature, over the redshift range . This continuum correction, however, itself is subject to some systematic bias – since it depends on assumptions (particularly regarding ) used to generate the mock spectra - which is unaccounted for in our statistical error bars.
2.3 Metal Absorption
Metals also contribute to the total absorption in the Ly forest. In general, , where arises purely from Ly absorption and is due to metal . Based on the published results of 2003ApJ…596..768S and 2005MNRAS.360.1373K , we find that metals make up of at .
3 RESULTS
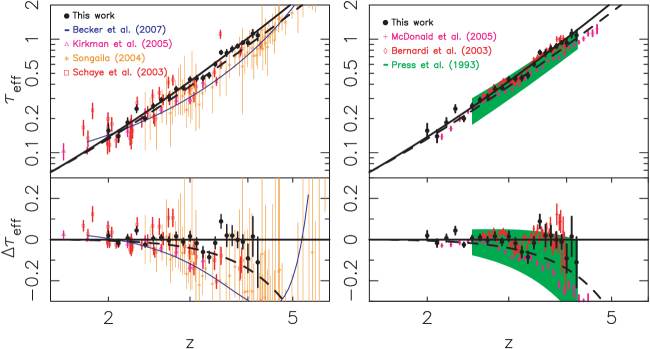
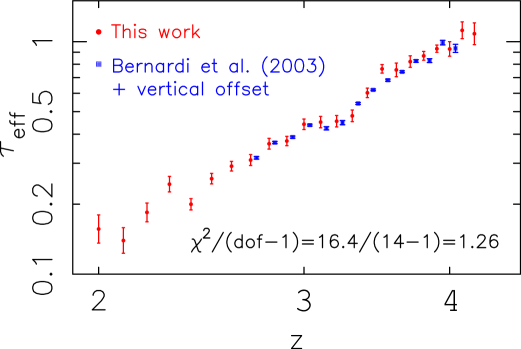
In Figure 1, we compare our measurements with previously published measurements. Our measurement corrected for continuum bias is seen to trace the SDSS statistical measurement of 2003AJ….125…32B , who have first claimed detection of a feature at , remarkably well.
Acknowledgements.
CAFG is supported by a NSERC Postgraduate Fellowship. JXP is supported by an NSF CAREER grant (AST-0548180) and by NSF grant AST-0709235. This work was further supported in part by NSF grants ACI 96-19019, AST 00-71019, AST 02-06299, AST 03-07690, and AST 05-06556, and NASA ATP grants NAG5-12140, NAG5-13292, NAG5-13381, and NNG-05GJ40G. Additional support was provided by the David and Lucile Packard, the Alfred P. Sloan, and the John D. and Catherine T. MacArthur Foundations.References
- (1) \NAMEHernquist L., Katz N., Weinberg D. H. \atqueMiralda-Escudé J., \INApJ4571996L51+.
- (2) \NAMEFaucher-Giguere C. ., Prochaska J. X., Lidz A., Hernquist L. \atqueZaldarriaga M., \INArXiv e-prints 7092007.
- (3) \NAMESpergel D. N., Bean R., Doré O. \atque…, \INApJS1702007377.
- (4) \NAMESchaye J., Aguirre A., Kim T.-S., Theuns T., Rauch M. \atqueSargent W. L. W., \INApJ5962003768.
- (5) \NAMEKirkman D., Tytler D., Suzuki N., Melis C., Hollywood S., James K., So G., Lubin D., Jena T., Norman M. L. \atquePaschos P., \INMNRAS36020051373.
- (6) \NAMESongaila A., \INAJ12720042598.
- (7) \NAMEBecker G. D., Rauch M. \atqueSargent W. L. W., \INApJ662200772.
- (8) \NAMEPress W. H. \atqueRybicki G. B., \INApJ4181993585.
- (9) \NAMEBernardi M., Sheth R. K., SubbaRao M. \atque…, \INAJ125200332.
- (10) \NAMEMcDonald P., Seljak U., Cen R. \atque…, \INApJ6352005761.