Giant Radio Galaxies as a probe of the cosmological evolution of the IGM, I. Preliminary deep detections and low-resolution spectroscopy with the SALT
J. Machalski1, D. Kozieł-Wierzbowska1, M. Jamrozy1
1 Obserwatorium Astronomiczne, Uniwersytet Jagielloński,
ul. Orla 171, 30-244, Kraków, Poland
(machalsk@oa.uj.edu.pl, eddie@oa.uj.edu.pl, jamrozy@oa.uj.edu.pl) Abstract
A problem of the cosmological evolution of the IGM is recalled and a necessity to find distant () “giant” radio galaxies (GRGs) with the lobe energy densities lower than about J m-3 to solve this problem is emphasized. Therefore we undertake a search for such GRGs on the southern sky hemisphere using the SALT. In this paper we present a selected sample of the GRG candidates and the first deep detections of distant host galaxies, as well as the low-resolution spectra of the galaxies identified on the DSS frames. The data collected during the Performance Verification (P–V) phase show that 21 of 35 galaxies with the spectroscopic redshift have the projected linear size greater than 1 Mpc (for =71 km s-1Mpc-1). However their redshifts do not exceed the value of 0.4 and the energy density in only two of them is less than J m-3. A photometric redshift estimate of one of them (J14200545) suggests a linear extent larger than 4.8 Mpc, i.e. a larger than that of 3C236, the largest GRG known up to now.
Key words: Galaxies:active – Galaxies:interactions – Galaxies: intergalactic medium
1. Introduction
In the adiabatically expanding Universe filled with a hot, diffuse and uniform IGM, the IGM pressure should increase with redshift as , where is the present-day pressure (cf. Subrahmanyan & Saripalli 1993). Various methods have been employed in determining the density and pressure of the IGM. The most effective are X-ray observations of the hot gas around radio sources of Fanaroff-Riley type II (FRII) yielding direct estimates of the gas density (Crawford et al. 1999; Hardcastle et al. 2002; Croston et al. 2004, 2005). Assuming an equation of state of this gas, a value of can be specified. However, both the AGN and the large-scale radio structure likely contribute to the X-ray emission (cf. Kaiser & Alexander 1999), thus the properties of the environment may be considerably influenced by the presence of the radio source itself. As the IGM forms the environment of the radio source, the internal physical properties of its diffuse lobes were expected to reflect directly . However, the cosmic background measurements (e.g. with COBE) ruled out an IGM with the pressure indicated by typical radio structures. This suggested that these regions were not thermally confined. Indeed, the very existence of apparent hot spots at the edges of double FRII-type radio sources indicates that the jets ejected from the AGN encounter resistance to their propagation, and these advancing hot spots are likely confined by ram-pressure of the IGM. But the more tenuous material, outside the jets, forming a bridge between the nucleus and the radio lobes is expected to have attained an equilibrium state in which the energy density of the particles and magnetic field is balanced, and the pressure of the relativistic plasma equals the pressure of the gaseous environment. Consequently, a determination of physical conditions in these diffuse bridges of large-size double radio sources (being away from the ram-pressure confined the source heads) gives an independent tool of probing the pressure of the IGM.
This physical conditions, specifically the internal pressure, can be determined from the dynamical considerations. In the analytical model of the source dynamics of Kaiser & Alexander (1997) and its further modifications (e.g. Blundell et al. 1999) the pressure is dependent on the gas density, power of the jet, and age of the radio structure. As a certain determination of these parameters is not easy, the internal pressure is usually estimated from the minimum energy condition corresponding to an equipartition of energy between the relativistic particles and the magnetic field. The minimum energy can be calculated from the total luminosity and the size (volume) of a given radio source (e.g. Pacholczyk 1970; Miley 1980). The largest extragalactic radio sources (D1 Mpc, frequently called Giants or Giant Radio Galaxies [GRGs] though a small fraction of them are classified as QSOs), due to their very extended radio lobes and sometime bridges linking the opposite lobes, offer a unique probe the intergalactic and intracluster environment directly on Mpc scales allowing measurements of the IGM structure, pressure and their evolution out to high redshifts (cf. Strom & Willis 1980; Subrahmanyan & Saripalli 1993; Mack et al. 1998).
Subrahmanyan & Saripalli (1993) contended that the lower and upper limit values of the present-day IGM pressure are 0.5 and 210-15 N m-2, respectively, but further investigations raised those values at least twice (e.g. Ishwara-Chandra & Saikia (1999). The problem of the cosmic pressure evolution was also considered by Schoenmakers et al. (2000) who found no evidence for such a strong evolution up to the redshift of about 0.3. They concluded the apparent pressure increase with redshift can be explained by two effects: the use of flux-limited samples and the method by which the lobe pressure is calculated. The latter aspect is discussed more in details in Section 6. Therefore, in order to verify the hypothesis about the IGM pressure evolution concordant with , it is necessary to find GRGs with the lobe energy densities of J m-3 at redshifts higher than about 0.5. The project how to do that and the selected sample of GRG candidates are presented in Section 2. The imaging and spectroscopic observations conducting either with the SALT or with the 1.9m SAAO telescope are described in Sections 3 and 4. Preliminary physical and geometrical parameters of the sample sources are determined in Section 5, while the equipartition energy density in their lobes (proportional to an internal lobe pressure) vs. the sources’ redshift and morphology of the GRGs vs. properties of the environment are analyzed in Section 6.
2. High-redshift GRGs and description of the project
Since majority of known GRGs are at rather low redshifts (z0.25), it was long presumed that giants did not exist at significantly higher redshifts, especially because both the median and maximum source size were suggested to decrease as fast as (e.g. Gopal-Krishna & Wiita 1987). Such a result could be explained by systematic increase of density of an uniform IGM confining the source size. Contrary, high-redshift GRGs might be tracers of relatively low density regions, not fully virialized yet, existing at early cosmological epochs. Unfortunately, unbiased samples of GRGs are very difficult to assemble because of surface-brightness selection effects. At high redshifts, the diffused bridges of emission are likely to be significantly influenced by the inverse-Compton losses against the cosmic background, which would affect the appearance and identification of a GRG at these redshifts.
The first attempt to discover GRGs at was made by Cotter et al. (1996) who used the 7C radio survey to select Giant candidates and found 13 large double radio sources at redshifts up to 0.9, 4 of them with 1 Mpc. A further few distant GRGs were found by Schoenmakers et al. (1998) proving that such sources do exist at least out to 1. In Table 1 (below) we assemble all known Giants with 0.5 and 1 Mpc (calculated with the cosmological parameters: =71 km s-1Mpc-1, =0.27, and =0.73. This is worth emphasizing that only two sources in Table 1 have negative declinations.
| IAU name | Survey | z | R | log P1.4 | D | Id. | |
|---|---|---|---|---|---|---|---|
| [”] | [mag] | [W Hz-1] | [kpc] | ||||
| B0437-244 | PKS | 0.84 | 127 | 27.17 | 960 | QSO | |
| B0654+482 | 7C | 0.776 | 135 | 21.9 | 26.39 | 1002 | |
| J0750+656 | 0.747 | 220 | 26.40 | 1606 | QSO | ||
| B0821+695 | 8C | 0.538 | 408 | 20.5 | 26.25 | 2576 | |
| B0854+399 | B2 | 0.528 | 166 | 26.71 | 1038 | ||
| B1058+368 | 7C | 0.750 | 150 | 21.3 | 26.53 | 1100 | |
| B1127-130 | PKS | 0.634 | 290 | 16.0 | 27.26 | 2033 | QSO |
| B1349+647 | 3C292 | 0.71 | 134 | 21.1 | 27.62 | 960 | |
| B1429+160 | MC3 | 1.005 | 167 | 26.88 | 1346 | QSO | |
| B1602+376 | 7C | 0.814 | 182 | 20 | 26.59 | 1376 | |
| B1636+418 | 7C | 0.867 | 130 | 20 | 26.49 | 1004 | |
| B1834+620 | WNB | 0.519 | 220 | 26.89 | 1364 | ||
| J1951+706 | 0.550 | 204 | 26.07 | 1300 |
In this project we attempt to enlarge significantly the above sample with high-redshift GRGs on the southern hemisphere, and provide data sufficient to enlighten the problem of the IGM pressure evolution with redshift. For this purpose we selected a large sample of GRG candidates using the existing 1.4 GHz radio surveys: FIRST (Becker et al. 1995) and NVSS (Condon et al. 1998). These surveys, which provide radio maps of the sky made with two different angular resolutions (5” and 45”, respectively) at the same observing frequency, allow (i) an effective removal of confusing sources, (ii) a reliable determination of the sources’ morphological type, and in many cases (iii) a determination of the compact core component necessary for the proper identification of the source with its host optical object.
In order to use a possibility of all-season optical observations with the SALT, the entire sample consists of two parts (subsamples) located on the northern and southern Galactic hemispheres:
(NGH) lying between ;
-14Dec(J2000), and
(SGH) lying between ;
-14Dec(J2000).
Thus, an advance of the project is a uniform distribution of the targets along hour angle enabling consecutive collection of their images and spectra. A crude estimate of the source’s redshift can be made from the Hubble diagram for GRGs published by Schoenmakers et al. (1998). At =0.5 it gives 20 mag (the apparent magnitudes in Table 1 confirm this). On the other hand, a source with the linear projected size of 1 Mpc at =0.5 will have an angular size of about 165”. Therefore the GRG candidates were chosen to fulfill the following selection criteria: they have
(1) the morphological type of FRII,
(2) an angular separation between the brightest regions on the maps ”,
(3) 1.4-GHz flux density on the NVSS map 50 mJy in the NGH subsample,
and 40 mJy in the SGH subsample, and
(4) is optically identified with an object fainter than 20 mag in the -band.
The above criteria selected rather small number of high-redshift GRG candidates, especially in the NGH subsample. Therefore in both subsamples we include also other radio source candidates with host galaxies brighter than 20() mag which will be analyzed as comparison closer GRGs. The optical spectroscopy of these latter sources can be conducted with smaller telescopes. In Table 2 we list numbers of the GRG candidates in both subsamples. The observational data on 34 of 39 radio sources in the subsample NGH and 12 of 41 in the subsample SGH, i.e. those for which preliminary physical parameters could be determined using the data collected during the P-V phase, are given in Table 3. The consecutive columns of Table 3 give:
Col. 1: IAU name at epoch J2000;
Col. 2: Fanaroff-Riley morphological type. “D” indicates a diffuse morphology of the radio
lobes without any detectable hot spot(s);
Col. 3: 1.4 GHz total flux density in mJy from the NVSS survey;
Col. 4: radio spectral index between 1.4 and 4.9 GHz;
Col. 5: 1.4 GHz flux density of the radio core from the FIRST survey;
Col. 6: largest angular size in arcsec;
Col. 7: optical identification. “G” - galaxy, “Q” - quasar;
Col. 8: its apparent R-band magnitude from the DSS data base;
Col. 9: redshift. A value in parenthesis is the photometric redshift estimate calculated
from the log – relation (Hubble diagram) derived from the spectroscopic
redshift and K-corrected magnitudes of the galaxies in Table 3. Our relation
is consistent with the Hubble diagram for a majority of known GRGs published by Lara et al.
(2001) [their equation (1) and figure 4];
Col. 10: redshift references. (1) our SAAO observations, (2) our SALT observations,
(3) Sloan Digitized Sky Survey [SDSS] Adelman-McCarthy et al. (2007), (4) Jones et al.
(2005), (5) Colless et al. (2001), (6) Machalski et al. (2001), (7) Bhatnagar et al. (1998),
(8) Stickel et al. (1994), (9) Becker et al. (2001).
| Subsample | Redshift already | to be determined | to be determined | Total |
|---|---|---|---|---|
| available | with the SALT | with other tel. | ||
| NGH | 13 | 16 | 10 | 39 |
| SGH | 7 | 29 | 5 | 41 |
| Name | FR | S1.4 | Score | LAS | Opt. | RDSS | Ref. | ||
|---|---|---|---|---|---|---|---|---|---|
| type | [mJy] | [mJy] | [”] | id. | [mag] | to | |||
| NGH: | |||||||||
| J0824+0140 | IID | 52 | 5.9 | 290 | G | 16.91 | 0.2125 | 1 | |
| J0903+1208 | II | 113 | 1. | 320 | G | 18.73 | (0.27) | ||
| J0922+0919 | IID | 104 | 1.3 | 434 | G | 18.11 | (0.23) | ||
| J09250114 | IID | 71 | 12.8 | 832 | G | 12.30 | 0.0732 | 4 | |
| J09471338 | II | 977 | 0.85 | 20.7 | 1514 | G | 12.70 | 0.0800 | 1 |
| J10051315 | IID | 58 | 260 | G | 19.34 | (0.31) | |||
| J10140146 | II | 225 | 0.76 | 20.4 | 292 | G | 16.54 | 0.1986 | 5 |
| J10181240 | I/II | 276 | 1.27 | 24.8 | 570 | G | 14.66 | 0.0777 | 6 |
| J10210236 | II | 218 | 0.99 | 7.6 | 357 | G | 18.50 | 0.2917 | 2 |
| J1021+1217 | II | 138 | 16.9 | 865 | G | 15.49 | 0.1294 | 3 | |
| J1021+0519 | II | 135 | 5.8 | 835 | G | 16.26 | 0.1562 | 3 | |
| J1048+1108 | IID | 235 | 1.02 | 3.2 | 294 | G | 15.71 | 0.1570 | 3 |
| J10491308 | IID | 193 | 0.89 | ? | 420 | G | 16.05 | (0.15) | |
| J1058+0812 | II | 49 | 1. | 367 | G | 19.74 | (0.33) | ||
| J11011053 | II | 92 | 6. | 852 | G | 16.19 | (0.15) | ||
| J1108+0202 | II | 209 | ? | 556 | G | 15.57 | 0.1574 | 3 | |
| J11260042 | II | 166 | 1.7 | 239 | G | 18.10 | 0.3317 | 2 | |
| J11301320 | II | 1136 | 1.03 | 18.2 | 297 | Q | 15.98 | 0.6337 | 7 |
| J12130500 | IID | 38 | 14.3 | 535 | G | 15.69 | 0.0857 | 1 | |
| J12530139 | II | 171 | 0.61 | 1. | 231 | G | 18.33 | (0.24) | |
| J13280129 | II | 343 | 16.6 | 323 | G | 16.91 | 0.1513 | 3 | |
| J13280307 | II | 201 | 1.2 | 8.8 | 810 | G | 16.82 | 0.0860 | 3,6 |
| J13341009 | II | 1893 | 0.67 | 100. | 850 | G | 13.58 | 0.0838 | 4,8 |
| J13540705 | II | 95 | 2.2 | 240 | G | 17.30 | (0.19) | ||
| J1411+0619 | II | 115 | 0.77 | 22.0 | 310 | G | 20.00 | 0.3591 | 2 |
| J14200545 | II | 89 | 2.7 | 1045 | G | 19.65 | (0.32) | ||
| J1445+0932 | II | 144 | 0.95 | 6.4 | 315 | G | 14.89 | 0.094 | 1 |
| J14450540 | II | 235 | 12.6 | 420 | G | 19.44 | 0.3666 | 2 | |
| J14570613 | II | 507 | 253 | G | 16.64 | 0.1671 | 6 | ||
| J14590432 | IID | 62 | 0.73 | 405 | G | 18.76 | (0.27) | ||
| J15200546 | II | 63 | 10.7 | 1320 | G | 12.35 | 0.0607 | 1 | |
| J1528+0544 | II | 247 | 1.05 | 20.3 | 824 | G | 11.5 | 0.040 | 1 |
| J15400127 | II | 209 | 1.06 | 10.3 | 295 | G | 16.57 | 0.1490 | 3 |
| J15430112 | II | 117 | 0.81 | 0.5 | 175 | G | 20.78 | 0.3680 | 2 |
| SGH: | |||||||||
| J22340224 | II | 73 | 6.1 | 198 | Q | 18.63 | 0.55 | 9 | |
| J22390133 | II | 134 | 1.8 | 1225 | G | 13.45 | 0.0865 | 1 | |
| J23450449 | IID | 162 | 3.5 | 1025 | G | 13.4 | 0.0757 | 4 | |
| J00101108 | IID | 55 | 5.4 | 550 | G | 12.57 | 0.0773 | 3 | |
| J0037+0027 | II | 134 | 1.08 | 2.1 | 299 | G | 20.55 | (0.42) | |
| J00391300 | II | 197 | 0.70 | 640 | G | 12.93 | 0.1060 | 1 | |
| J00420613 | II | 1204 | 0.91 | 390 | G | 16.47 | 0.123 | 1 | |
| J01290758 | I/II | 102 | 720 | G | 14.0 | 0.0991 | 4 | ||
| J01340107 | I/II | 287 | ? | 820 | G | 12.25 | 0.0790 | 3 | |
| J02020939 | II | 431 | 0.87 | 0.4 | 154 | G | 20.2 | (0.37) | |
| J03000728 | II | 51 | 1.2 | 300 | G | 20.44 | 0.4905 | 3 | |
| J03130632 | II | 165 | 1.0 | 195 | Q | 19.20 | 0.389 | 3 |
3. Optical imaging and identification
3.1. DSS identification
To identify the GRG candidates whose radio core is known with a host optical object, first at all we used the DSS, i.e. the digitized POSS and UKST surveys. For all NGH sources with cores, we have identified their cores with galaxies; only one sample source is known radio quasar (J11301320). For the remaining NGH candidates – the galaxies given in Table 3, being the only objects in a middle of the radio structure, thus are very probable identifications. Quite different situation is in the SGH subsample whose sky area is almost not covered by the FIRST survey. Therefore for a certain optical identifications high-resolution radio observations are necessary. The SGH sources, where at the position of detected radio core no optical object had been visible in the DSS data base, were scheduled for a deep detection with the SALT.
3.2. Preliminary deep imaging and photometry with the SALT
During the Performance Verification (P-V) phase two blank fields in the SGH subsample were observed using the SALTICAM. Series of 60sec-long exposures were taken through the , and filters. The frames were corrected for overscan, cross-talk and mosaiced. Because flat-field frames were not available for the tracker position close to the objects’ position, the surface functions were fitted and then subtracted from the frames in order to obtain possibly flat and uniform background. Instrumental magnitudes of objects in the frames were determined using the aperture method. Apparent magnitudes of these objects were estimated using magnitudes of stars in each field for which their standard magnitudes were available from the APM catalogue (http://www.ast.cam.ac.uk/apmcat/). The astrometric calibration was done transforming the instrumental coordinates of these stars in a given frame into their sky coordinates in the DSS data base. These coordinates were not corrected for the proper motion and parallax.
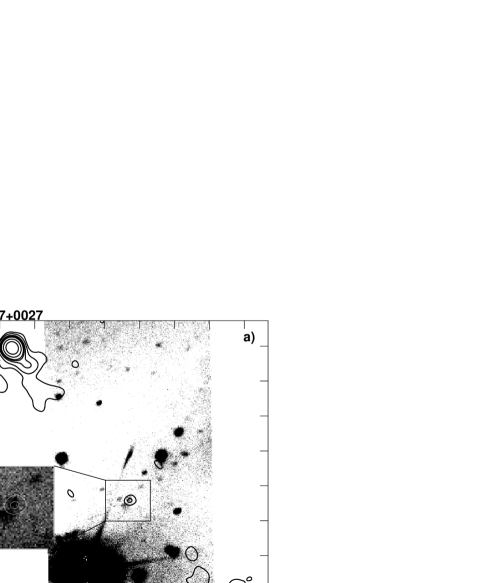
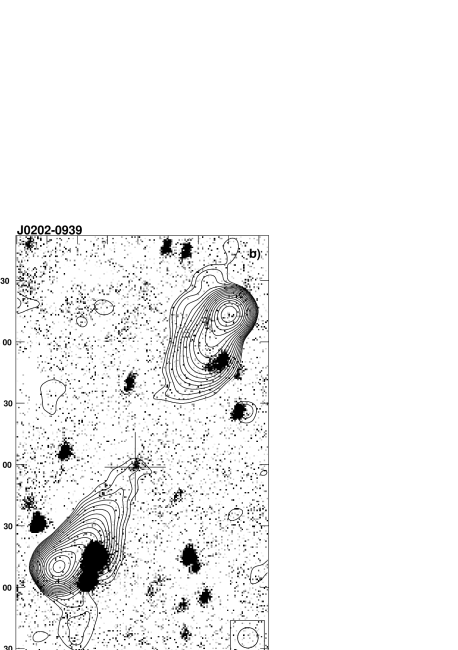
The deep optical images of the field around the sources J0037+0027 and J02020939 are shown in Figs. 1a, b. Overlaid are intensity-contours of the radio maps made with the combined FITS data of the FIRST and NVSS surveys. On both images a faint galaxy coincides with the radio core. The resulting magnitudes and their errors are given in Table 4.
3.3. Auxiliary photometry of J14200545
Because of a suspicion that the radio galaxy J14200545 can be the largest GRG observed up to now (cf. Introduction), we made an auxiliary optical photometry for this galaxy. The observations were made using the 60cm telescope of the Pedagogical Academy at Mt. Suhora. The resulting magnitudes in the photometric system, given in Table 4, are corrected for the atmospheric extinction only. As the galactic latitude of this galaxy is 50 degr, the foreground Galactic extinction is close to zero (Sandage 1972). In order to be consistent with the DSS data, these magnitudes are not K-corrected. Our -band magnitude is thus identical as the corresponding value in Table 3 taken from the DSS data base. The optical spectral index of about 4.0 resulting from our VRI magnitudes also suggests a redshift higher than 0.3 for any of the evolutionary models for early-type galaxies (Bruzual 1983).
| Source | [mag] | [mag] | [mag] | [mag] |
|---|---|---|---|---|
| J0037+0027 | – | 20.550.16 | 21.690.15 | 23.120.13 |
| J02020939 | – | – | 21.360.15 | 22.890.12 |
| J14200545 | 18.440.08 | 19.650.08 | (21.00.2) | – |
4. Optical spectroscopy
4.1. Low-resolution spectroscopy with the SALT
In order to determine physical parameters of a given sample source, e.g. its radio and optical luminosity, linear size and volume, energy density, etc., a distance to the host galaxy (or QSO) must be known which can be calculated from its redshift. Therefore, using the low-resolution spectrograph (PFIS) during the P-V observations we attempted to detect optical spectrum and determine redshifts of 6 faint host galaxies. The observations were made in series between May 30th 2006 and June 24th 2006. The spectra were obtained with the PFIS in Grating Spectroscopy mode using the standard surface-relief grating SR300, slit width of 1.5 arcsec, granting angle of 7 deg, and the binning of 22. These settings resulted in the typical useful spectral range about 3800Å–8500Å and the dispersion of 3.05Å per pixel. Because of the certain space between the CCD chips there is a gap between 6280Å and 6440Å in all the SALT spectra. The pre-reduced (i.e. bias and overscan subtracted, trimmed, cross-talk corrected, mosaiced and cosmic-ray removed) files were further reduced using the standard IRAF tasks. All the spectra were wavelength calibrated using the CuAr arc lamp exposures and one-dimensional spectra were extracted. Gaussian profiles were fitted to the lines visible in the spectra and the wavelengths corresponding to the profiles’ centers were used to calculate the redshift.
4.2. Low-resolution spectroscopy with the 1.9m SAAO telescope
9 host galaxies brighter than about 16 mag () were observed with the 1.9m telescope equipped with the Cassegrain Grating Spectrograph in the long-slit mode. The galaxies were observed with low-resolution grating 8, slit width of 300m (2.5 arcsec) and the grating angle of 14.7 deg resulting in the spectral range 5300Å–7600Å and the dispersion of 1.66Å per pixel. Exposures of the CuAr arc lamp were made every 30 min. Every night selected spectrophotometric standards were also observed.
Reduction of the spectra were carried out using the standard IRAF longslit package. All the spectra were corrected for bias, flat-field and cosmic-rays, as well as wavelength and flux-density calibrated. In order to obtain the resulting spectra with a better S/N ratio, all calibrated one-dimensional spectra of a given galaxy were combined.
| Source | Line/band | Source | Line/band | ||||
|---|---|---|---|---|---|---|---|
| detected | [Å] | detected | [Å] | ||||
| J00391300 | Mg band | 5725.9 | 0.1060 | J1411+0619 | [OII]3727 | 5065.9 | 0.3592 |
| NaD band | 6519.9 | 0.1058 | CaII 3935 | 5350.7 | 0.3598 | ||
| [NII]6550 | 7244.0 | 0.1060 | CaII 3970 | 5396.0 | 0.3592 | ||
| [NII]6585 | 7284.0 | 0.1061 | G band | 5853.8 | 0.3598 | ||
| [SII]6718 | 7432.0 | 0.1062 | Mg band | 7032.6 | 0.3584 | ||
| [SII]6733 | 7446.0 | 0.1059 | NaD band | 8008.2 | 0.3582 | ||
| 0.0002 | 0.0008 | ||||||
| J00420613 | Mg band | 5810.5 | 0.1224 | J1445+0932 | Mg band | 5661.5 | 0.0936 |
| NaD band | 6623.5 | 0.1234 | NaD band | 6450.8 | 0.0941 | ||
| 0.0010 | 0.0010 | ||||||
| J0824+0140 | H | 5894.2 | 0.2125 | J14450540 | [OII]3727 | 5094.1 | 0.3668 |
| [OIII]4959 | 6014.0 | 0.2125 | [OIII]4959 | 6777.2 | 0.3664 | ||
| [OIII]5007 | 6070.6 | 0.2124 | [OIII]5007 | 6842.3 | 0.3665 | ||
| 0.0001 | 0.0003 | ||||||
| J09471338 | Mg band | 5591.1 | 0.0800 | J15200546 | Mg band | 5489.7 | 0.0604 |
| NaD band | 6367.0 | 0.0799 | NaD band | 6252.5 | 0.0605 | ||
| [NII]6550 | 7072.9 | 0.0798 | [NII]6585 | 6986.5 | 0.0610 | ||
| H | 7089.8 | 0.0803 | [SII]6733 | 7142.5 | 0.0608 | ||
| [NII]6585 | 7112.2 | 0.0801 | 0.0003 | ||||
| [SII]6718 | 7255.4 | 0.0800 | |||||
| 0.0002 | |||||||
| J10210236 | [OII]3727 | 4814.9 | 0.2919 | J1528+0544 | Mg band | 5381.4 | 0.0395 |
| [OIII]5007 | 6466.5 | 0.2915 | NaD band | 6135.4 | 0.0406 | ||
| 0.0005 | 0.0010 | ||||||
| J11260042 | [OII]3727 | 4965.1 | 0.3322 | J15430112 | [OII]3727 | 5100.4 | 0.3685 |
| [OIII]4960 | 6602.0 | 0.3310 | [OIII]4364 | 5971.8 | 0.3684 | ||
| [OIII]5007 | 6665.7 | 0.3313 | [OIII]4960 | 6784.4 | 0.3678 | ||
| H | 8742.9 | 0.3321 | [OIII]5007 | 6848.8 | 0.3678 | ||
| 0.0007 | 0.0005 | ||||||
| J12130500 | Mg band | 5618.7 | 0.0853 | J22390133 | Mg band | 5622.9 | 0.0861 |
| NaD band | 6399.0 | 0.0853 | NaD band | 6406.5 | 0.0866 | ||
| H | 7127.4 | 0.0860 | H | 7157.3 | 0.0865 | ||
| [NII]6585 | 7153.6 | 0.0863 | 0.0006 | ||||
| 0.0005 |
4.3. The resulting spectra
The final, low-resolution, 1–D spectra of 14 observed galaxies are shown in Figs. 2a–d. The emission lines and/or absorption bands detected, as well as the resultant redshift of these features are listed in Table 5. Because the spectra taken with the SALT were not flux-density calibrated, relevant ordinates in Figs. 2 give the normalized counts only. Most of the flux-density calibrated spectra are typical of elliptical galaxies whose continuum emission with the broad absorption bands is dominated by evolved giant stars. The emission lines mostly detected are [OII]3727 and [OIII]4960 and 5007. Other forbidden lines present in a few spectra are [NII]6585, as well as [NII]6718 and 6733. Also weak Balmer lines are detected in five of the spectra, however the H line redshifted by more than 1.25 was usually beyond the wavelength range observed.


5. Physical parameters
In order to analyse and discuss our preliminary results on the IGM evolution, we determine or estimate some global physical and geometrical parameters for the sample sources. These parameters are defined and given in Table 6. The entries in parentheses are the approximated values for the sources with the photometric redshift estimate given in Table 3. The seven columns of Table 6 give:
Col. 1: Repeated IAU name;
Col. 2: Logarithm of radio luminosity at the emitted frequency of 1.4 GHz calculated
with the cosmological parameters: =71 km s-1Mpc-1, =0.27,
=0.73;
Col. 3: Projected linear size;
Col. 4: Average magnetic field calculated from the revised equipartition and minimum
energy formula of Beck & Krause (2005) under assumption of a cylindrical geometry
of the extended radio emission with the base diameter set equal to the average width
of the lobes and K0=52 for the
injection spectral index of =0.525;
Col. 5: Equipartition energy density under the same assumption;
Col. 6: Arm separation ratio: the separation of the farther hotspot or the lobe’s
boundary from the core or the identified optical galaxy to the nearer one;
Col. 7: Core prominence defined as the ratio , where both and are determined at
the emitted frequency of 1.4 GHz using the data given in Table 3, however for the
sample sources without a certain spectral index the value of 0.9 has been assumed,
and the relevant value of 0.0 has been taken for the cores.
An estimation of the magnetic field strength in extended lobes of double radio sources still is a controversial matter. In majority of previously published papers the classical energy equipartition approach of Pacholczyk (1970) and its formalism of Miley (1980) was used for this purpose. In the Pacholczyk’s formula the equipartition magnetic field strongly depends on the hardly known ratio of energy in heavy particles to that in the electrons (+positrons) ; in most of the above papers =1 was assumed and the radio spectrum was integrated between a defined frequency range, e.g. between 10 MHz and 100 GHz. In a slightly different approach to the equipartition field calculations, the spectrum is integrated between frequencies corresponding to a minimum and a maximum Lorentz factor for the relativistic electrons (cf. Croston et al. 2005). To overcome the problem of uncertain value of , Beck & Krause (2005) have proposed a revised formula for the magnetic field strength applicable in the simple case that the number density ratio K0 of protons and electrons is constant which is valid in a limited range of particle energies. They estimate that the value of this parameter is 40 K0 100 depending on a value of the injection spectral index . The above three different estimates of average magnetic field in the lobes of selected GRGs are compared between themselves in Konar et al. (2007).
6. Discussion of the results
6.1. Correlation between energy density (pressure) in the lobes and redshift
Since an average internal lobe pressure is proportional to the energy density, in Fig. 3 we plot logarithm of the latter vs. the source’s redshift (1+) for the sample of our GRGs, and supplement it with the corresponding data for two other samples: a limited sample of already known GRGs as well as a sample of “normal-sized” FRII-type radio galaxies taken from Machalski & Jamrozy (2006). Because the equipartition magnetic field calculated using the Beck & Krause formula is larger than the Miley’s value by a factor of 3, the resulting energy densities are one order larger than the classical values. Therefore these values in Fig. 3 (and Table 6) are about 10 times higher than corresponding values calculated with the Miley’s formula and the lowest values of are about 10-14 J m-3 instead of about 10-15 J m-3 like in Subrahmanyan & Saripalli (1993) or Cotter (1998). However this difference can be neglected if we compare the sources with similarly calculated magnetic fields.
This is clearly seen in Fig. 3 that we find 13 GRGs with the values of lower than the lowest values found up to now, though most of them characterize the low-redshift sources at . An exception is the source J14200545. The solid bar indicates an uncertainty of its redshift corresponding to the standard deviation of about 1 mag in the distribution of absolute optical magnitudes of galaxies hosting the GRGs (cf. Lara et al., 2001). The photometric redshift estimate of 0.32 implies a projected linear size of over 4.8 Mpc which, if real, would be larger than the largest GRG known up to now, i.e. 3C236! Unfortunately, our attempts to obtain its optical spectrum either with the SALT or to get observing time at other large telescopes were unsuccessful. The dashed straight line marks the (1+)5 relation.
| Name | log | 10-14 | |||||||
|---|---|---|---|---|---|---|---|---|---|
| [W Hz-1] | [kpc] | [nT] | [J m-3] | ||||||
| NGH: | |||||||||
| J0824+0140 | 24.83 | 994 | 0.224 | 4.67 | 1.19 | 0.105 | |||
| J0903+1208 | (25.40) | (1310) | (0.249) | (5.74) | 1.35 | – | |||
| J0922+0919 | (25.23) | (1580) | (0.195) | (3.52) | 1.52 | 0.010 | |||
| J09250114 | 23.95 | 1144 | 0.129 | 1.55 | 1.31 | ? | |||
| J09471338 | 25.17 | 2258 | 0.163 | 2.47 | 1.13 | 0.020 | |||
| J10051315 | (25.25) | (1175) | (0.240) | (5.33) | 1.30 | – | |||
| J10140146 | 25.38 | 949 | 0.344 | 10.95 | 1.08 | 0.086 | |||
| J10181240 | 24.60 | 828 | 0.264 | 6.45 | 1.42 | 0.089 | |||
| J10210236 | 25.76 | 1547 | 0.267 | 6.61 | 1.40 | 0.028 | |||
| J1021+1217 | 24.77 | 1974 | 0.134 | 1.66 | 1.12 | 0.124 | |||
| J1021+0519 | 24.93 | 2234 | 0.137 | 1.75 | 1.56 | 0.039 | |||
| J1048+1108 | 25.19 | 790 | 0.378 | 13.27 | 1.30 | 0.012 | |||
| J10491308 | (25.05) | (1085) | (0.260) | (6.35) | 1.40 | – | |||
| J1058+0812 | (25.24) | (1730) | (0.168) | (2.62) | 1.25 | – | |||
| J11011053 | (24.74) | (2200) | (0.115) | (1.24) | 1.24 | – | |||
| J1108+0202 | 25.13 | 1497 | 0.213 | 4.23 | 1.22 | – | |||
| J11260042 | 25.76 | 1132 | 0.340 | 10.76 | 1.77 | 0.008 | |||
| J11301320 | 27.29 | 2033 | 0.419 | 16.07 | 1.04 | – | |||
| J12130500 | 23.82 | 849 | 0.144 | 1.92 | 1.02 | – | |||
| J12530139 | (25.43) | (868) | (0.378) | (13.27) | 1.25 | – | |||
| J13280129 | 25.31 | 841 | 0.352 | 11.52 | 1.00 | 0.045 | |||
| J13280307 | 24.56 | 1290 | 0.183 | 3.11 | 1.16 | 0.041 | |||
| J13341009 | 25.50 | 1322 | 0.322 | 9.64 | 1.11 | 0.053 | |||
| J13540705 | (25.00) | (750) | (0.325) | (9.82) | 1.60 | 0.020 | |||
| J1411+0619 | 25.67 | 1547 | 0.232 | 5.00 | 1.20 | ? | |||
| J14200545 | (25.44) | (4830) | (0.095) | (0.83) | 1.08 | 0.024 | |||
| J1445+0932 | 24.49 | 543 | 0.355 | 11.70 | 1.05 | 0.043 | |||
| J14450540 | 26.02 | 2124 | 0.227 | 4.76 | 1.24 | 0.042 | |||
| J14570613 | 25.58 | 715 | 0.515 | 24.65 | 1.30 | – | |||
| J14590432 | (25.14) | (1660) | (0.187) | (3.25) | 1.42 | 0.010 | |||
| J15200546 | 23.73 | 1525 | 0.091 | 0.77 | 1.06 | 0.192 | |||
| J1528+0544 | 23.95 | 643 | 0.222 | 4.56 | 1.39 | 0.086 | |||
| J15400127 | 25.09 | 759 | 0.363 | 12.30 | ? | 0.044 | |||
| J15430112 | 25.70 | 887 | 0.393 | 14.37 | 1.30 | 0.003 | |||
| SGH: | |||||||||
| J22340224 | 25.94 | 1266 | 0.279 | 7.24 | 1.45 | 0.060 | |||
| J22390133 | 24.39 | 1960 | 0.119 | 1.31 | 2.22 | 0.013 | |||
| J23450449 | 24.35 | 1454 | 0.158 | 2.32 | 1.22 | 0.021 | |||
| J00101108 | 23.90 | 795 | 0.173 | 2.79 | 1.35 | 0.100 | |||
| J0037+0027 | (25.90) | (1650) | (0.250) | (5.85) | 1.25 | 0.011 | |||
| J00391300 | 24.73 | 1228 | 0.208 | 4.00 | 1.14 | – | |||
| J00420613 | 25.64 | 852 | 0.310 | 8.92 | ? | – | |||
| J01290758 | 24.39 | 1300 | 0.164 | 2.51 | 1.10 | – | |||
| J01340107 | 24.63 | 1209 | 0.166 | 2.56 | ? | – | |||
| J02020939 | (26.28) | (785) | (0.640) | (38.0) | 1.41 | 0.001 | |||
| J03000728 | 25.67 | 1806 | 0.183 | 3.12 | 1.43 | 0.017 | |||
| J03130632 | 25.93 | 1024 | 0.390 | 14.10 | 1.55 | – |
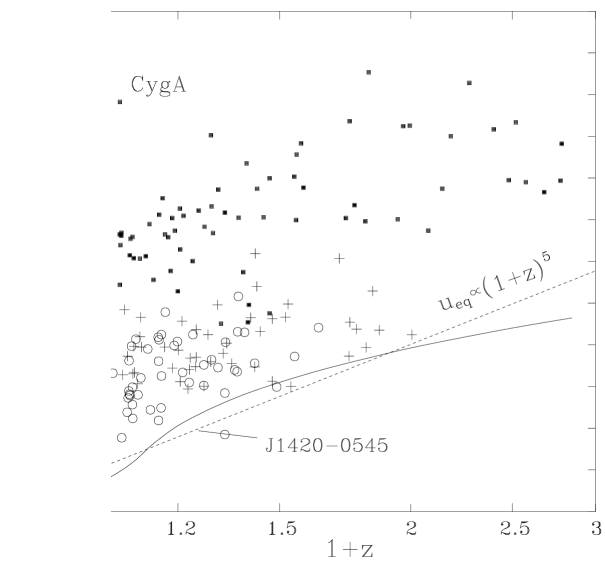
Anyhow the data presented in this paper confirm the known strong increase of the equipartition energy density with increasing redshift (cf. Subrahmanyan & Saripalli 1993; Cotter 1998). To investigate how the observed vs. (1+) correlation reflects an expected change in the environment of GRGs one has to check how the selection effects affect the diagram shown in Fig. 3. According to the classical formula, the equipartition energy density is related to the total power and the volume of a radio source by . Since all the sources plotted in the diagram belong to the flux-density limited samples, therefore sources at higher redshift have, on average, higher radio powers and thus higher energy density at equal source volumes. Moreover, we can expect that an average volume of sources decreases with redshift as does their average linear size. Following Schoenmakers et al. (2000) we calculate the expected as a function of (1+) for sources with flux density of 45 mJy, i.e. a mean value of the limiting fluxes in the NGH and SGH subsamples, and a volume corresponding to cylinder length of 1 Mpc and its diameter of 167 kpc. The resulting relation is shown with the solid curve whose shape simply indicates the log –log(1+) relation for a constant flux density and the radio spectral index of unity.
In our previous paper (Machalski & Jamrozy 2006) we showed that performing a statistical test for correlations between two variables in the presence of one or two other variables one can examine whether a residual correlation between the above two variables (parameters) is still present when the third (or the third and fourth) is (are) held constant. In particular, we showed that the equipartition energy density calculated for the sample radio sources, but transformed to a reference total power and a reference linear size, practically did not correlate with redshift. It seems that supplementing their data (crosses and full dots in Fig. 3) with further GRGs investigated in this paper (open circles in Fig. 3) do not change the situation significantly.
6.2. Morphology of GRGs vs. the environment
Projected linear sizes of the largest FRII-type radio sources, considerably exceeding those predicted (at different redshifts) by the very early dynamical model of Gopal-Krishna & Wiita (1987), already suggested that the IGM may be inhomogeneous and large-scale density fluctuations, especially at high redshifts, can play a significant role in the time evolution of those sources.
The unified scheme for radio sources with active galactic nuclei (AGN) (e.g. Barthel 1989; Gopal-Krishna, Kulkarni & Mangalan 1994; Urry & Padovani, 1995) predicts how the appearance of sources evolving in a homogeneous environment depends on orientation of the jets’ axis towards the observer’s line of sight. This appearance includes the arm separation ratio , the core prominence parameter, (both defined in Section 5), and the flux density ratio in radiation from the opposite lobes (not analysed in this paper). Within this scheme, the effects of relativistic beaming cause that the sources at small inclination angles should have more prominent cores and higher asymmetry ratios in the arm length and flux density compared with those at larger angles.
The evident lack of a statistical correlation between and in our sample (the correlation coefficient of 0.38 suggesting even an anticorrelation) strongly supports a common conviction that the inclination angle of majority of GRGs is close to 90o. Therefore, because the lobes of GRGs lie well beyond the boundary of the parent optical galaxies, their symmetry/asymmetry parameters may reflect eventual environmental heterogeneity. Ishwara-Chandra & Saikia (1999) and Schoenmakers et al. (2000) noted that the GRGs tended to be marginally more asymmetric than smaller sources of a comparable radio luminosity. For example, Ishwara-Chandra & Saikia noted that the median value of the arm separation ratio in their sample of GRGs is about 1.39 compared with about 1.19 for 3CR galaxies of similar luminosity but smaller sizes. According to the unified scheme, the expected arm separation ratio for a source inclined at to the line of sight is only about 1.15 for the jet head advance speed of 0.1 (cf. Scheuer 1995). As the inclination angles of GRGs very likely are close to 90o, the arm asymmetry ratio (frequently much higher than one) should be related to the environmental properties rather than to an orientation towards the observer.
The radio data available for the GRGs investigated in this paper allow us to study a distribution of , and (within a limited range) . The median value of 1.250.03 in the distribution of in our sample supports the Ishwara-Chandra & Saikia’s conclusion that the apparent arm asymmetry in the GRGs “could possibly be caused by interaction of the energy-carrying beams with cluster-sized density gradients far from the parent galaxy”. The presented analysis of the sample of faint low-luminosity GRGs whose lobes lie at least at 0.5–1 Mpc from the parent AGN strongly suggests that these sources, after probing a denser central-halo environment, might further evolve in exceptionally low-density intergalactic medium to some degree being “voids” in the hot IGM. Therefore, search for low-luminosity, high-redshift GRGs and the analysis of their physical and structural parameters, which is the aim of our SALT project, should help to study these density fluctuations and find their relation to the theoretically predicted cosmological evolution of the IGM density due to the expansion of the Universe.
Bearing in mind the above we can conclude as follows:
– If the internal pressure in diffuse lobes really counterbalances the IGM pressure, the data collected till now do not provide a certain observational evidence for the strong cosmological evolution of the latter in the form . However, if the lobes of the most extended and diffused sources are still overpressured in respect to the IGM, especially at low redshifts, any conclusion about the properties of the IGM will not be reliable.
– Deduced low internal pressure in the lobes of GRGs, their observed morphology and the arm asymmetry strongly suggest an existence of deep gradiants in the IGM density with the scale of a few Mpc. However, because an internal pressure in the lobes is proportional to their avarage energy density, a value of this pressure depends of how the magnetic field strength is determined. On the basis of the Chandra and XXM-Newton data on X-ray emission from the lobes of classical double radio sources, Croston et al. (2005) found that “the measured X-ray flux can be attributed to inverse-Compton scattering of the cosmic microwave background radiation with magnetic field strengths in the lobes between 0.3 and 1.3, where the value corresponds to equipartition between the electrons and magnetic field, assuming a filling factor of unity”. Therefore the equipartition magnetic field, energy density, and thus internal lobe-pressure estimates, at least in “normal-sized” sources are likely close to their true values. Unfortunately, X-ray data are not yet available for the lobes of GRGs, in particular for those of low radio luminosity.
– There is still a hope that detection of the most distant and low-luminosity GRGs, which is the aim of our SALT project, can help in an observational confinement on the hypothesis of cosmological evolution of the IGM. The most promising is our SGH subsample consisting of many GRG candidates optically not identified on the DSS frames, thus with apparent magnitudes of mag.
Acknowledgements The authors thank Dr Alexei Kniazev and the remaining SALT staff for their effort in making the PFIS observations. D. K.-W. acknowledges the hospitality of the SAAO authorities and Dr Stephen Potter for helping in the observations. We also also thank Michał Siwak for the Mt. Suhora observations. This project was supported by MNiSW with funding for scientific research in the years 2005–2007 under contract No. 0425/PO3/2005/29. Support from SALT International Network grant No. 76/E-60/SPB/MSN/P-03/DWM 35/2005-2007 is also acknowledged.
References
- [1] Adelman-McCarthy, J.K., Agüeros, M.A., Allam, S.S., et al., 2007, ApJS, 172, 634
- [2] Barthel, P.D., 1989, ApJ, 336, 606
- [3] Beck, R., and Krause, M., 2005, Astron. Nachr., 326, 414
- [4] Becker, R.H., White, R.L., and Helfand, D.J., 1995, ApJ, 450, 559
- [5] Becker, R.H., White, R.L., Gregg, M.D., et al., 2001, ApJS, 135, 227
- [6] Bhatnagar, S., Gopal-Krishna, and Wisotzki, L., 1998, MNRAS, 299, L25
- [7] Blundell, K.M., Rawlings, S., and Willott, C.J., 1999, AJ, 117, 766
- [8] Bruzual, G.A., 1983, Rev. Mexicana A&A, 8, 63
- [9] Colless, M.M., Dalton, G.B., Maddox, S.J., et al., 2001, MNRAS, 328, 1039
- [10] Condon, J.J., Cotton, W.D., Greisen, E.W., et al., 1998, AJ, 115, 1693
- [11] Cotter, G., 1998, Astrophysics and space science library (ASSL), Eds. M.N. Bremer et al. (Dordrecht: Kluwer Academic Publishers), p. 233
- [12] Cotter, G., Rawlings, S., and Saunders, R., 1996, MNRAS, 281, 1081
- [13] Croston, J.H., Birkinshaw, M., Hardcastle, M.J., and Worrall, D.M., 2004, MNRAS, 353, 879
- [14] Croston, J.H., Hardcastle, M.J., Harris, D.E., et al., 2005, ApJ, 626, 733
- [15] Crawford, C.S., et al., 1999, MNRAS, 308, 1195
- [16] Gopal-Krishna, Kulkarni, V.K., and Mangalam, A.V., 1994, MNRAS, 268, 459
- [17] Gopal-Krishna, and Wiita, P.J., 1987, MNRAS, 226, 531
- [18] Hardcastle, M.J., Birkinshaw, M., Cameron, R.A., et al., 2002, ApJ, 581, 948
- [19] Ishwara-Chandra, C.H., and Saikia, D.J., 1999, MNRAS, 309, 100
- [20] Jones, D.H., Saunders, W., Read, M., and Colless, M., 2005, PASA, 22, 277
- [21] Kaiser, C.R., and Alexander, P., 1997, MNRAS, 286, 215
- [22] Kaiser, C.R., and Alexander, P., 1999, MNRAS, 305, 707
- [23] Konar, C., Jamrozy, M., Saikia, D.J., and Machalski, J., 2007, MNRAS, (in print, astro-ph/0709.4470)
- [24] Lara, L., Márquez, I., Cotton, W.D., Feretti, L., et al., A&A, 378, 826
- [25] Machalski, J., and Jamrozy, M., 2006, A&A, 454, 95
- [26] Machalski, J., Jamrozy, M., and Zola, S., 2001, A&A, 371, 445
- [27] Mack, K.H., Klein, U., O’Dea, C.P., et al., 1998, A&A, 329, 431
- [28] Miley, G.K., 1980, ARA&A, 18, 165
- [29] Pacholczyk, A.G., 1970, Radio Astrophysics, Freeman and Co., San Francisco
- [30] Sandage, A., 1972, ApJ, 178, 25
- [31] Scheuer, P.A.G., 1995, MNRAS, 277, 331
- [32] Schoenmakers, A.P., van der Laan, H., Röttgering, H.J.A., and de Bruyn, A.G., 1998 ASP Conf. Ser. No. 146, Eds. S. D’Odorico A., Fontana, and E. Giallongo, p.84
- [33] Schoenmakers, A.P., Mack, K.-H., de Bruyn, A.G., et al., 2000, AA&S, 146, 293
- [34] Stickel, M., Meisenheimer, K., and Kühr, H., 1994, A&AS, 105, 211
- [35] Strom, R.G. and Willis, A.G., 1980, A&A, 85, 36
- [36] Subrahmanyan, R. and Saripalli, L., 1993, MNRAS, 260, 908
- [37] Urry, C.M. and Padovani, P., 1995, PASP, 107, 803