Simultaneous Multi-Wavelength Observations of Magnetic Activity in Ultracool Dwarfs. II. Mixed Trends in VB 10 and LSR 1835+32 and the Possible Role of Rotation
Abstract
As part of our on-going investigation of magnetic activity in ultracool dwarfs we present simultaneous radio, X-ray, UV, and optical observations of LSR 1835+32 (M8.5), and simultaneous X-ray and UV observations of VB 10 (M8), both with a duration of about 9 hours. LSR 1835+32 exhibits persistent radio emission and H variability on timescales of hr. The detected UV flux is consistent with photospheric emission, and no X-ray emission is detected to a deep limit of . The H and radio emission are temporally uncorrelated, and the ratio of radio to X-ray luminosity exceeds the correlation seen in F–M6 stars by . Similarly, is at least 30 times larger than in early M dwarfs, and eliminates coronal emission as the source of chromospheric heating. The lack of radio variability during four rotations of LSR 1835+32 requires a uniform stellar-scale field of G, and indicates that the H variability is dominated by much smaller scales, of the chromospheric volume. VB 10, on the other hand, shows correlated flaring and quiescent X-ray and UV emission, similar to the behavior of early M dwarfs. Delayed and densely-sampled optical spectra exhibit a similar range of variability amplitudes and timescales to those seen in the X-rays and UV, with . Along with our previous observations of the M8.5 dwarf TVLM 513-46546 we conclude that late M dwarfs exhibit a mix of activity patterns, which points to a transition in the structure and heating of the outer atmosphere by large-scale magnetic fields. We find that rotation may play a role in generating the fields as evidenced by a tentative correlation between radio activity and rotation velocity. The X-ray emission, however, shows evidence for super-saturation at km s-1, which could be the result of secondary effects such as inefficient heating or centrifugal stripping of extended coronal loops. These effects may underlie the severe violation of the radio/X-ray correlation in ultracool dwarfs. Upcoming observations of L dwarfs will reveal whether these trends continue in substellar objects.
Subject headings:
radio continuum:stars — stars:activity — stars:low-mass, brown dwarfs — stars:magnetic fields1. Introduction
Over the past several decades, observations of magnetic activity in stars of spectral type F–M have uncovered a variety of correlations between the different activity indicators, as well as between the level of activity and properties such as stellar rotation and age. Coronal X-ray emission, transition region UV emission, chromospheric H emission, and non-thermal radio emission increase with both rotation and youth (e.g., Kraft 1967; Pallavicini et al. 1981; Stewart et al. 1988), and are temporally and energetically correlated in quiescence and during flares (e.g., Cram 1982; Guedel & Benz 1993; Benz & Guedel 1994; Hawley et al. 1996). These observations have led to a general paradigm of magnetic field amplification at the shearing interface between the radiative and convective zones – the so-called dynamo (Parker 1955). This dynamo operates through a combination of stretching by differential rotation () and twisting by convective motions ().
In quiescence, the dynamo-generated fields provide a heating source for the chromospheres and coronae primarily through magnetic waves and field dissipation on small scales (e.g., Narain & Ulmschneider 1996; Aschwanden et al. 2001). The interplay between the chromosphere, transition region, and corona is not fully understood, but is known to involve a complex combination of radiation, conduction, and mass flows. In dMe stars it has been proposed that the transition region and chromosphere are instead heated by coronal X-rays, leading to the observed typical luminosity ratios of and , respectively (e.g., Cram 1982; Hawley & Johns-Krull 2003). In addition to quiescent emission, sudden and large-scale dissipation of the field through large-scale magnetic reconnection may lead to particle acceleration and evaporation of the lower atmosphere into the chromosphere, transition region, and corona, giving rise to correlated radio, X-ray, UV, and H flares (e.g., Neupert 1968).
The level of activity increases with faster rotation, but eventually saturates at and for rotation periods of d in F–M stars. It remains unclear whether this trend reflects a saturation of the dynamo itself or secondary centrifugal effects such as coronal stripping or sweeping of the field toward the poles (e.g., Vilhu 1984; Jardine & Unruh 1999; Stȩpień et al. 2001).
These activity trends continue to hold even beyond spectral type , where the stellar interiors become fully convective and the dynamo can no longer operate. Indeed, the level of X-ray and H activity peaks in mid M dwarfs at saturated levels (Vilhu & Walter 1987; Gizis et al. 2000; Mohanty & Basri 2003; West et al. 2004). This suggests that whatever dynamo mechanism operates in these low mass stars, it is already present in higher mass objects, and becomes increasingly dominant beyond spectral type M3. However, the level of X-ray and H activity drops precipitously beyond spectral type M7, reaching mostly non-detectable levels by spectral type L5. This decrease is accompanied by a clear transition from quiescent emission to flares in the few percent of active objects (Reid et al. 1999; Gizis et al. 2000; Rutledge et al. 2000; Liebert et al. 2003; West et al. 2004). These trends point to a change in the dynamo mechanism, the field configuration, and/or the field dissipation process.
Radio observations, however, have uncovered a substantial fraction of active late M and L dwarfs ( or higher; Berger 2006), which exhibit both quiescent and flaring emission (Berger et al. 2001; Berger 2002; Berger et al. 2005; Burgasser & Putman 2005; Berger 2006; Osten et al. 2006b; Antonova et al. 2007; Phan-Bao et al. 2007; Hallinan et al. 2007; Audard et al. 2007; Berger et al. 2007). Unlike the trend in H and X-rays, the level of radio activity appears to increase with later spectral type (Berger 2002, 2006). The radio emission is orders of magnitude brighter than expected based on the radio/X-ray correlations that are observed in stars down to spectral type M6, and requires magnetic fields of kG with order unity filling factor sustained over timescales of at least several years (Berger et al. 2005; Berger 2006; Berger et al. 2007). Thus, contrary to evidence from X-rays and H, a substantial fraction of ultracool dwarfs continue to generate and dissipate magnetic fields.
In order to investigate the field generation and dissipation in detail, we have recently initiated a program of simultaneous, multi-wavelength observations of ultracool dwarfs. Such observations are required to trace the temporal evolution of flares across the corona, transition region, and chromosphere, and to study the relation between particle acceleration and heating, particularly in the context of the known correlations in F–M stars. In a previous paper (Berger et al. 2007; hereafter Paper I) we presented observations of the M8.5 rapid rotator TVLM 513-46546, which exhibited a wide range of temporally uncorrelated emission in the radio, H, and X-rays. These included quiescent radio emission from a large-scale field, radio flares from a tangled field component with kG, and periodic H emission matching the stellar rotation period with an inferred hot spot covering about of the stellar photosphere. In addition, the quiescent H emission exceeded the X-ray luminosity by about a factor of two, likely ruling out coronal X-ray emission as the source of chromospheric heating.
Here we present observations of the M8 and M8.5 dwarfs VB 10 and LSR 1835+32, both of which are known to exhibit magnetic activity. We find substantially different behavior in each of these two objects, with correlated X-ray/UV flares and quiescent emission in VB 10, and uncorrelated radio/H emission in LSR 1835+32. Along with TVLM 513-46546, the mixed behavior in late M dwarfs thus indicates a transition in the properties of the magnetic field and its dissipation in this spectral type range. We show that rotation may play at least a partial role in explaining these trends.
2. Targets and Observations
We chose to target the nearby dwarf stars VB 10 and LSR 1835+32 due to previous detections of activity from these objects in the optical/UV/X-ray and radio bands, respectively. LSR 1835+32 (8.5) is located at a distance of 5.7 pc and has a bolometric luminosity of L⊙ (Reid et al. 2003). A previous -hr radio observation revealed persistent emission with Jy and a limit of on the fraction of circular polarization (Berger 2006). The rotation velocity of LSR 1835+32 was not previously known, but we measure it here to be km s-1 (§2.3), similar to fast rotators such as TVLM 513-46546 and Kelu-1.
VB 10 (M8) is located at a distance of 6.1 pc (Tinney 1996), has L⊙, and a slow rotation velocity, km s-1 (Mohanty & Basri 2003). An X-ray flare from VB 10 was previously detected by ROSAT, with a duration of min and an average luminosity, erg s-1, or (Fleming et al. 2000). Subsequent Chandra observations revealed quiescent emission with (Fleming et al. 2003). In addition, Hubble Space Telescope observations revealed flaring and quiescent transition region emission (Linsky et al. 1995; Hawley & Johns-Krull 2003). VB 10 is also known to produce H emission with equivalent widths of Å reported in the literature (Martín et al. 1999; Mohanty & Basri 2003; Reiners & Basri 2007), or . No radio emission has been detected to date, with a limit of Jy at 8.5 GHz (Krishnamurthi et al. 1999). Finally, Reiners & Basri (2007) recently estimated the surface magnetic field to be kG, where is the field filling factor.
The simultaneous observations of LSR 1835+32 presented here were conducted on 2007 May 3 for a total of 8.7 hr in the radio (06:40–15:20 UT), 8.4 hr in the X-rays (07:16–15:43 UT), and 5.4 hr in the optical (09:42–15:04 UT). Observations with the Swift/UVOT took place intermittently between 08:09 and 16:31 UT with a total on-source exposure time of 9.4 ks.
Observations of VB 10 were conducted on 2007 July 1 for a total of 8.9 hr in the X-rays (10:29–19:21 UT), with intermittent UV coverage between 11:08 and 19:15 UT for a total of 8.4 ks. Optical spectroscopy was obtained only two weeks later, on 2007 July 15 (08:10–13:33 UT).
2.1. Radio
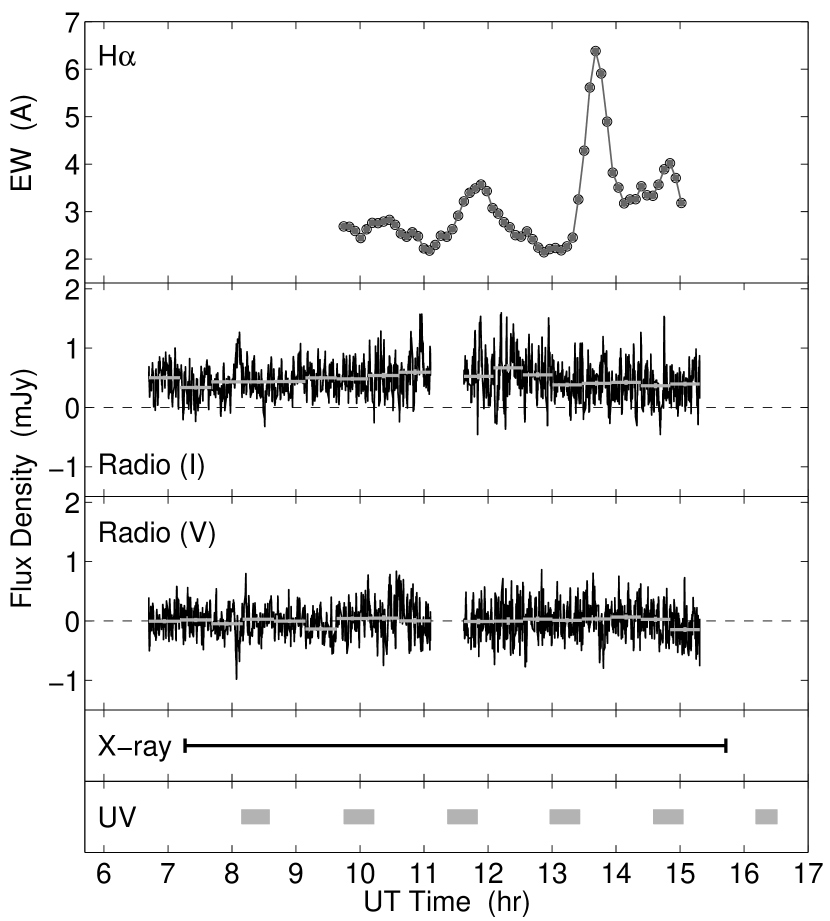
Very Large Array111The VLA is operated by the National Radio Astronomy Observatory, a facility of the National Science Foundation operated under cooperative agreement by Associated Universities, Inc. observations of LSR 1835+32 were obtained at a frequency of 8.46 GHz in the standard continuum mode with MHz contiguous bands. Scans of 295 s on source were interleaved with 50 s scans on the phase calibrator J1850+284. The flux density scale was determined using the extragalactic source 3C 286 (J1331+305). Data reduction and analysis follow the procedure outlined in Paper I. The total intensity and circular polarization light curves are shown in Figure 1.
2.2. X-Rays
Observations were performed with the Chandra/ACIS-S3 backside-illuminated chip, with both LSR 1835+32 and VB 10 offset from the on-axis focal point by . A total of 28.33 and 29.29 ks were obtained, respectively. The data were analyzed using CIAO version 3.4, and counts were extracted in a radius circle centered on the position of each source.
For LSR 1835+32 we established a bore-sight correction based on one source in common between the VLA and Chandra images. The derived correction is and . Within the aperture centered on the position of LSR 1835+32 we find only 2 counts, with 1.5 counts expected from the background as determined from annuli centered on the source position. Thus, the resulting upper limit is about 7 counts ( confidence level). Using an energy conversion factor of erg cm-2 s-1 (appropriate for a 1 keV Raymond-Smith plasma model in the keV range) we find erg cm-2 s-1, or , one of the faintest limits to date for any ultracool dwarf.
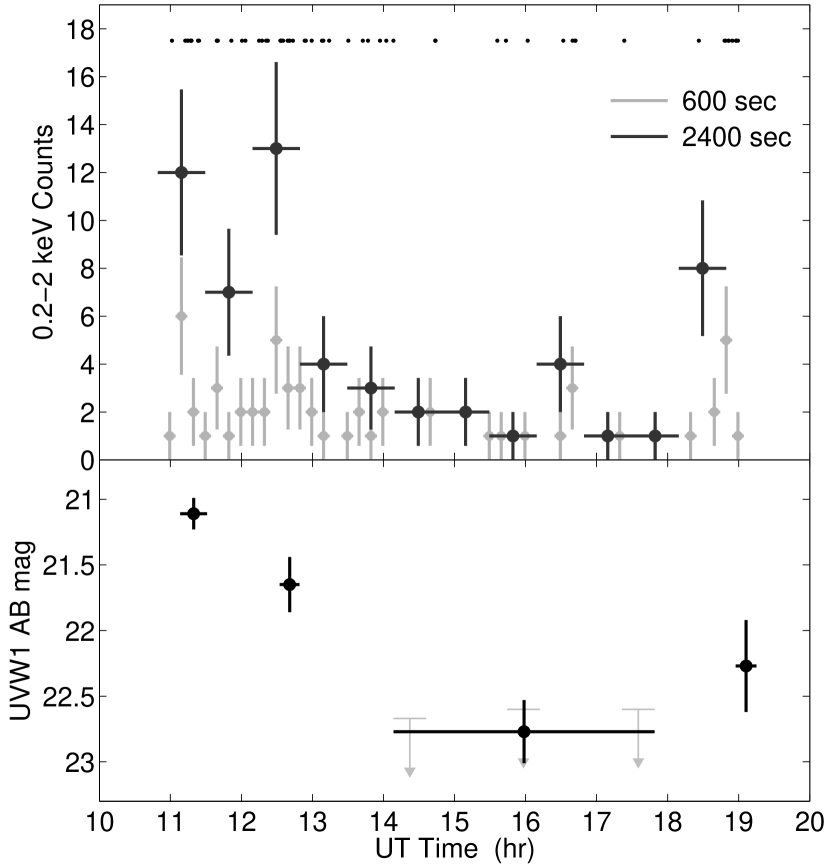
In the observation of VB 10 we detect a total of 60 counts within the extraction aperture; 2 counts are expected from the background. Of the 60 detected counts, 59 are in the energy range keV, similar to what has been found for other M dwarfs (including TVLM 513-46546: Paper I). Using this energy range we construct light curves and spectra. The light curve is shown at various time binnings in Figure 2, and is composed of a bright flare with a duration of hr, followed by about 4 hr of low-level quiescent emission, and finally a fainter flare during the final hour of the observation. Using the time range 14:30–18:00 UT to represent the quiescent component we find a total of 10 counts, or a count rate of s-1.
To determine the flux and plasma temperature we fit the keV spectrum using a Raymond-Smith model. We find that a single-component model provides a poor fit to the data, with for 9 degrees of freedom (null hypothesis probability of 0.2); Figure 3. The fit parameters are keV, and a normalization of .
An improved fit is achieved using two components, with for 7 degrees of freedom (null hypothesis probability of 0.94); Figure 3. The best-fit temperatures are keV and keV (formally, keV). The normalizations of the two components are and , respectively. The resulting average flux over the full observation is erg cm-2 s-1, or .
Using the same model for the quiescent component, we find erg cm-2 s-1, or , in excellent agreement with the value found previously by Fleming et al. (2003). The peak count rate of the first flare is about s-1, corresponding to erg cm-2 s-1 and . For the second flare, erg cm-2 s-1 and .
2.3. Optical Spectroscopy
We used222Observations were obtained as part of program GN-2007A-Q-60. the Gemini Multi-Object Spectrograph (GMOS; Hook et al. 2004) mounted on the Gemini-North 8-m telescope with the B600 grating set at a central wavelength of 5250 Å, and with a slit. The individual 300-s exposures were reduced using the gemini package in IRAF (bias subtraction, flat-fielding, and sky subtraction). Wavelength calibration was performed using CuAr arc lamps and air-to-vacuum corrections were applied. The spectra cover Å at a resolution of about 5 Å. For LSR 1835+32 we obtained a series of sixty exposures, while for VB 10 the data were obtained non-simultaneously with a total of 61 exposures. The fast readout time of s provides on-source efficiency.
We detect highly variable H emission in LSR 1835+32 (Figure 1). Spectra with strong H emission also exhibit higher-order Balmer lines (H–H) and Ca II H&K emission. Sample spectra in the High and Low emission line states are shown in Figure 4.
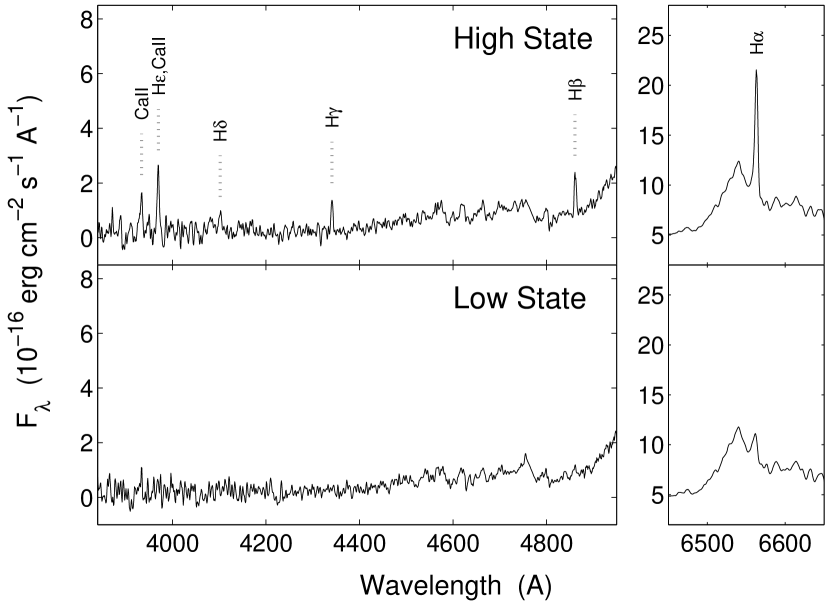
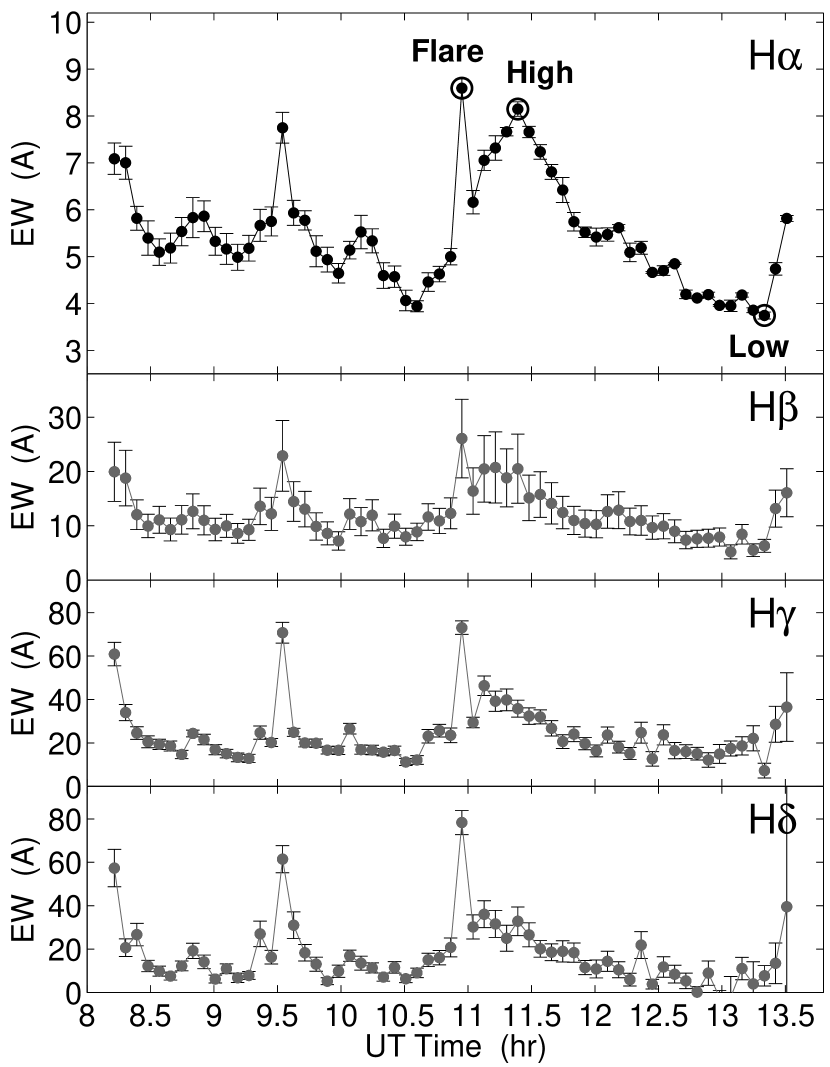
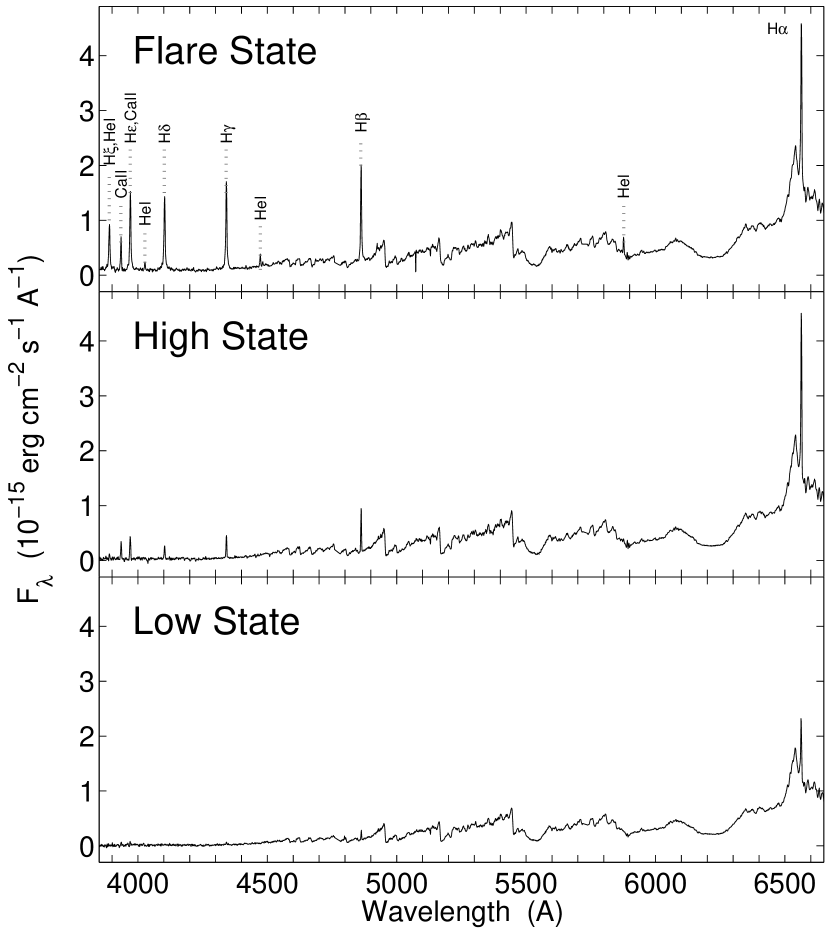
The spectrum of VB 10 exhibits strong variability in the Balmer (H–H) and Ca II H&K lines; Figure 5. As in the case of LSR 1835+32 we identify High and Low emission line states (Figure 6), but we also identify an impulsive Flare state marked by a short duration ( s; Figure 5) and emission lines of He I (Figure 6).
In addition to the low-resolution Gemini spectra, we obtained high resolution spectra of LSR 1835+32 to measure its rotation velocity, using the High Resolution Echelle Spectrometer (HIRES) on the Keck I 10-m telescope. The spectroscopic setup and data reduction are detailed in Mohanty & Basri (2003) and Reiners & Basri (2007). Using the slow rotator CN Leo (M6; km s-1) as a template, we measure a rotation velocity for LSR 1835+32 of km s-1, or a period of about 2.4 hr; Figure 7.
2.4. Ultraviolet
Data were obtained with the Swift UV/optical telescope in the UVW1 filter ( Å), as a series of 6 images with exposure times ranging from 560 to 1630 s for LSR 1835+32 (Figure 1) and 980 to 1630 s for VB 10 (Table 1 and Figure 2).
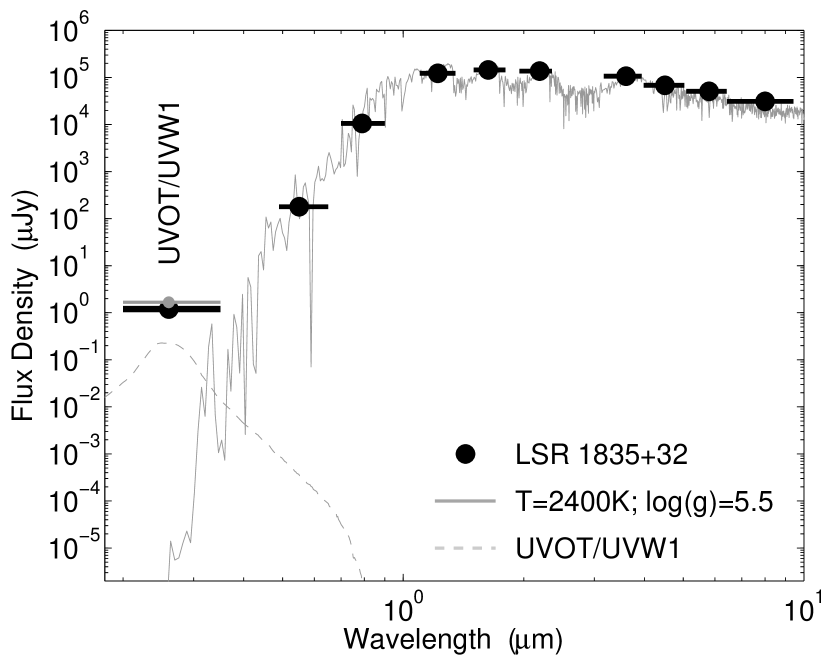
No source is detected at the position of LSR 1835+32 in any of the individual exposures, but we detect a source at confidence level in the combined 9.4 ks image. Photometry of the combined image (including a 0.2 mag correction to the standard aperture) reveals a flux of erg cm-2 s-1 Å-1, or mag. To estimate the expected UV photospheric emission we convolve the UVOT/UVW1 transmission curve with an AMES-cond model333The AMES-cond model assumes that all dust has gravitationally settled out of the atmosphere (Allard et al. 2001). We find that the opposite case of no gravitational settling (AMES-dusty model) provides essentially the same result in the UV. with and K (Allard et al. 2001), which provides an excellent fit to the optical and IR data for LSR 1835+32 (Figure 8). We find an expected photospheric brightness of mag, in excellent agreement with the observed flux. Thus, no contribution from a quiescent or flaring transition region is detected.
VB 10, on the other hand, is clearly variable in the UV, and is detected in exposures 1, 2, and 6, with an additional detection when combining exposures 3, 4, and 5. A summary of the derived magnitudes, corrected to the standard aperture, is provided in Table 1, and the light curve is shown in Figure 2. Repeating the same analysis as for LSR 1835+32, we find that the minimum observed UV emission exceeds the expected photospheric emission by about an order of magnitude. Thus, in VB 10 the flaring and quiescent UV emission are due to an active transition region.
3. Multi-Wavelength Emission Properties
We observed LSR 1835+32 and VB 10 across a wide wavelength range that traces activity in various layers of the outer atmosphere. The radio emission is due to particle acceleration by magnetic processes, the optical emission lines trace the chromospheric plasma, the UV emission arises in the transition region, and the X-ray thermal emission is produced in the corona.
3.1. LSR 1835+32
The broad-band emission properties of LSR 1835+32 are summarized in Figure 1. The radio emission appears to be nearly constant both in total intensity and circular polarization. The average flux density is Jy, while the upper limit on the fraction of circular polarization is . For comparison, previous observations of LSR 1835+32 revealed a flux of Jy, with an upper limit on the circular polarization of (Berger 2006). We note the possible detection of one weak flare (at 08:05 UT) with a peak flux density of about 1.3 mJy and a duration of about 5 min (Figure 1). The average flux density during the putative flare is only Jy above the quiescent emission level, and the average fraction of circular polarization is .
We therefore conclude that the radio emission from LSR 1835+32 is generally persistent in origin, with at most a mild variability at the level of on hour to year timescales. The one possible short duration flare points to a duty cycle of less than a few percent if the flare distribution is uniform. Alternatively, it is possible that we observed LSR 1835+32 in a period of relative quiescence, and future observations may reveal the existence of flares with a higher duty cycle.
Since our radio observation covers nearly 4 rotation periods of LSR 1835+32, the lack of significant variability points to emission from a uniform and stable magnetic field configuration. Assuming a structure with cm we infer a brightness temperature, K, indicative of non-thermal gyrosynchrotron emission. This conclusion is supported by the overall persistence of the radio emission and the low fraction of circular polarization.
In the context of gyrosynchrotron radiation the emission spectrum is determined by the size of the emitting region (), the density of radiating electrons (), and the magnetic field strength () according to (Dulk & Marsh 1982):
| (1) |
| (2) |
| (3) |
where is the angle between the magnetic field and the line of sight. Using a range of we find G, respectively. Assuming GHz, we find cm, and cm-3; the latter is for the range . Typical coronal densities in M dwarfs are cm-3 (van den Besselaar et al. 2003; Osten et al. 2006a; Berger et al. 2007), suggesting that , and hence G and . Since the corona is likely to have an overall shell geometry, the derived physical properties can be interpreted as a structure extending above the stellar photosphere with order unity filling factor. Smaller filling factors will lead to more extended magnetic structures.
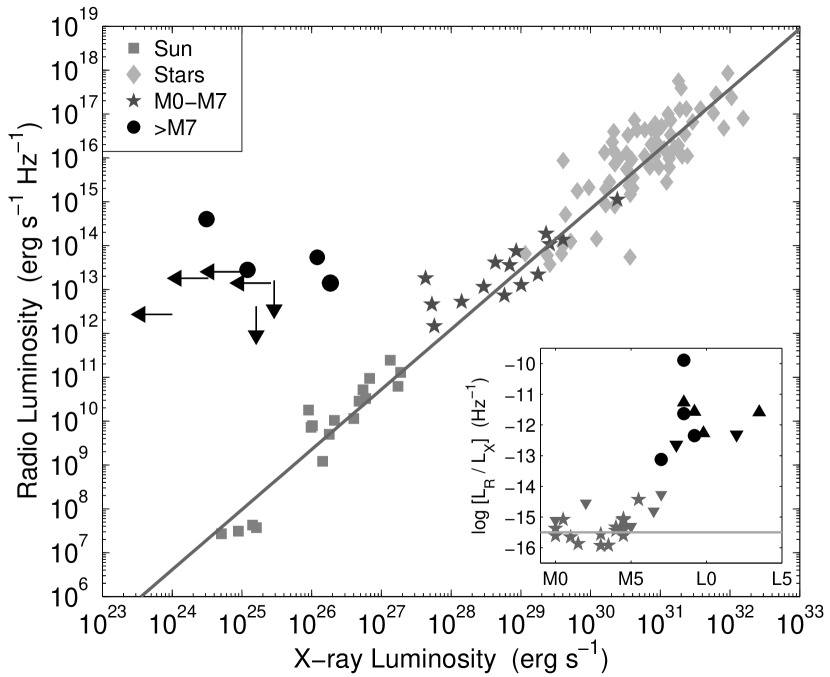
With strong persistent radio emission and no corresponding X-ray emission, LSR 1835+32 joins the sample of ultracool dwarfs which strongly violate the radio/X-ray correlation, Hz-1 (Guedel & Benz 1993), observed in F–M6 active stars and in solar flares. We find Hz-1, more than four orders of magnitude in excess of the expected value; Figure 9. We stress that the long-term persistence and low circular polarization of the radio emission clearly point to gyrosynchrotron radiation from a stellar-scale magnetic field, so the severe violation cannot be explained away with small-scale, short-duration heating by coherent processes such as electron cyclotron maser or plasma radiation.
We next turn to the H emission for which we measure a range of equivalent widths of Å (Figure 1). This range corresponds444To convert from equivalent width to we use a conversion factor () of appropriate for LSR 1835+32 (Walkowicz et al. 2004). to , about an order of magnitude lower than the saturated H emission found in mid M dwarfs. The weaker chromospheric emission from LSR 1835+32 is in good agreement with the general trend of decreasing H emission in ultracool dwarfs.
As in the case of the radio emission, the level of detected H emission is puzzling in the context of the non-detected X-ray emission. Observations of M0–M6 dwarfs reveal a typical ratio, , with a full range of (Hawley et al. 1996). For LSR 1835+32 this ratio is (using the weakest H flux), at least an order of magnitude larger than in M0–M6 dwarfs. The significantly brighter H emission indicates that chromospheric heating is significantly more efficient in LSR 1835+32 than coronal heating, possibly as a result of the field configuration. We return to this point in §4. Moreover, the elevated H emission rules out coronal X-ray emission as the source of chromospheric heating, as proposed for dMe stars.
While both radio and H emission are detected, we find a clear lack of temporal correlation between these two activity indicators. The H light curve exhibits significant variability on timescales of hr, with a wide range of amplitudes, Å. However, no clear radio variability is observed in coincidence with any of the H brightening episodes. In particular, during the large increase in H equivalent width centered on 13:40 UT (Figure 1), we find a limit of on the variability of the radio emission. This can be explained in two ways. First, the H variability originates from much smaller physical scales than the radio emission (for which ), and any associated radio variability is therefore dwarfed by the overall persistent flux. In this case, we infer that the typical scale of chromospheric regions giving rise to H variability is of the overall chromospheric volume. Alternatively, the radio emission associated with the variable H emission is produced at a much different frequency than our observed 8.5 GHz band. This may be the result of coherent radio emission from fields weaker than kG, which would lead to emission at Hz.
To summarize, LSR 1835+32 exhibits quiescent radio emission with no appreciable variability over the timescale of our observation (4 rotation periods), or on year timescales. The chromospheric H emission, on the other hand, is highly variable with changes of a factor of 3 in equivalent width on timescales of hr. The H flux exceeds the undetected X-ray emission by at least an order of magnitude, indicating that the chromosphere is not heated by coronal emission. The radio emission violates the radio/X-ray correlation of F–M6 stars by about 4 order of magnitude.
3.2. VB 10
For VB 10 we were able to obtain simultaneous observations only in the X-rays and UV (Figure 2). The X-ray light curve exhibits both flaring and quiescent emission with ratios of and , respectively. As noted in §2, quiescent X-ray emission was previously detected from VB 10 in a shorter observation (Fleming et al. 2003) and we confirm its existence here at the same flux level. The X-ray spectrum is dominated by a K plasma, with a possible second component with K (Figure 3). These temperatures are typical of coronal X-ray emission from M dwarfs, and similar to what we previously found for TVLM 513-46546, K (Paper I).
The UV emission clearly tracks the X-ray behavior, with detections of the two flares and the quiescent component. The peak UV brightness exceeds the quiescent emission by a factor of about 5 (Table 1), somewhat less that the order of magnitude change in X-ray brightness (§2.2). Moreover, the quiescent component exceeds the expected photospheric emission by about an order of magnitude, and thus points to the existence of a persistent transition region, as noted previously by Hawley & Johns-Krull (2003). So far this is the only case of correlated emission found in any of our targets, suggesting that at least some late M dwarfs may follow the behavior seen in early M dwarfs.
As in the case of the X-ray and UV data, our non-simultaneous optical spectroscopy also reveals a significant level of variability. As far as we know, our spectroscopic observations provide the most extensive coverage of VB 10 in the published literature, and are thus valuable even if no multi-wavelength coverage is available. Here we provide a brief summary of the observations, and defer a detailed analysis to a future publication.
We clearly detect H in emission in all of the individual exposures. An equivalent width light curve is shown in Figure 5. The range of measured values is Å, extending to somewhat higher values than previously published for VB 10. Similarly, the H line varies from 5 to 26 Å, while H and H range from undetectable levels ( Å) to about 80 Å. We also detect Ca II H&K emission ranging from non-detectable levels to a K line555The Ca II H line is blended with H. equivalent width of about 30 Å.
The emission line light curves exhibit a wide range of variability timescales. We note that the total duration of our observation samples only about 1/4 of a rotation of VB 10 ( km s-1), and we therefore have no information on rotational modulation, which was detected in our previous target, TVLM 513-46546 (Paper I). The variability is primarily gradual with the rise and fall times of individual episodes being roughly the same. The broadest brightening has a rise time of about 0.7 hr and a decay time of about 2 hr, with a factor of two increase in equivalent width. The variability is reflected in all of the detected Balmer lines, but the relative change in equivalent width is largest for the weakest lines. This mild change in the Balmer decrement points to increased densities and temperatures during brighter emission episodes. Sample spectra in these High and Low states are shown in Figure 6.
In addition to the time-resolved and gradual changes in emission line equivalent width we detect two episodes of rapid brightening with a duration of s (Flare state). These flares are marked by a large increase in the equivalent width of the higher-order Balmer lines and the Ca II lines relative to the High state spectra. They are further distinguished from the High state spectra by the appearance of He I lines (Figure 6). Temporally, both of the detected flares are superposed on gradual brightenings, suggesting that the two modes of variability are causally and temporally unrelated and arise in different regions of the chromosphere.
The significant difference in Balmer decrement between the High and Flare states, and the appearance of He I lines in the latter indicate higher plasma densities, and most likely temperatures in the Flare state. A comparison to flares on mid M dwarfs (Allred et al. 2006 and references therein) reveals shallower Balmer decrements in the impulsive flares on VB 10: , , and , compared to average values of 0.8, 0.5, and 0.4, respectively. Similarly, the formation of He I lines generally requires dense plasma ( cm-3) at K, approaching the transition region temperatures.
Although our X-ray and optical observations are not simultaneous, the variability timescales in both bands are similar (Figures 2 and 5). This suggests that in VB 10 chromospheric heating by coronal X-rays may in fact work. Indeed, the observed range of (Table 2) is similar to the range of . Thus, the chromospheric and coronal structure of VB 10 is markedly different than that of LSR 1835+32, for which the H luminosity exceeds the X-ray luminosity by at least an order of magnitude, and no evidence for plasma at coronal temperatures exists.
To conclude, the magnetic activity in VB 10 differs significantly from that of LSR 1835+32 and TVLM 513-46546, and is more typical of M0–M6 dwarfs. The X-ray and UV emission are clearly correlated and point to the presence of quiescent and flaring corona and transition region. The optical chromospheric emission exhibits similar timescales and amplitudes of variability, and can be separated into a gradually variable component (Low and High states), and a rapidly flaring component (Flare state) that is marked by higher plasma densities and temperatures.
4. The Possible Role of Rotation
With the increasing sample of ultracool dwarfs observed in the radio and X-rays we can begin to address the physical conditions that underlie the generation of magnetic fields and their influence on the coronae and chromospheres. It is clear from our work that late M dwarfs exhibit a mix of activity patterns in comparison to stars with spectral types F to early M stars, whose magnetic activity is powered by the dynamo. Thus, it is instructive to investigate whether rotation also plays a role in the magnetic activity of ultracool dwarfs.
4.1. X-ray Activity
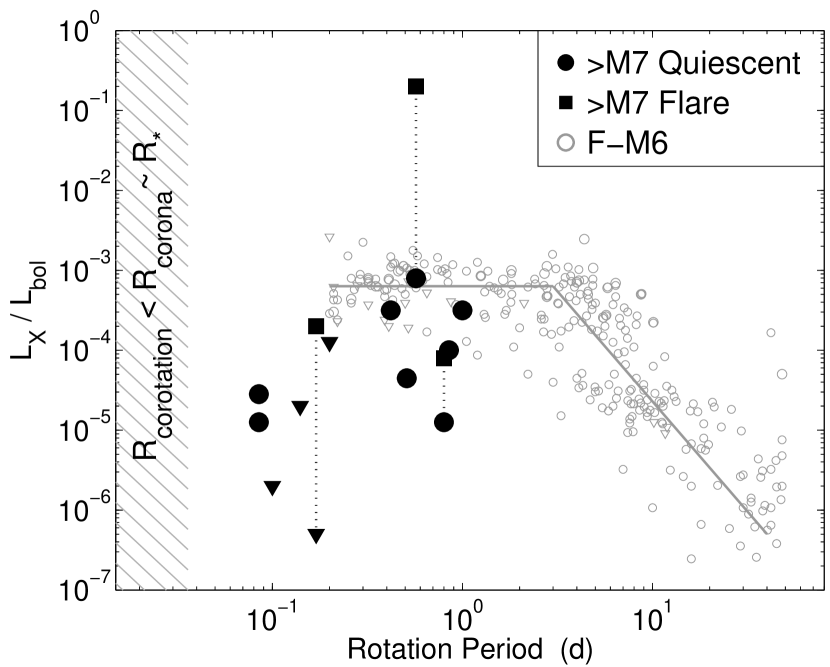
The generation of persistent X-ray emission in F–M stars is still not fully understood, but its correlation with radio activity and rotation velocity suggests that it is directly tied to heating by magnetic field dissipation and particle acceleration. In Figure 10 we show the well-known rotation-activity relation and saturation of for stars with spectral type F–M6. The rotation-activity relation provides evidence for the existence of an dynamo, while three primary explanations have been proposed for the saturation of (see also Güdel 2004). The first is saturation of the dynamo mechanism itself at low Rossby numbers, (e.g., Vilhu 1984); here is the convective turnover time. Second, centrifugal effects in rapid rotators may lead to a circulation pattern that sweeps the magnetic fields from the lower convection zone toward the poles, thereby reducing the field filling factor (Stȩpień et al. 2001).
The third explanation is centrifugal stripping of the corona at the corotation radius666The corotation radius, , is the radius at which the centrifugal and gravitational forces are exactly balanced., (Jardine & Unruh 1999; James et al. 2000). In this scenario, the particle density, , and emission volume, , conspire to produce an emission measure () that is independent of the rotation period, i.e., saturation. However, this balance breaks down when the corotation radius is well inside the corona, , leading to super-saturation – a reduction in at very rapid rotation rates (e.g., James et al. 2000).
It is instructive to study whether the X-ray emission of ultracool dwarfs exhibits saturation and/or super-saturation, and if so, which of the mechanisms described above is responsible for these effects. The values of as a function of rotation period presented here and in Paper I, as well as in the literature, are summarized in Figure 10. Two trends are clear. In the range of rotation periods of d, in which F–M6 stars exhibit saturated emission, for the ultracool dwarfs is a few times smaller than the saturated value of the F–M6 stars. This points to generally weaker coronae in ultracool dwarfs compared to higher mass stars, although in one case an unusually bright flare with was detected (Stelzer et al. 2006). On the other hand, ultracool dwarfs with periods of d ( km s-1) exhibit much lower values of . These include our targets LSR 1835+32 and TVLM 513-46546. The reduction in X-ray activity at high rotation velocities is reminiscent of the super-saturation phenomenon.
In the context of centrifugal stripping, an ultracool dwarf with M⊙ and R⊙ has a corotation radius that is smaller than the coronal radius ( above the photosphere) when hr. This is a factor of two times smaller than the fastest rotators in the sample, with km s-1. This indicates that centrifugal stripping may play a role in reducing for fast rotators only if the the magnetic field is generally dominated by extended loops with , which may indeed be the relevant scale for M dwarfs (e.g., Leto et al. 2000). In the case of LSR 1835+32, TVLM 513-46546 (Paper I), and 2MASS J00361617+1821104 (Berger et al. 2005) we inferred from our radio observations a magnetic field scale of cm, in the rough range required for efficient centrifugal stripping.
Thus, to the extent that existing observations of ultracool dwarfs reveal possible super-saturation in the X-rays, it is presently unclear whether this is due to intrinsic dynamo effects or to the secondary effect of centrifugal stripping. The proposed mechanism of centrifugal clearing of the equatorial plane in rapid rotators (Stȩpień et al. 2001) is not likely to play a role since the persistent radio emission on timescales in several ultracool dwarfs points to fields with order unity covering fractions.
An alternative possibility for the drop in is that the source of coronal heating is different, and much less efficient, than in higher mass stars. This scenario may explain the lower values of in the regime where F–M6 stars are saturated. However, it is unclear why such a scenario should depend on rotation, particularly since the radio emission (i.e., particle acceleration) does not diminish in fast rotators (see §4.2).
We caution that the possibility of super-saturation in the X-rays is based on a small number of objects, and moreover that the effect of centrifugal stripping depends on the magnetic field configuration. Future X-ray observations of additional late M and L dwarfs, as well as the determination of rotation velocities for a larger sample of ultracool dwarfs will reveal whether, and at what rotation velocity, super-saturation may set in present. If confirmed, the value of at which super-saturation occurs may hold a clue to the nature of the dynamo or the dominant physical scale of coronal magnetic loops.
4.2. Radio Activity
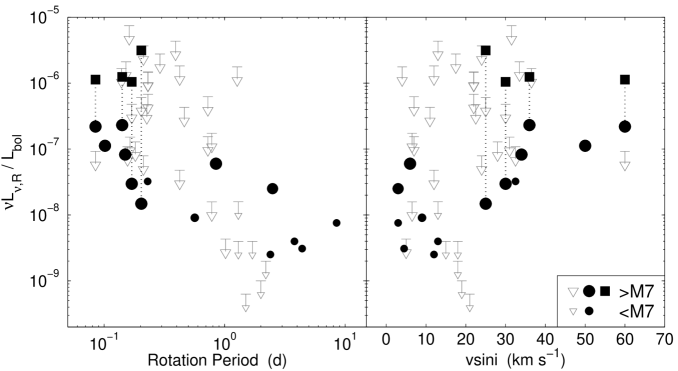
Since radio emission is arguably a more robust tracer of magnetic activity than X-ray emission, we repeat the same exercise for as a function of rotation period and velocity. Berger (2002) noted a possible correlation between radio activity and rotation based on a small sample of ultracool dwarfs, and we re-visit this investigation here. In Figure 11 we plot radio detections and upper limits for objects with a known rotation velocity and period. We find that for objects with spectral type those with km s-1, or hr, exhibit a typical quiescent radio activity, . On the other hand, those with km s-1 have , nearly an order of magnitude larger. If we include objects earlier than M7, the increase in radio activity with rotation velocity becomes even more pronounced, with a typical level of for km s-1.
The majority of the ultracool dwarfs with a known rotation velocity remain undetected in VLA observations with a typical duration of hr, mostly as a result of the decrease in for L and T dwarfs (Figure 11 and Berger 2006). Still, it appears that with the present sample, there is possible evidence for a radio rotation-activity relation, with no evidence for either saturation or super-saturation. This is contrary to the apparent decrease in at km s-1 (§4.1). If confirmed with future observations, the most likely explanation is that the dynamo mechanism is at least partially driven by rotation (even in the presence of full convection), with no apparent saturation at very low Rossby numbers (), contrary to the trend in F–M6 stars.
Regardless of the exact dynamo mechanism there is a clear discrepancy between the radio and X-ray observations in terms of a possible activity-rotation relation and its super-saturation. The lack of clear saturation or super-saturation in the radio indicates that the dynamo itself is not likely to saturate even at high rotation velocities. The possible decline in X-ray activity at km s-1 may thus be the result of secondary effects such as inefficient heating of the plasma to coronal temperatures, or centrifugal stripping of the most extended magnetic loops, with . The former scenario is supported by the observed ratio in the quiescent emission from LSR 1835+32 and TVLM 513-46546, which points to heating of chromospheric plasma by a process other than coronal X-ray emission.
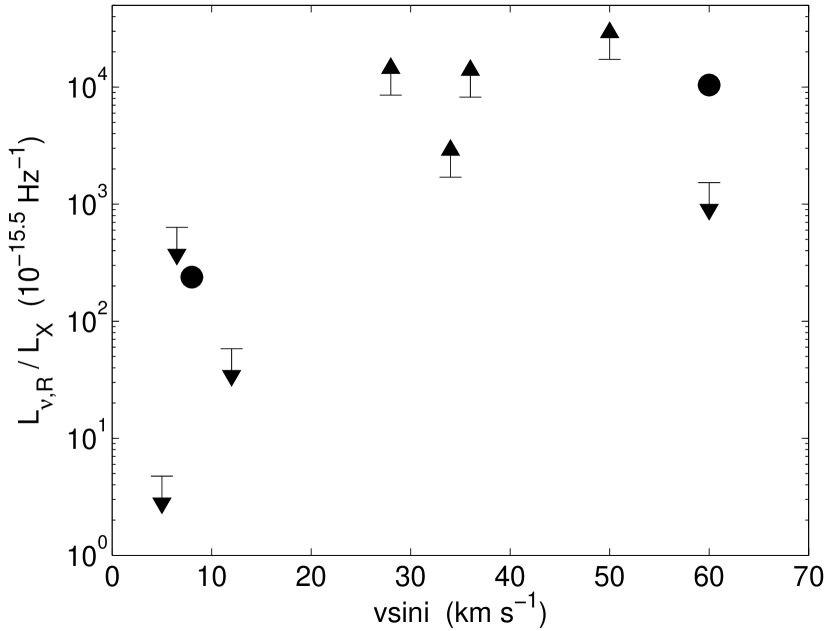
The difference in trends between radio and X-ray activity as a function of rotation velocity may also underlie the violation of the radio/X-ray correlation in ultracool dwarfs (Figure 9). In Figure 12 we plot relative to its standard value in F–M6 stars (; Guedel & Benz 1993) as a function of rotation velocity. We find that objects with km s-1 exhibit a significantly more severe violation of the radio/X-ray correlation than those with slower rotation. It is important to note, however, that rotation alone may not fully account for the excess ratios since even objects with km s-1 may exceed the value of by an order of magnitude or more. Still, it appears that faster rotators generally violate the radio/X-ray correlation by a larger factor.
5. Discussion and Summary
We presented simultaneous multi-wavelength observations of two late M dwarfs to trace the magnetic activity in their outer atmospheres. In the case of LSR 1835+32 (M8.5) we detect persistent radio emission and highly variable H emission. No excess UV emission is detected. Similarly, we detect no X-ray emission to a deep limit of . The ratio of radio to X-ray flux exceeds the average value measured in a wide range of active stars by more than 4 orders of magnitude. Similarly, the ratio exceeds the values measured for M0–M6 dwarfs by at least an order of magnitude, and rules out heating of the quiescent chromosphere by coronal emission.
Temporally, we find no correspondence between the radio and H light curves. This indicates that even if the source of chromospheric heating is magnetic reconnection, it occurs on sufficiently small scales that the overall radio emission does not change by more than . Alternatively, the radio emission produced in conjunction with the H variability may peak at a lower frequency than our 8.5 GHz observations. In the former scenario, our limit on the radio variability during the brightest H episode can be interpreted as a limit of on the chromospheric volume involved in the variable H emission. In the latter scenario, it is possible that the coincident radio emission is dominated by coherent emission at , with kG.
With our measured rotation velocity of km s-1 for LSR 1835+32, the radio observations sample nearly 4 full rotations. The stability of the radio emission thus requires a large-scale and uniform magnetic field, with an inferred strength of G. The similarity in flux to a past observation suggests that the field is stable on year timescales. This may be expected given the long convective turnover time for ultracool dwarfs, on the order of several years.
VB 10, on the other hand, exhibits bright and variable X-ray and UV emission, including a pair of flares and quiescent emission. The behavior in both bands, which trace the corona and transition region, respectively, is highly correlated. From the X-ray spectrum we infer a coronal temperature of about K, with a possible second component at K. The optical emission lines exhibit a similar amplitude and timescale of variability to the X-rays and UV, with two distinct states of gradual and impulsive flaring. The lack of causal relation between the two states points to emission from distinct plasma environments. Moreover, the shallow Balmer decrement and He I emission in the impulsive Flare state require significantly denser and hotter plasma.
Our detailed study of LSR 1835+32, VB 10, and TVLM 513-46546 reveals mixed patterns of of behavior compared to the magnetic activity in F-M6 stars, and thus points to a transition in the atmospheric structure and heating process in the late M dwarf regime. In particular, stellar-scale magnetic fields are present, as evidence by quiescent and uniform radio emission, but the coronae are generally weaker than in early M dwarfs. The chromospheric activity declines less rapidly, and all three targets exhibit a similar range of highly variable H emission, . This range is about an order of magnitude less that the saturated value of mid M dwarfs.
In the standard picture of solar and stellar magnetic flares, the release of magnetic energy through processes such as reconnection leads to acceleration of electrons, and subsequently heating of the chromosphere, transition region, and corona through evaporation of the lower atmosphere. In quiescence, the chromospheres of M0–M6 dwarfs may instead be heated by coronal X-ray emission (Cram 1982), as evidenced by the typical observed ratios of (Cram 1982; Hawley et al. 1996). Such a mechanism is clearly not at play in the case of LSR 1835+32, and most likely TVLM 513-46546, since the chromospheric emission is significantly more energetic than the non-detected corona.
It is possible instead that the source of chromospheric heating is continuous micro-flaring activity, leading to replenishment of chromospheric and transition region plasma by evaporation. In this scenario the weak or absent coronal emission may be due to a limited temperature enhancement of K, which is sufficient to produce chromospheric emission, but no significant soft X-ray emission. The continuously variable H emission in LSR 1835+32 appears to support this idea, and along with the lack of corresponding radio variability points to heating on scales much smaller than the stellar photosphere.
As we noted in §4, it is also possible that rapid rotation in ultracool dwarfs suppresses the X-ray emission through centrifugal stripping. The apparent increase in radio activity with rotation indicates that the dynamo itself does not saturate, at least up to km s-1, which is roughly of the break-up velocity. The effects leading to the apparent super-saturation in the X-rays may also underlie the severe violation of the radio/X-ray correlation since the level of violation appears to be correlated with rotation velocity (Figure 12). We stress that the role of rotation is still speculative due to the small number of objects with X-ray, radio, and rotation measurements. It is therefore crucial to increase the sample of ultracool dwarfs for which these quantities are measured.
To summarize, we conclude that late M dwarfs mark a change in the properties of the magnetic field and its dissipation, as well as the generation of high temperature plasma in the outer atmosphere. The weak X-ray emission, both in relation to and , points to inefficient heating of plasma to coronal temperatures, or alternatively to stripping of the most extended magnetic loops. The lack of temporal correlation between the radio and H activity, however, indicates that even if atmospheric evaporation is taking place, it occurs on smaller physical scale than the overall magnetic field structure.
We end by noting that the use of simultaneous, multi-wavelength, and long duration observations to probe the magnetic activity of individual ultracool dwarfs provides a crucial complement to large single-band surveys. In particular, the long duration and high time resolution data elucidate the range of timescales and amplitudes of gradual and impulsive flares, and can moreover uncover rotationally-induced modulations, as in the case of TVLM 513-46546 (Paper I). In addition, the existence or absence of correlations between the various activity indicators (as in LSR 1835+32 and TVLM 513-46546), and their implications for the magnetic field and its dissipation, could not have been inferred from existing observations. In the upcoming Chandra cycle we will expand our analysis with observations of several L0–L3 dwarfs. These observations will reveal whether the transition in magnetic activity patterns seen in the late M dwarfs continues to lower mass objects, some of which are bona-fide brown dwarfs.
References
- Allard et al. (2001) Allard, F., Hauschildt, P. H., Alexander, D. R., Tamanai, A., & Schweitzer, A. 2001, ApJ, 556, 357
- Allred et al. (2006) Allred, J. C., Hawley, S. L., Abbett, W. P., & Carlsson, M. 2006, ApJ, 644, 484
- Antonova et al. (2007) Antonova, A., Doyle, J. G., Hallinan, G., Golden, A., & Koen, C. 2007, astro-ph/0707.0634
- Aschwanden et al. (2001) Aschwanden, M. J., Poland, A. I., & Rabin, D. M. 2001, ARA&A, 39, 175
- Audard et al. (2007) Audard, M., Osten, R. A., Brown, A., Briggs, K. R., Guedel, M., Hodges-Kluck, E., & Gizis, J. E. 2007, astro-ph/0707.1882
- Benz & Guedel (1994) Benz, A. O., & Guedel, M., 285, 621
- Berger (2002) Berger, E. 2002, ApJ, 572, 503
- Berger (2006) Berger, E. 2006, ApJ, 648, 629
- Berger et al. (2001) Berger, E., et al. 2001, Nature, 410, 338
- Berger et al. (2007) Berger, E., et al. 2007, astro-ph/0708.1511 (Paper I)
- Berger et al. (2005) Berger, E., et al. 2005, ApJ, 627, 960
- Burgasser & Putman (2005) Burgasser, A. J., & Putman, M. E. 2005, ApJ, 626, 486
- Cram (1982) Cram, L. E. 1982, ApJ, 253, 768
- Dulk & Marsh (1982) Dulk, G. A., & Marsh, K. A. 1982, ApJ, 259, 350
- Fleming et al. (2003) Fleming, T. A., Giampapa, M. S., & Garza, D. 2003, ApJ, 594, 982
- Fleming et al. (2000) Fleming, T. A., Giampapa, M. S., & Schmitt, J. H. M. M. 2000, ApJ, 533, 372
- Gizis et al. (2000) Gizis, J. E., Monet, D. G., Reid, I. N., Kirkpatrick, J. D., Liebert, J., & Williams, R. J. 2000, AJ, 120, 1085
- Güdel (2002) Güdel, M. 2002, ARA&A, 40, 217
- Güdel (2004) Güdel, M. 2004, A&A Rev., 12, 71
- Guedel & Benz (1993) Guedel, M., & Benz, A. O. 1993, ApJ, 405, L63
- Hallinan et al. (2007) Hallinan, G., et al. 2007, ApJ, 663, L25
- Hawley et al. (1996) Hawley, S. L., Gizis, J. E., & Reid, I. N. 1996, AJ, 112, 2799
- Hawley & Johns-Krull (2003) Hawley, S. L., & Johns-Krull, C. M. 2003, ApJ, 588, L109
- Hook et al. (2004) Hook, I. M., Jørgensen, I., Allington-Smith, J. R., Davies, R. L., Metcalfe, N., Murowinski, R. G., & Crampton, D. 2004, PASP, 116, 425
- James et al. (2000) James, D. J., Jardine, M. M., Jeffries, R. D., Randich, S., Collier Cameron, A., & Ferreira, M. 2000, MNRAS, 318, 1217
- Jardine & Unruh (1999) Jardine, M., & Unruh, Y. C. 1999, A&A, 346, 883
- Kraft (1967) Kraft, R. P. 1967, ApJ, 150, 551
- Krishnamurthi et al. (1999) Krishnamurthi, A., Leto, G., & Linsky, J. L. 1999, AJ, 118, 1369
- Leto et al. (2000) Leto, G., Pagano, I., Linsky, J. L., Rodonò, M., & Umana, G. 2000, A&A, 359, 1035
- Liebert et al. (2003) Liebert, J., Kirkpatrick, J. D., Cruz, K. L., Reid, I. N., Burgasser, A., Tinney, C. G., & Gizis, J. E. 2003, AJ, 125, 343
- Linsky et al. (1995) Linsky, J. L., Wood, B. E., Brown, A., Giampapa, M. S., & Ambruster, C. 1995, ApJ, 455, 670
- Martín et al. (1999) Martín, E. L., Delfosse, X., Basri, G., Goldman, B., Forveille, T., & Zapatero Osorio, M. R. 1999, AJ, 118, 2466
- Mohanty & Basri (2003) Mohanty, S., & Basri, G. 2003, ApJ, 583, 451
- Narain & Ulmschneider (1996) Narain, U., & Ulmschneider, P. 1996, Space Sci. Rev., 75, 453
- Neupert (1968) Neupert, W. M. 1968, ApJ, 153, L59
- Osten et al. (2006a) Osten, R. A., Hawley, S. L., Allred, J., Johns-Krull, C. M., Brown, A., & Harper, G. M. 2006a, ApJ, 647, 1349
- Osten et al. (2006b) Osten, R. A., Hawley, S. L., Bastian, T. S., & Reid, I. N. 2006b, ApJ, 637, 518
- Pallavicini et al. (1981) Pallavicini, R., Golub, L., Rosner, R., Vaiana, G. S., Ayres, T., & Linsky, J. L. 1981, ApJ, 248, 279
- Parker (1955) Parker, E. N. 1955, ApJ, 122, 293
- Patten et al. (2006) Patten, B. M., et al. 2006, ApJ, 651, 502
- Phan-Bao et al. (2007) Phan-Bao, N., Osten, R. A., Lim, J., Martín, E. L., & Ho, P. T. P. 2007, ApJ, 658, 553
- Pizzolato et al. (2003) Pizzolato, N., Maggio, A., Micela, G., Sciortino, S., & Ventura, P. 2003, A&A, 397, 147
- Reid et al. (2003) Reid, I. N., et al. 2003, AJ, 125, 354
- Reid et al. (1999) Reid, I. N., Kirkpatrick, J. D., Gizis, J. E., & Liebert, J. 1999, ApJ, 527, L105
- Reiners & Basri (2007) Reiners, A., & Basri, G. 2007, ApJ, 656, 1121
- Rutledge et al. (2000) Rutledge, R. E., Basri, G., Martín, E. L., & Bildsten, L. 2000, ApJ, 538, L141
- Stȩpień et al. (2001) Stȩpień, K., Schmitt, J. H. M. M., & Voges, W. 2001, A&A, 370, 157
- Stelzer et al. (2006) Stelzer, B., Schmitt, J. H. M. M., Micela, G., & Liefke, C. 2006, A&A, 460, L35
- Stewart et al. (1988) Stewart, R. T., Innis, J. L., Slee, O. B., Nelson, G. J., & Wright, A. E. 1988, AJ, 96, 371
- Tinney (1996) Tinney, C. G. 1996, MNRAS, 281, 644
- van den Besselaar et al. (2003) van den Besselaar, E. J. M., Raassen, A. J. J., Mewe, R., van der Meer, R. L. J., Güdel, M., & Audard, M. 2003, A&A, 411, 587
- Vilhu (1984) Vilhu, O. 1984, A&A, 133, 117
- Vilhu & Walter (1987) Vilhu, O., & Walter, F. M. 1987, ApJ, 321, 958
- Walkowicz et al. (2004) Walkowicz, L. M., Hawley, S. L., & West, A. A. 2004, PASP, 116, 1105
- West et al. (2004) West, A. A., et al. 2004, AJ, 128, 426
- White et al. (1989) White, S. M., Jackson, P. D., & Kundu, M. R. 1989, ApJS, 71, 895
| Exposure | UT Time | AB Maga |
|---|---|---|
| 1 | 11:08:22–11:31:00 | |
| 2 | 12:32:23–12:49:00 | |
| 3 | 14:08:27–14:36:00 | |
| 4 | 15:44:28–16:12:00 | |
| 5 | 17:21:27–17:49:00 | |
| 3–5 | 14:08:27–17:49:00 | |
| 6 | 18:57:27–19:15:00 |
Note. — a Limits are .
| Low | High | Flare | |||||||
|---|---|---|---|---|---|---|---|---|---|
| Line | EWa | Fluxb | EW | Flux | EW | Flux | |||
| H | 4.3 | 5.2 | 8.6 | 13.3 | 9.0 | 15.1 | |||
| H | 4.8 | 0.5 | 17 | 2.8 | 33 | 8.7 | |||
| H | 9.3 | 0.2 | 31 | 1.6 | 75 | 8.7 | |||
| H | 31 | 1.0 | 95 | 8.0 | |||||
| H+Ca II H | 8.5 | 0.2 | 111 | 1.8 | 83 | 7.8 | |||
| H | 9.1 | 0.3 | 44 | 4.8 | |||||
| Ca II K | 15 | 0.2 | 39 | 1.2 | 26 | 2.5 | |||
| He I | 2.8 | 1.1 | |||||||
| He I | 5.3 | 0.9 | |||||||
| He I | 5.4 | 0.5 | |||||||