Formation of central massive objects via tidal compression
Abstract
For a density that is not too sharply peaked towards the center, the local tidal field becomes compressive in all three directions. Available gas can then collapse and form a cluster of stars in the center, including or even being dominated by a central black hole. We show that for a wide range of (deprojected) Sérsic profiles in a spherical potential, the tidal forces are compressive within a region which encloses most of the corresponding light of observed nuclear clusters in both late-type and early-type galaxies. In such models, tidal forces become disruptive nearly everywhere for relatively large Sérsic indices . We also show that the mass of a central massive object (CMO) required to remove all radial compressive tidal forces scales linearly with the mass of the host galaxy. If CMOs formed in (progenitor) galaxies with , we predict a mass fraction of %, consistent with observations of nuclear clusters and super-massive black holes. While we find that tidal compression possibly drives the formation of CMOs in galaxies, beyond the central regions and on larger scales in clusters disruptive tidal forces might contribute to prevent gas from cooling.
1 Introduction
It is now well-known that the masses of supermassive black holes (SMBHs) in the centres of galaxies and bulges correlate with the stellar velocity dispersion, with (e.g. Ferrarese & Merritt, 2000; Gebhardt et al., 2000; Tremaine et al., 2002), as well as nearly linearly with the mass of these spheroids, (e.g. Merritt & Ferrarese, 2001; Häring & Rix, 2004). Ferrarese et al. (2006a), Wehner & Harris (2006) and Rossa et al. (2006) also found that the masses of nuclear (star) clusters (NCs), which are present in many both late and early-type galaxies (see, e.g. Böker et al., 2002; Côté et al., 2006), are similarly related to the properties of the host galaxy (see also Graham & Driver, 2007). Recently, McLaughlin et al. (2006) proposed momentum feedback, from accretion onto SMBHs or from stellar and supernovae winds in the case of NCs, as an explanation for the observed relations.
We investigate if central massive objects (CMOs), in the form of NCs, may have formed from gas being tidally compressed in the centers of galaxies. This effect, resembling compressive shocking of globular clusters by the Galactic disk (Ostriker et al., 1972), has been studied by Valluri (1993) in the context of tidal compression of a (disk) galaxy in the core of galaxy cluster. At the scale of galaxies, Das & Jog (1999) argue for tidal compression of molecular clouds in the centers of flat-core early-type galaxies and ultraluminous galaxies as an explanation for the presence of observed dense gas. Very recently, an independent study by Masi (2007) emphasised the potential importance of compressive tidal forces.
Low luminosity early-type galaxies and late-type galaxies share an overall luminosity profile with relatively low central power-law slopes. The fact that NCs are predominantly found in such galaxies (see e.g. Côté et al., 2006) may provide an interesting link between the presence of CMOs in galaxies and the properties of the host galaxy. In the present study, we investigate whether tidal forces may help explaining this link. We first derive the radial component of the tidal force associated with a (deprojected) Sérsic profile in § 2. We then examine in § 3 how this applies to simple models of CMO hosts, including early-type and late-type galaxies. The corresponding results are then briefly discussed in § 4, and conclusions are drawn in § 5.
2 Tidal compression
The radial component of the tidal field in a spherical potential is given by
| (1) |
at a distance from the position at radius about which the gravitational field is expanded to first order. This radial component is compressive () if the local density is larger than of the mean density within the radius . The two components perpendicular to the radial direction are always compressive, but with varying magnitude, so that the tidal field is generally anisotropic. However, since the compression of a gas cloud tends to become rapidly isotropic, we only consider the radial component (see also Das & Jog, 1999).
2.1 Density profiles
It is today well-known that the surface brightness profiles of early-type galaxies as well as bulges are overall well fitted by a Sérsic (1963; 1968) profile
| (2) |
with the surface brightness at the half-light radius , and a constant that depends on the index . The latter follows by solving , with the gamma function, but to high precision can be approximated by (Ciotti & Bertin, 1999).
The deprojection of the Sérsic profile (assuming spherical symmetry) has to be done numerically (Ciotti, 1991). However, the analytic density profile of Prugniel & Simien (1997)
| (3) |
provides in projection a good match111Although not significant, please note that there is a typo in the expression of in most published papers (with instead of ), the best fit as given in Lima Neto et al. (1999) being the one mentioned here. to the Sérsic profile when and a constant (stellar) mass-to-light ratio is assumed. When , the density profile reduces to the ‘intrinsic’ Sérsic profile, also known as Einasto’s model (see Einasto & Haud, 1989, and references therein). Recently, it has been shown that both the Prugniel-Simien and Einasto models provide a very good fit to simulated dark matter halos, better than a (generalized) NFW profile (e.g. Merritt et al., 2006).
The Prugniel-Simien profile is a reasonable approximation for the deprojected Sérsic profile for a relatively wide range of values of (Márquez et al., 2000), but not as accurate as originally claimed. Trujillo et al. (2002) proposed a much improved expression using modified Bessel functions, with relative errors less than % in the radial range for . We extended their expression to
| (4) |
where is the (constant) mass-to-light ratio and is the th-order modified Bessel function of the third kind. The fitting parameters are , and the coefficients () of the th-order polynomial in . With a cubic polynomial (), this approximation results in a fit with residuals still of the order of % or (often significantly) less, but this time for all values between (see Appendix A for details). It surpasses (by a factor ) the Prugniel-Simien profile.
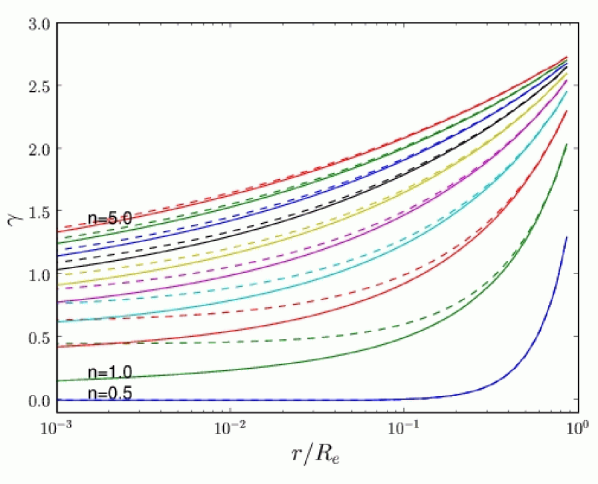
In the following, we favour Eq. 4 as approximation for the intrinsic density , but also consider the Prugniel-Simien profile in Eq. 3. To compute in Eq. 1 for the radial component of the tidal field, we also need the enclosed mass , which in case of the Prugniel-Simien profile reduces to , with the incomplete gamma function. The latter should not be confused with the (negative) slope of the density , which for the Prugniel-Simien model becomes . In Fig. 1, we present for both cases out to the effective radius. For large values of (), there is no significant difference in the values of for , but for lower values of , the Prugniel-Simien profile tends to have slightly larger slopes at small radii.
2.2 Tidal field
For a spherical model with an average density , we have and the radial component of the tidal field is then proportional to : it is therefore negative (compressive) only when . This becomes less straightforward when varies with radius, but Fig. 1 still suggests that we should expect compressive tidal forces for Sérsic indices at least within . For a typical galaxy, the latter corresponds to a few pc and is similar to the smallest observed half-light radii of NCs (see also Fig. 3).
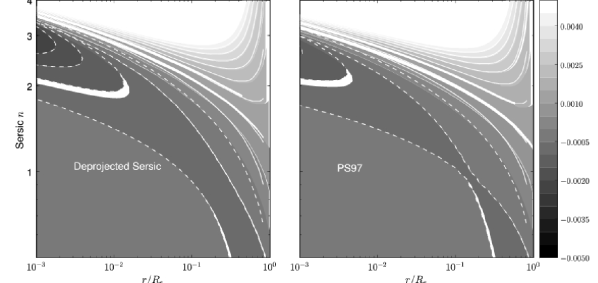
This is confirmed in Fig. 2, where we show the radial component of the tidal field (per unit mass) for different values of the Sérsic index . Both the deprojected Sérsic approximation in Eq. 4 (left panel) and the Prugniel-Simien profile in Eq. 3 (right panel) yield similar behaviour: is found only for given the same minimum radius of as above, and given as minimum Sérsic index that of an exponential disk (). Between these limits, there is a range in radii from the center to a truncation radius , within which the tidal field is compressive. Within this range, the radius at which the radial force reaches its minimum, increases with decreasing index, with a reasonably good approximation given by .
For the Prugniel-Simien profile, corresponds to . As expected, forcing the latter inner slope to small values (e.g., ) implies that the tidal forces are compressive for rather large and for a larger radial range at a given . For , the radial tidal force per unit mass is obviously positive everywhere.
3 Scaling relations
The above analysis shows that the inner slope , which is a function of the Sérsic index , determines the truncation radius within which there exists compressive tidal forces. If we now assume that these negative tidal forces play a role to trigger star formation from passing-by molecular clouds, we can expect that provides a scaling for the size of the CMO as function of and .
3.1 Truncation radius
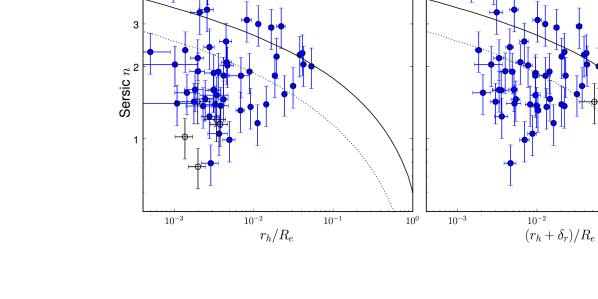
For 51 early-type galaxies in the Virgo cluster, Ferrarese et al. (2006b) and Côté et al. (2006) have detected a central NC, for which they measured the half-light radius , as well as the Sérsic parameters and of their host galaxy. They have also included the characteristics of 5 NCs which were detected but offset from the photometric centre: in these five cases, the bright NCs were located within about 5″ from the centre. In the left panel of Fig. 3, we show versus of the observed NCs, as compared to the truncation radius for the deprojected Sérsic profile. In the right panel, we also take into account the offsets measured by Côté et al. (2006), which clearly emphasises the 5 special cases mentioned above (for the other NCs, the addition of does not significantly change their position in the diagram).
Only two NCs (in NGC 4578 and NGC 4612) are significantly outside the presumed region where compressive tidal forces exist. Remarkably, the five offset NCs lie within that region too, rather close to the radius of minimum (negative) compressive tidal force, when including their apparent position with respect to the galaxy centre. This indicates that the stars in these clusters may have formed in a region where the tidal forces were negative, or moved via dynamical friction within that region since their formation with typical timescales of the order of a few hundreds Myr. Moreover, as we argue below, especially the old NCs in early-type galaxies might have already formed in their possibly gas-rich and spiral-like progenitors with Sérsic index values lower than the currently measured values. As a result, this can move the points in Fig. 3 downwards more into the region of compressive tidal forces, and, at the same time, the variation in progenitors as well as merging history might contribute to the large scatter observed.
3.2 Central mass
The presence of an additional (compact) CMO in a galaxy increases the averaged mass density (see Eq. 1), and therefore directly reduces the size of the radial region where tidal forces are compressive. Henceforth, given a host galaxy with Sérsic parameters , , and (or total luminosity ) and mass-to-light ratio , there is therefore a mass above which the radial tidal force becomes positive (disruptive) everywhere. When adding a central mass intermediate between 0 and , negative values are restricted to a ring-like region. Offset stellar nuclei could form there, and subsequently take significant time before being dragged into the centre via dynamical friction. For large Sérsic index , since is already positive nearly everywhere. For , we (numerically) derive from the maximum of , and corresponding luminosity for a given mass-to-light ratio of the CMO. When , the mass-to-light ratio cancels out and we obtain directly for given , and of the host galaxy.
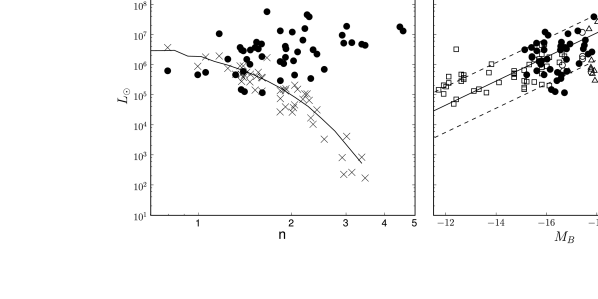
Adopting the latter assumption, we compute corresponding to the measured parameters for each of the Virgo early-type galaxies studied by Ferrarese et al. (2006b) and Côté et al. (2006). In Fig. 4, we show the resulting values (crosses) together with the measured luminosity of the observed NCs (Côté et al., 2006) versus and of the host galaxy (left and right panel, respectively). The solid line in the left panel shows the prediction of as function of based on empirical scaling relations of galaxies. Here we use the global correlations derived in Andredakis et al. (1995) and Graham (2001) to obtain and (for in kpc) . For a given (-band) luminosity of the host galaxy these relations provide us with a pair of and , so that together they yield an estimate of . Although these relations significantly differ from and derived by Ferrarese et al. (2006b) for Virgo early-type galaxies, they are still consistent with the observed measurements, and have the advantage to also fit the observed correlation for spiral bulges.
For large values of , the predicted are much smaller than the observed CMO luminosities , as expected. Only for values of , the predicted are in the same luminosity range as the corresponding observed values. In the right panel, we have added samples of NCs observed in dwarf ellipticals (Lotz et al., 2004) (empty squares), in early-type spirals by Carollo et al. (2002) (empty triangles) and in late-type spiral galaxies by Rossa et al. (2006) (empty circles). Again we see that the predicted are much lower than the observed values in early-type galaxies, except for faint galaxies with around . Although we do not know the Sérsic index associated with the spiral and dwarf elliptical hosts of observed NCs, we can safely assume that it should be low with being a good approximation for the overall surface brightness profile. It is interesting to note that most spiral NCs lie below the curve with , and all of them are below the one with .
4 Discussion
The frequency of occurence of NCs in both intermediate luminosity early-type galaxies, and in spiral galaxies is reported to be between about 60 and 80 % (Carollo et al., 1998, 2002; Böker et al., 2002; Côté et al., 2006; Balcells et al., 2007a). For nearly all galaxies in the samples mentioned above, the observed nuclear clusters have individual luminosities in a range similar to (for early-type galaxies and dwarfs ellipticals) or lower than (for spirals) the values derived from the total galaxy luminosity, considering that each NC and its host galaxy have the same mass-to-light ratio, and assuming a spherical model with (exponential profile).
Even though the density distribution of most galaxies is clearly not spherical, the tidal forces are determined by their gravitational potential, which in general is significantly rounder than the density, even for spiral galaxies. For example, an axisymmetric logarithmic potential, which is only about a third as flattened as the corresponding density distribution (e.g. § 2.2.2 of Binney & Tremaine, 1987), lowers the predicted values by a factor of about two if the flattening of the potential is reduced from unity (sphere) to one-half (disk). The latter would then only shift down the lines at fixed shown in Fig. 4 by dex.
The assumption of equal mass-to-light ratio between NC and host galaxy might have a stronger effect. NCs are sometimes relatively bluer than their host galaxies (e.g., in late-type spiral galaxies), so that we can expect (by a factor of 1 to 10, see e.g. Böker et al., 2004). This implies that most of these NCs have masses which would in fact lie even lower, with respect to the predictions of , than presently illustrated in Fig. 4. On the other hand, their host galaxies typically have and are gas-rich, so that one might expect ongoing star formation driven by the significant tidal compression. Indeed, late-type spiral galaxies seem to witness recurrent star formation in their central regions and most of the NCs observed in these galaxies correspond to multiple formation episodes. Henceforth, the NC might be still building up its mass towards the predicted value. Moreover, the youngest population of stars likely dominates the total light of the cluster and hence the (measured) mass-to-light ratio , but contributes (much) less to its mass (e.g. Walcher et al., 2006; Rossa et al., 2006). Finally, the seemingly strong link between the luminosity (and mass) of the NC and its host galaxy might only hold true for the centrally dominating spheroidal component (e.g. Rossa et al., 2006; Wehner & Harris, 2006). Whereas in early-type galaxies the spheroidal component dominates (the light of) the galaxy, the bulge-to-total-light ratio decreases significantly towards later-type galaxies, with already for lenticular (S0) and early-type spiral (Sa) galaxies (e.g. Balcells et al., 2007b) and for later-type spiral galaxies (e.g. Graham, 2001). As a result, if instead of the total luminosity, we compare in the right panel of Fig. 4 with the spheroidal luminosity, we expect the NCs in the spiral galaxies to move by a maximum of dex to the left, i.e., closer to the predicted line for . Also, this implies that nearly all NCs appear in spheroids fainter than , consistent with the transition between NCs and SMBHs as emphasised by Côté et al. (2006) and Ferrarese et al. (2006a).
Although might be similar to the stellar mass-to-light ratio of the host galaxy (especially in early-type galaxies with old stellar populations), its total mass-to-light ratio might be different and vary among galaxies due to a contribution from possible dark matter. The tilt of the Fundamental Plane of elliptical galaxies implies (e.g. Jorgensen et al., 1996), so that . This results in a steeper slope in the right panel of Fig. 4 compared to the predicted relations (solid and dashed lines), and similarly a shallower slope if decreases with . There is an indication that the NCs in observed early-type galaxies (filled circles) indeed follow a slightly steeper slope. The NCs in late-type spirals (open circles) and dwarf ellipticals (open squares) seem to indicate a shallower slope, consistent with the corresponding correlations and derived by Böker et al. (2004) and Graham & Guzmán (2003), respectively. In all cases, when converting from luminosities to masses the slope approaches unity (see also Ferrarese et al., 2006a; Wehner & Harris, 2006), consistently with the predicted linear scaling of with at fixed .
In other words, if we, from now on, assume that all these observed NCs originated in host galaxies with nearly exponential surface brightness profiles (), they would have formed in the presence of compressive tidal forces. The amplitude of these compressive tidal forces directly scales with the total mass of the host galaxy (or with the component which dominates the central mass profile). For the models described above, thus linearly scales with the host mass at fixed . If compressive tidal forces dictate the efficiency of the triggering of star formation in the central regions of such galaxies, they would impose a direct linear scaling between the mass of the formed NCs and the host mass. By changing the Sérsic index of the models, we obviously shift the relation between and , predicting lower for a larger at a given . For a deprojected Sérsic profile, we find , which implies a ratio of % for . Côté et al. (2006) mention a typical ratio of nucleus-to-galaxy luminosity of %, and Ferrarese et al. (2006a) a corresponding mass ratio of % for CMOs (NCs and SMBHs) in early-type galaxies. The corresponding Sérsic index are respectively and , i.e., close to unity in both cases.
The picture in which NCs form in galaxy hosts with seems appropriate for spiral galaxies (see Seth et al., 2006), but low-luminosity early-type galaxies have values as high as . NCs in early-type galaxies, like the ones observed by Côté et al. (2006) are red and old. Since elliptical and S0 galaxies are thought to have assembled a significant fraction of their mass via galaxy mergers, we speculate that NCs in early-type galaxies may not have formed in their present hosts, but in their progenitors, which may very well have had a less massive spheroidal component and a lower Sérsic index (e.g., Aguerri et al., 2001; Naab & Trujillo, 2006). This is also supported by recent cosmological merger simulations, in which today’s elliptical galaxies had to form early-on through the mergers of gas-rich spiral galaxies to explain the tilt in the Fundamental Plane (e.g., Robertson et al., 2006).
Around 20-30% of spirals and early-type galaxies do not show any evidence of an NC (Böker et al., 2002). Especially in spiral galaxies, this is unlikely due to a lack of gas fuel, but the presence of an already existing central (dark) mass might suppress the radial tidal compressive forces throughout the central region. Remarkably, spirals without observed NCs tend to show a flattening of the surface brightness profiles towards the centre, reminiscent of the cores observed in giant ellipticals.
In addition to the surface brightness of galaxies, Merritt et al. (2006) show that the (deprojected) Sérsic profile also provides a very good fit to their (simulated) dark matter halos with , as well as those at the scales of clusters with . Apart from the (very) center, we thus expect nearly everywhere disruptive tidal forces which work against (efficient) formation of stars from collapsing gas. Whereas in the outer parts of early-type galaxies there is hardly any gas available, in the intracluster medium of clusters the tidal forces might contribute in preventing the gas from cooling. Finally, we should note that the existence of NCs in galaxies where dark matter is expected to dominate in the central regions (e.g., some dwarf galaxies) may imply that their corresponding dark matter halos cannot exhibit very cuspy central profiles, or that another mechanism prevailed during their formation (if the NCs formed in situ).
5 Conclusions
We have built simple spherical models following deprojected Sérsic profiles to show that compressive tidal forces are naturally present in the central region when the Sérsic index . For , the radial component of the tidal forces is disruptive almost everywhere (i.e., for ). Observed nuclear (star) clusters in early-type and late-type galaxies have extents and/or apparent locations which are within the tidally compressed region.
If we assume that most NCs form when their host galaxies have density profiles corresponding to rather low Sérsic indices , we have shown that the masses of the NCs are consistent with , the mass above which the radial tidal force becomes disruptive due the presence of the central massive object. In this picture, the predicted scales linearly with the host galaxy mass (or the mass of the spheroidal component) with % for , in agreement with what is observed for both NCs and super-massive black holes in the centers of (more luminous) galaxies. If indeed compressive tidal forces are a key actor in the formation of CMOs, only late-type galaxies have, today, the required gas content and density profiles (), which allow the recurrent and common formation of CMOs (in the form of NCs). This is consistent with the fact that young NCs are predominantly found in late-type spiral galaxies. Finally, while we find that tidal compression possibly drives the formation of CMOs in galaxies, beyond the central regions and on larger scales in clusters disruptive tidal forces might contribute to prevent gas from cooling.
Such a simple scenario must be tested and extended to accomodate galaxies with e.g., core-Sersic surface brightness profiles (see e.g. Ferrarese et al., 2006b) as well as to allow more realistic (non-spherical, multi-component) galaxy models. Moreover, using specific (stellar) mass-to-light ratios for the NCs and virial mass estimates for the host galaxy enables a direct comparison in mass instead of luminosity. Finally, hydrodynamical simulations are needed to examine the role of compressive tidal forces in the evolution of galaxies (and cluster).
Acknowledgments
We thank an anonymous referee for a constructive report which helped clarifying the text. We would like to sincerely thank Jesús Falcón–Barroso, Torsten Böker, Pierre Ferruit, Alister Graham, Richard McDermid, Emmanuel Pécontal and Scott Tremaine for useful discussions. GvdV acknowledges support provided by NASA through Hubble Fellowship grant HST-HF-01202.01-A awarded by the Space Telescope Science Institute, which is operated by the Association of Universities for Research in Astronomy, Inc., for NASA, under contract NAS 5-26555.
References
- Aguerri et al. (2001) Aguerri, J. A. L., Balcells, M., & Peletier, R. F. 2001, A&A, 367, 428
- Andredakis et al. (1995) Andredakis, Y. C., Peletier, R. F., & Balcells, M. 1995, MNRAS, 275, 874
- Balcells et al. (2007a) Balcells, M., Graham, A. W., & Peletier, R. F. 2007a, ApJ, 665, 1084
- Balcells et al. (2007b) —. 2007b, ApJ, 665, 1104
- Binney & Tremaine (1987) Binney, J. & Tremaine, S. 1987, Galactic Dynamics (Princeton, NJ, Princeton University Press)
- Böker et al. (2002) Böker, T., Laine, S., van der Marel, R. P., Sarzi, M., Rix, H.-W., Ho, L. C., & Shields, J. C. 2002, AJ, 123, 1389
- Böker et al. (2004) Böker, T., Sarzi, M., McLaughlin, D. E., van der Marel, R. P., Rix, H.-W., Ho, L. C., & Shields, J. C. 2004, AJ, 127, 105
- Carollo et al. (1998) Carollo, C. M., Stiavelli, M., & Mack, J. 1998, AJ, 116, 68
- Carollo et al. (2002) Carollo, C. M., Stiavelli, M., Seigar, M., de Zeeuw, P. T., & Dejonghe, H. 2002, AJ, 123, 159
- Ciotti (1991) Ciotti, L. 1991, A&A, 249, 99
- Ciotti & Bertin (1999) Ciotti, L. & Bertin, G. 1999, A&A, 352, 447
- Côté et al. (2006) Côté, P., Piatek, S., Ferrarese, L., Jordán, A., Merritt, D., Peng, E. W., Haşegan, M., Blakeslee, J. P., Mei, S., West, M. J., Milosavljević, M., & Tonry, J. L. 2006, ApJS, 165, 57
- Das & Jog (1999) Das, M. & Jog, C. J. 1999, ApJ, 527, 600
- Einasto & Haud (1989) Einasto, J. & Haud, U. 1989, A&A, 223, 89
- Ferrarese et al. (2006a) Ferrarese, L., Côté, P., Dalla Bontà, E., Peng, E. W., Merritt, D., Jordán, A., Blakeslee, J. P., Haşegan, M., Mei, S., Piatek, S., Tonry, J. L., & West, M. J. 2006a, ApJ, 644, L21
- Ferrarese et al. (2006b) Ferrarese, L., Côté, P., Jordán, A., Peng, E. W., Blakeslee, J. P., Piatek, S., Mei, S., Merritt, D., Milosavljević, M., Tonry, J. L., & West, M. J. 2006b, ApJS, 164, 334
- Ferrarese & Merritt (2000) Ferrarese, L. & Merritt, D. 2000, ApJ, 539, L9
- Gebhardt et al. (2000) Gebhardt, K., Bender, R., Bower, G., Dressler, A., Faber, S. M., Filippenko, A. V., Green, R., Grillmair, C., Ho, L. C., Kormendy, J., Lauer, T. R., Magorrian, J., Pinkney, J., Richstone, D., & Tremaine, S. 2000, ApJ, 539, L13
- Graham (2001) Graham, A. W. 2001, AJ, 121, 820
- Graham & Driver (2007) Graham, A. W. & Driver, S. P. 2007, ApJ, 655, 77
- Graham & Guzmán (2003) Graham, A. W. & Guzmán, R. 2003, AJ, 125, 2936
- Häring & Rix (2004) Häring, N. & Rix, H.-W. 2004, ApJ, 604, L89
- Jorgensen et al. (1996) Jorgensen, I., Franx, M., & Kjaergaard, P. 1996, MNRAS, 280, 167
- Lima Neto et al. (1999) Lima Neto, G. B., Gerbal, D., & Márquez, I. 1999, MNRAS, 309, 481
- Lotz et al. (2004) Lotz, J. M., Miller, B. W., & Ferguson, H. C. 2004, ApJ, 613, 262
- Márquez et al. (2000) Márquez, I., Lima Neto, G. B., Capelato, H., Durret, F., & Gerbal, D. 2000, A&A, 353, 873
- Masi (2007) Masi, M. 2007, American Journal of Physics, 75, 116
- McLaughlin et al. (2006) McLaughlin, D. E., King, A. R., & Nayakshin, S. 2006, ApJ, 650, L37
- Merritt & Ferrarese (2001) Merritt, D. & Ferrarese, L. 2001, MNRAS, 320, L30
- Merritt et al. (2006) Merritt, D., Graham, A. W., Moore, B., Diemand, J., & Terzić, B. 2006, AJ, 132, 2685
- Naab & Trujillo (2006) Naab, T. & Trujillo, I. 2006, MNRAS, 369, 625
- Ostriker et al. (1972) Ostriker, J. P., Spitzer, L. J., & Chevalier, R. A. 1972, ApJ, 176, L51+
- Prugniel & Simien (1997) Prugniel, P. & Simien, F. 1997, A&A, 321, 111
- Robertson et al. (2006) Robertson, B., Cox, T. J., Hernquist, L., Franx, M., Hopkins, P. F., Martini, P., & Springel, V. 2006, ApJ, 641, 21
- Rossa et al. (2006) Rossa, J., van der Marel, R. P., Böker, T., Gerssen, J., Ho, L. C., Rix, H.-W., Shields, J. C., & Walcher, C.-J. 2006, AJ, 132, 1074
- Sérsic (1963) Sérsic, J. L. 1963, Boletin de la Asociacion Argentina de Astronomia La Plata Argentina, 6, 41
- Sérsic (1968) —. 1968, Atlas de galaxias australes (Cordoba, Argentina: Observatorio Astronomico, 1968)
- Seth et al. (2006) Seth, A. C., Dalcanton, J. J., Hodge, P. W., & Debattista, V. P. 2006, AJ, 132, 2539
- Tremaine et al. (2002) Tremaine, S., Gebhardt, K., Bender, R., Bower, G., Dressler, A., Faber, S. M., Filippenko, A. V., Green, R., Grillmair, C., Ho, L. C., Kormendy, J., Lauer, T. R., Magorrian, J., Pinkney, J., & Richstone, D. 2002, ApJ, 574, 740
- Trujillo et al. (2002) Trujillo, I., Asensio Ramos, A., Rubiño-Martín, J. A., Graham, A. W., Aguerri, J. A. L., Cepa, J., & Gutiérrez, C. M. 2002, MNRAS, 333, 510
- Valluri (1993) Valluri, M. 1993, ApJ, 408, 57
- Walcher et al. (2006) Walcher, C. J., Böker, T., Charlot, S., Ho, L. C., Rix, H.-W., Rossa, J., Shields, J. C., & van der Marel, R. P. 2006, ApJ, 649, 692
- Wehner & Harris (2006) Wehner, E. H. & Harris, W. E. 2006, ApJ, 644, L17
Appendix A Deprojected Sérsic profiles
The deprojection of the Sérsic profile (assuming spherical symmetry) can be solved through an Abel integral equation. This yields for the (intrinsic) density
| (A1) |
where is the (constant) mass-to-light ratio. Substituting gives
| (A2) |
where . In general, this integral has to be solved numerically.
However, for it reduces to , with the th-order modified Bessel function of the third kind. For , using , the integral becomes . For other values of , the density is very well approximated by
| (A3) |
with fitting parameters , and coefficients () of the th-order polynomial in . Trujillo et al. (2002) showed that for a parabolic polynomial () already provides relative errors less than 0.1 % in the radial range . For (and also ), a cubic polynomial () is needed to obtain a similarly good fit. The corresponding best-fit parameters for a range of profiles with are provided in Table 1.
| (1) | (2) | (3) | (4) | (5) | (6) | (7) | (8) |
|---|---|---|---|---|---|---|---|
| 0.5 | 0.50000 | 1.00000 | 0.00000 | 0.00000 | 0.00000 | 0.00000 | 0.00000 |
| 0.6 | 0.47768 | 0.85417 | -0.03567 | 0.26899 | -0.09016 | 0.03993 | 0.17568 |
| 0.7 | 0.44879 | 0.94685 | -0.04808 | 0.10571 | -0.06893 | 0.03363 | 0.16713 |
| 0.8 | 0.39831 | 1.04467 | -0.04315 | 0.01763 | -0.04971 | 0.02216 | 0.11766 |
| 0.9 | 0.25858 | 2.55052 | -0.01879 | -0.39382 | -0.08828 | -0.00797 | 0.04783 |
| 1.0 | 0.00000 | 0.00000 | 0.00000 | 0.00000 | 0.00000 | 0.00000 | 0.00000 |
| 1.1 | 0.15502 | 1.59086 | 0.00041 | 0.15211 | -0.03341 | 0.00899 | 0.07371 |
| 1.2 | 0.25699 | 1.00670 | 0.00069 | 0.05665 | -0.03964 | 0.01172 | 0.07741 |
| 1.3 | 0.30896 | 0.88866 | 0.00639 | 0.00933 | -0.04456 | 0.01150 | 0.06961 |
| 1.4 | 0.35245 | 0.83763 | 0.01405 | -0.02791 | -0.04775 | 0.01026 | 0.05948 |
| 1.5 | 0.39119 | 0.81030 | 0.02294 | -0.05876 | -0.04984 | 0.00860 | 0.04964 |
| 2.0 | 0.51822 | 0.76108 | 0.07814 | -0.16720 | -0.05381 | -0.00000 | 0.02943 |
| 2.5 | 0.53678 | 0.83093 | 0.13994 | -0.13033 | -0.03570 | -0.00000 | 0.02576 |
| 3.0 | 0.54984 | 0.86863 | 0.19278 | -0.10455 | -0.02476 | 0.00000 | 0.01790 |
| 3.5 | 0.55847 | 0.89233 | 0.23793 | -0.08618 | -0.01789 | -0.00000 | 0.01233 |
| 4.0 | 0.56395 | 0.90909 | 0.27678 | -0.07208 | -0.01333 | 0.00000 | 0.00865 |
| 4.5 | 0.57054 | 0.92097 | 0.31039 | -0.06179 | -0.01028 | -0.00000 | 0.00587 |
| 5.0 | 0.57950 | 0.93007 | 0.33974 | -0.05369 | -0.00812 | -0.00000 | 0.00386 |
| 5.5 | 0.58402 | 0.93735 | 0.36585 | -0.04715 | -0.00653 | -0.00000 | 0.00277 |
| 6.0 | 0.58765 | 0.94332 | 0.38917 | -0.04176 | -0.00534 | -0.00000 | 0.00203 |
| 6.5 | 0.59512 | 0.94813 | 0.41003 | -0.03742 | -0.00444 | -0.00000 | 0.00145 |
| 7.0 | 0.60214 | 0.95193 | 0.42891 | -0.03408 | -0.00376 | -0.00000 | 0.00105 |
| 7.5 | 0.60469 | 0.95557 | 0.44621 | -0.03081 | -0.00319 | -0.00000 | 0.00082 |
| 8.0 | 0.61143 | 0.95864 | 0.46195 | -0.02808 | -0.00274 | -0.00000 | 0.00061 |
| 8.5 | 0.61789 | 0.96107 | 0.47644 | -0.02599 | -0.00238 | -0.00000 | 0.00047 |
| 9.0 | 0.62443 | 0.96360 | 0.48982 | -0.02375 | -0.00207 | -0.00000 | 0.00036 |
| 9.5 | 0.63097 | 0.96570 | 0.50223 | -0.02194 | -0.00182 | -0.00000 | 0.00028 |
| 10.0 | 0.63694 | 0.96788 | 0.51379 | -0.02004 | -0.00160 | 0.00000 | 0.00022 |