Radiation Damage Study for PHENIX Silicon Stripixel Sensors
Abstract
Silicon stripixel sensors which were developed at BNL will be installed as part of the RHIC-PHENIX silicon vertex tracker (VTX). RHIC II operations provide luminosity up to 21032 cm-2s-1 so the silicon stripixel sensors will be exposed to a significant amount of radiation. The most problematic radiation effect for VTX is the increase of leakage current, which degrades the signal to noise ratio and may saturate the readout electronics.
We studied the radiation damage using the same diodes as CERN-RD48. First, the proportionality between the irradiation fluence and the increase of leakage current of CERN-RD48 was reproduced. Then beam experiments with stripixel sensor were done in which leakage current was found to increase in the same way as that of the reference diode.
A stripixel sensor was also irradiated at the PHENIX interaction region (IR) during the 2006 run. We found the same relation between the integrated luminosity and determined fluence from increase of leakage current. The expected fluence is 3-61012 /cm2 (1 MeV neutron equivalent) in RHIC II operations for 10 years. Due to this expected exposure, setting the operating temperature in PHENIX to T to suppress leakage current is needed to avoid saturation of preamplifiers.
keywords:
silicon , stripixel , radiation damage , VTX , RHIC , PHENIX, , , , , , , , , , , , , , , , , , , , , , , , ,
1 Introduction
The PHENIX experiment [2] at the Relativistic Heavy Ion Collider (RHIC) at Brook-haven National Laboratory (BNL) has been successful in investigating new forms of matter in heavy-ion reactions and the spin structure of the nucleon in polarized p+p collisions at highly relativistic energies[3]. However, the current PHENIX detector configuration has limited capability in identifying heavy quarks and parton jets. These probes are important for understanding heavy ion and spin physics. The PHENIX VTX upgrade can enhance the physics capabilities of our detector in order to gain better access to these channels.
Efficient topological reconstruction of open charm decays requires a good tracking ’point-back’ resolution to the primary collision vertex. Further, the beam pipe and innermost layers of detector must be very thin and as close to the beam as possible to allow measurement of particles at low transverse momentum, which comprise the bulk of the cross section. A thin beam pipe and inner detector layers are also key elements in efficiently vetoing photon conversion electrons, which in combination with electron identification from the PHENIX central-arm spectrometer ( 0.35) will enable much improved measurement of heavy quark weak decays. Sensitivity of the present combined measurements of bottom and charm quarks will be improved by the central silicon vertex tracker [4], which will allow us to separate charm and bottom quarks, in addition to separating them from light flavor quarks.
In the QCD picture, the proton is made from valence quarks, a sea of the quark-antiquark pairs and gluons. The spin of the proton should be explained by the sum of spin of quarks and gluons, and their orbital angular momentum. The contribution from quark spin has been measured by the polarized lepton deep inelastic scattering experiment (DIS). However this explains only 20% of the proton spin. Since the gluons cannot interact with leptons, DIS is not the best way to investigate gluon contributions. Therefore polarized p+p collisions use gluons and quarks as probes to interact with gluons. In PHENIX, we have measured the double longitudinal-spin asymmetry ALL of production in polarized p+p collisions [5]. In this process, carries only a fraction of the momentum of the scattering quark or gluon. More direct information of the gluon polarization will be obtained by measuring ALL of direct-photon and heavy quark production using the PHENIX central-arm spectrometer and the central silicon vertex tracker.
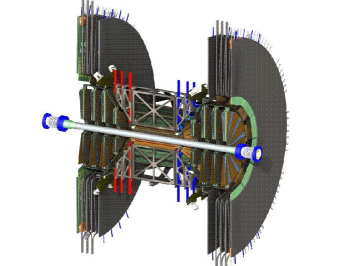
The central silicon vertex tracker consists of four layers of barrel detectors, and covers 2 azimuthal angle and 1.2. The inner two layers are silicon pixel detectors and the outer two layers are silicon stripixel detectors, composed of 246 stripixel sensors. The radial distances of the barrel shaped layers from the colliding beam are 2.5 cm, 5 cm, 10 cm and 14 cm. Fig. 1 illustrates the planned layout for the VTX upgrade. Also shown on either side of the VTX barrels, is a set of four annular disks of silicon micro-strip detectors from the forward vertex tracker (FVTX). Due to close proximity of VTX to interaction point, the detector and electronics will be harshly irradiated in the PHENIX environment. (luminosity of RHIC II operations will be 21032 cm-2s-1). In this paper, the study of the effect on the PHENIX vertex stripixel sensor used in the third and fourth layers will be discussed.
2 Silicon stripixel sensor
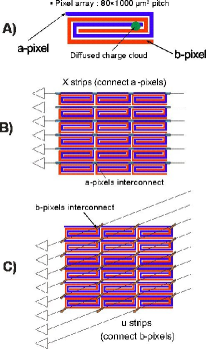
A novel stripixel silicon sensor has been developed at BNL [6]. The silicon sensor is a single-sided, DC-coupled, two dimensional (2D) sensitive detector. This design is simpler for sensor fabrication and signal processing than the conventional double-sided strip sensor. Each pixel from the stripixel sensor is made from two interleaved implants (a-pixel and b-pixel) in such a way that the charge deposited by ionizing particles can be seen by both implants as presented in Fig. 2.A. The a-pixels are connected to form a X-strip as is presented in Fig. 2.B. The b-pixels are connected in order to form a U-strip as is presented in Fig. 2.C. The stereo angle between a X-strip and a U-strip is 4.6∘. In 2005, mask design and processing technology was transferred successfully from BNL to sensor fabrication company Hamamatsu Photonics (HPK) located in Japan, for mass production of the stripixel sensors. The stripixel sensor specifications are summarized in Table 1. The readout side is implanted with p-type ions and the unsegmented bias contact side is implanted with n-type ions(n+-type side). This allows compact arrangement without connecting electronics on the n+-type side of the sensors.
A stripixel sensor is wire-bonded to twelve SVX4 ASIC [7] chips each having 128 channels. The SVX4 ASIC originally developed by Fermi National Accelerator Laboratory and Berkeley National Laboratory was designed for use as an AC-coupled device. But we chose DC-coupling between the stripixel sensor and SVX4 to take advantage of the higher S/N ratio. However, the SVX4 preamplifier may saturate from the leakage current. The preamplifier has a dynamic range of 200 fC and must be reset during a series of unfilled beam bunches which come every 13 sec at RHIC. This limits the leakage current to 15 nA/strip. Under these conditions signal-to-noise ratio in the detector
| Diode configuration | p+/n/n+ |
|---|---|
| Resistivity | 4-10 k |
| Sensor size | 3.43 x 6.36 [cm2] |
| Sensitive area | 3.072 x 3.000 x 2 [cm2] |
| Thickness | 625 [m] |
| Pixel structure | Spiral structure |
| 5m line, 3m gap | |
| Effective pixel size | 80 x 1000 [m2] |
| Strip construction | Chain of 30 pixels |
| Number of Strips | Total: 1536 |
| X-strip: 384 x 2, U-strip: 384 x 2 | |
| Readout | DC coupled |
| Front-end electronics | SVX4 ASIC |
was found to be better than 20:1. Although the first layer of VTX is exposed to the highest radiation, the pixel detectors are read out by AC-coupled electronics, thus there is no concern about saturation. Therefore, the increase of leakage current is the most problematic radiation effect for the stripixel detectors. To estimate the leakage current accurately, actual silicon stripixel sensors were irradiated and their leakage currents were measured.
3 Radiation damage effect of silicon sensor
There are three known radiation effects on a silicon sensor: (1) increase of leakage current due to generation of point defects; (2) decrease of charge collection efficiency due to induced trapping centers; and (3) change of depletion voltage due to increase of effective acceptor density. Among the three radiation effects listed, the most problematic effect for our application is (1) increase of leakage current, because the leakage current which can flow into the DC-coupled charge sensitive preamplifier is limited to 15 nA/channel. Therefore, we will hereafter focus our discussion on the effect of the leakage current.
Extensive study done by CERN-RD48 has found the following relation between increase of leakage current and 1 MeV neutron equivalent fluence :
| (1) |
where is the difference in leakage current before and after irradiation and is the proportionality factor called the current related damage rate[8]. A typical value of after post-irradiation annealing is 410-17 A/cm. Eq. (1) was used as a guide throughout our experimental study.
3.1 Determination of increase of leakage current,
The leakage current depends on the thickness of the depletion layer , and increases with increasing voltage as:
| (2) |
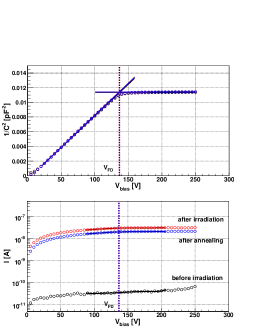
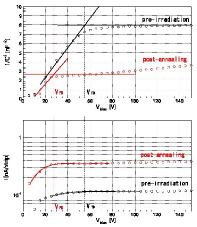
I is determined by the difference between pre-irradiation leakage current and post-annealing leakage current measured at full depletion voltage, [9]. The capacitance decreases with increasing voltage as:
| (3) |
At full depletion, reaches its minimum and stays constant thereafter. is determined graphically using the bias voltage dependence of as shown in Fig. 5.
Leakage current also depends on the temperature [K] as:
| (4) |
where, is the energy gap of silicon ( = 1.2 eV); and is the Boltzmann constant ( = eV/K). This relation holds for any silicon sensor both before and after irradiation. Most of our measurements are done at , otherwise for comparison the leakage current readings were converted to equivalent value using Eq. (4). Therefore, the leakage current can be controlled to some extent by adjusting the operating temperature. This relation will be used to evaluate the operating temperature for VTX in RHIC II running conditions.
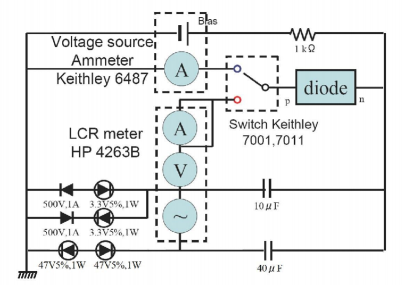
In our study of silicon sensor properties, the dependencies of capacitance and leakage current on bias voltage were measured. The circuit diagram of the measurement system is shown in Fig. 3. Bias voltage was applied from the back of the sensors, and capacitance and leakage current were measured through readout pads. The system consists of a picoammeter/voltage source (Keithley 6487), a LCR meter (HP 4263 B) and a switch scanner system (Keithley 7002), controlled by LabVIEW through a GPIB interface.
The current related damage rate is determined by the temperature history after the start of irradiation[8]. The dependence is described as
| (5) |
where is the time from the irradiation time [min]; is the temperature [K]; [A/cm]; = [A/cm]; = 1 [min]; is the time constant [min] of the annealing process and is obtained as
| (6) |
where = [min-1] and =1.11 [V];
| (7) |
4 Determination of neutron equivalent fluence,
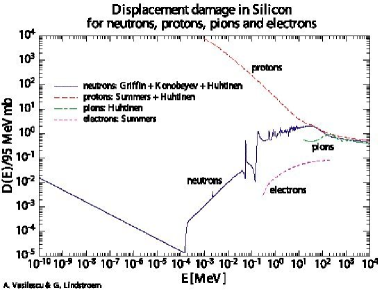
Radiation leads to point defects in Si. The displacement damage by different particles causes various levels of defects. For a quantitative study of this effect on the silicon sensor, it is necessary to know the type and the energy of the radiation particle as well as its fluence. The conversion factor known as the hardness factor evaluated by the Non-Ionizing Energy Loss (NIEL) hypothesis is plotted in Fig. 4 as a function of energy for neutrons, protons, pions and electrons[10]. The following equation was used to convert beam fluence to 1 MeV neutron equivalent :
| (8) |
A method to monitor with reference diodes will now be described.
4.1 Beam test with reference diode
The diodes which we used for beam irradiation tests were the same kind developed by CERN-RD48 collaboration. Denoting as ”reference diode”, its properties are listed in Table 2. For the electrical measurements, the reference diodes of CERN-RD48 type were mounted on a printed circuit board (PCB) with bias and signal lines connected through Lemo connectors. The guard ring on the front of the diode was wire-bonded to GND, and bias voltage was applied on the n+-type side via conductive epoxy glue, which held the diode in place. The front charge collection electrode inside the guard ring was wire-bonded to one of the connectors, and was readout by the setup shown in Fig. 3 before and after irradiation. Another diode used for reference purposes was Si PIN photodiode S3204-08 from Hamamatsu Photonics. Its properties are also listed in Table 2.
In order to cover a wide range of fluence, irradiation experiments were performed at two complementary facilities, namely the Cockcroft-Walton accelerator at Rikkyo University for the low fluence measurements, and the Tandem Van de Graaff accelerator at Kyoto University for the high fluence measurements. Rikkyo Cockcroft-Walton accelerator provides low intensity 14 MeV neutrons from deuteron-triton fusion reactions, and is suited for low fluence measurement. However, to reach 1011/cm2 is time prohibitive. On the other hand, Kyoto Tandem can provide an intense 12 MeV proton beam of the order of 1 nA (1010 particles/s), but transport becomes unstable below this beam current, making an accurate fluence measurement below 1011/cm2 difficult.
| Diode | Diode | Resistivity | Active area | Thickness | Volume |
| type | configuration | [k] | [cm2] | [cm] | [cm3] |
| CERN-RD48 | p+/n/n+ | 2 | 2.5 | 3.04 | 7.6 |
| S3204-08 | PIN | - | 3.24 | 3 | 9.7 |
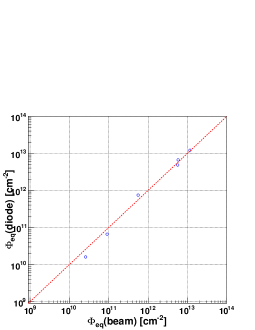
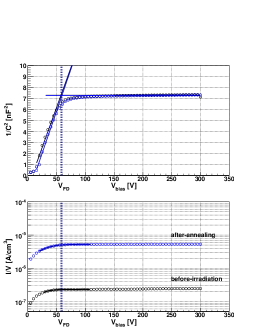
We investigated the correspondence between beam monitor fluences and diode fluences as follows. For the 14 MeV neutron beam from the Cockcroft-Walton accelerator at Rikkyo, the fluences were between 1 and 1 Neq/cm2. The beam fluence was estimated from TPS-452BS neutron counter from ALOKA. The hardness factor of 14 MeV neutron is 1.823 0.006. The diode fluence was estimated through an increase of leakage current. The current related damage rate was estimated using temperature history of temperature logger data. Fig. 5 shows the IV and CV measurements, where the leakage current and capacitance were measured before irradiation and after annealing, and the annealing was done at for 80 min. The increase of leakage current is calculated between pre-irradiation (black points) and post-annealing (blue points) at VFD (dashed line), while the red points are the measured result post-irradiation. The resulting distribution is shown in Fig. 6. The agreement was well established. For the 12 MeV proton beam at Kyoto Tandem, the beam fluence was estimated from a Faraday cup measurement. The hardness factor of 12 MeV protons is 3.6 0.1. The fluences of diodes were estimated by the same method as that of 14 MeV neutron beam tests. Our final results are shown in Fig. 6, which agree with beam monitor values within 25%. The details of irradiation results are summarized in Table 3.
| Beam particle | neutron | neutron | proton | proton | proton | proton |
| Beam energy [MeV] | 14 | 14 | 12 | 12 | 12 | 12 |
| Diode type | S3204-08 | CERN-RD48 | CERN-RD48 | CERN-RD48 | CERN-RD48 | CERN-RD48 |
| I/Volume [A/cm3] | 6.42 | 2.66 | 3.06 | 1.98 | 2.73 | 5.08 |
| Error I/Volume [A/cm3] | 8.74 | 7.58 | 8.88 | 5.96 | 1.89 | 8.88 |
| [A/cm] | 4.00 | 4.05 | 4.11 | 4.09 | 4.12 | 4.19 |
| Diode fluence [Neq/cm2] | 1.60 | 6.57 | 7.44 | 4.85 | 6.63 | 1.21 |
| Error diode fluence [Neq/cm2] | 2.71 | 1.87 | 8.64 | 5.85 | 1.85 | 8.47 |
| Beam fluence [/cm2] | 1.42 | 4.96 | 1.53 | 1.55 | 1.59 | 3.20 |
| Hardness factor | 1.823 | 1.823 | 3.6 | 3.6 | 3.6 | 3.6 |
| Beam fluence [Neq/cm2] | 2.58 | 9.04 | 5.56 | 5.62 | 5.79 | 1.16 |
4.2 Temperature dependence of reference diode
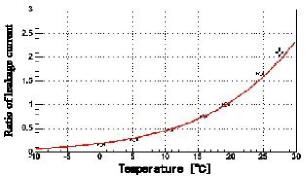
We studied the temperature dependence of leakage current with the reference diode which had been irradiated by 12 MeV proton beam with =5.79 [Neq/cm2] at Kyoto Univ. The diodes were measured at intervals from to . The ratio of the leakage current is shown in Fig. 7, where the red curve represents the calculation using Eq. (4) normalized to . The temperature dependence of the leakage current agrees with Eq. (4) within less than 18% error. Therefore the increase of leakage current of the stripixel sensor from radiation damage in RHIC II operations can be offset by lowering the operating temperature of the environment. This would reduce considerably or even eliminate the problem of saturation experienced at room temperature.
5 Beam irradiation test of stripixel sensor
The radiation damage test results of the stripixel sensors are described in this section. In preparation for the tests, we designed a PCB for the stripixel sensor. The PCB had a rectangular opening which was slightly bigger than the sensitive area of the stripixel sensor. A stripixel sensor was glued on the PCB in such a way that the sensitive area was centered in the opening. The PCB had 24 single readout, bias, GND and signal sum readout connectors. The guard ring on the front surface of the stripixel sensor was wire-bonded to the GND connector. The bias was supplied from the back side of the sensor. A sample of 24 strips out of 1536 strips was wire-bonded to individual readout connectors and the rest of the strips were wire-bonded together to the signal sum readout connector. This arrangement allowed measurement of the individual strips of the pre-selected sample as well as total leakage current when the 24 individual readout channels were externally connected with the signal sum channel. Before the beam irradiation tests, stripixel sensors were mounted on the PCB and pre-irradiation leakage current measurements were done. We also measured the capacitance of the stripixel sensor. The annealing was done at for 80 minutes. The increase of leakage current was estimated at . The current related damage rate was determined from the temperature history recorded by a temperature logger, which was installed in the same setup.
In order to determine the fluence dependence of leakage current, we made measurements at two different fluence settings. We used 14 MeV neutron from deuteron-triton fusion reaction for the low fluence test at Rikkyo and 16 MeV proton beam for the high fluence test at the Tandem Accelerator Center in the University of Tsukuba. Tsukuba Tandem was chosen because its proton beam energy was high enough to penetrate the 625 m thick stripixel sensor without significant energy loss, which affects the hardness factor.
An additional high fluence measurement was done with a 500 m thick preproduction sensor utilizing 200 MeV proton beam at Radiation Effects Research Stations (RERS) at Indiana University Cyclotron Facility (IUCF). After irradiation the sensor was sent to University of New Mexico, where leakage current, capacitance and depletion voltage measurements were done on a temperature controlled chuck with a probing station.
5.1 Beam irradiation test setup
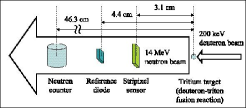
The setup of 14 MeV neutron irradiation test at Rikkyo Univ. is shown in Fig. 8. Due to the fact that neutrons do not have ionization energy loss, the experimental arrangement was rather trivial. The stripixel sensor, a reference diode and the TPS-451BS neutron counter were placed behind the tritium target in line with the incoming deuteron beam. The beam current on the target was monitored for controlling the beam stability. The pulse output of the neutron counter was sent to the control room and counted by a scaler to obtain the neutron fluence.
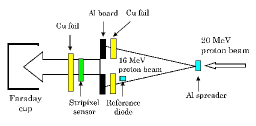
In the case of proton irradiation test, it is necessary to avoid localization in beam experiments to simulate almost uniform irradiation in the actual PHENIX environment. The setup of the 16 MeV proton irradiation test at Univ. of Tsukuba is shown in Fig. 9. The original 20 MeV proton beam from the Tandem Van de Graaff accelerator was spread with a 0.5 mm thick aluminum plate by Coulomb multiple scattering. The standard deviation of the spread was 3.8 cm at the sensor under test. The energy of the beam after the spreader is also affected and the mean value energy of the beam was 16 MeV. An aluminum collimator plate of 5 mm thickness was placed 150 cm downstream of the spreader. The Al collimator had a square opening of the size 3030 mm2 which was aligned to the center of the beam. A Cu foil was mounted in front of the collimator and it had the same opening so that the beam directly entered the stripixel sensor. The Al collimator size was 200150 mm2 to cover the PCB. One full stripixel pattern of the sensor was irradiated with 16 MeV proton spread beam through the opening of the collimator. A reference diode was placed by the side of the stripixel sensor on the front Cu foil. A Faraday cup was used for the beam fluence monitor at the end of the beam line. A magnetic field was applied to the cup to sweep away escaping secondary electrons.
A preproduction stripixel sensor and a reference diode were irradiated with a 200 MeV proton beam at IUCF RERS. The variation of the radiation due to the beam spread over the chosen area was less than 30% and the dosimetry error was less than 10%.
5.2 Fluence determination
The fluence at the stripixel sensor position was estimated from the reference diode, which was irradiated together with the stripixel sensor. In case of the low fluence test at Rikkyo, the neutron fluence was determined from the leakage current of a reference diode. The fluence at the stripixel sensor was estimated to be 1.41011 Neq/cm2 using the inverse distance-squared dependence. On the other hand, the estimation in the high fluence test at Tsukuba required a geometrical correction due to the Gaussian shape of the beam profile. The procedure to obtain the correction factor is as follows.
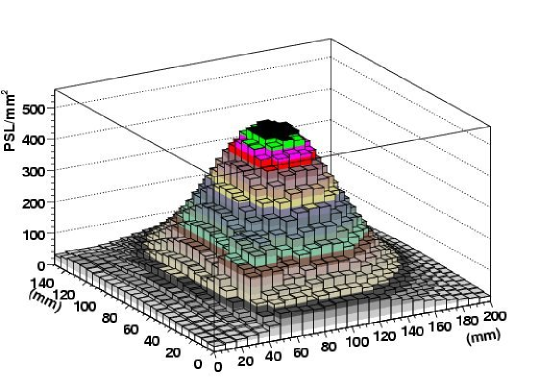
In order to measure the beam profile at the stripixel sensor, a plane Cu foil without a rectangular opening was irradiated at the same location as that of the test stripixel sensor. The proton beam had the same energy and the same intensity distribution. After the irradiation was over, the activated Cu foil (63Zn∗) was taken out from the chamber and was laid on an imaging plate (IP) to transfer the intensity map. The IP is a 2-dimensional radiation recording device, which can be read out by scanning laser stimulated luminescence[11]. Figure 10 shows the intensity distribution of the proton beam measured with the IP. The shape of the distribution was found to be consistent to 2-3% with the calculated beam spread by Coulomb multiple scattering.
We evaluated the average fluence for the whole stripixel sensor area using the measured distribution. The average fluence of the stripixel sensor was 93% of that of the beam center, while that of the reference diode was 73%. The fluence at the stripixel sensor was finally determined to be 2.4 Neq/cm2 by taking into consideration the ratio of the average fluences measured and the hardness factor 3.0 for 16 MeV protons. While the relative intensity of the activation was determined with the IP measurement, the absolute number of protons which irradiated the stripixel sensor was estimated in the following way.
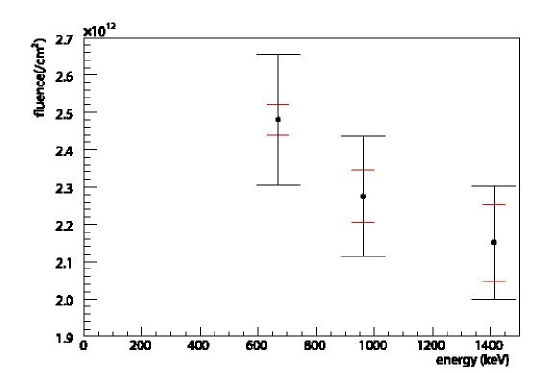
The Cu foil which was irradiated behind the test stripixel sensor was taken out from the chamber and the ray intensity was measured with a germanium (Ge) detector. The ray spectrum of activated foil had three main energy peaks at 669 keV, 962 keV and 1412 keV. The fluence was calculated by the following equation.
| (9) |
| (10) |
where is the number of rays at one of the energy peaks, is the decay constant, is irradiation time, is the detection efficiency, B is the branching ratio of the ray, is the activation cross-section, is the number of 63Cu atoms, is the solid angle of a gamma ray detector, is start time of measurement of rays and is the measurement time. The Ge energy calibration and the detection efficiency determination were done using standard checking sources. The solid angle was calculated from the source distance and the size of the detector sensitive area. The fluence determined at each energy peak is shown in Fig. 11. The values are all consistent with the fluence determined by the reference diode when both statistical and systematic errors are considered.
In the case of IUCF irradiation because the energy loss effect of the 200 MeV protons was negligible and the radiation variation was known to be within 30% over the chosen area, the fluence was estimated directly from the leakage current of the reference diode.
5.3 Leakage current of stripixel sensor
Fig. 12 shows IV/CV measurement result of the stripixel sensor irradiated with 14 MeV neutrons. The increase of leakage current is defined as difference between the pre-irradiation and post-annealing leakage current at and T = . The measurement results are summarized in Table 4. It should be emphasized that the fluence determined by stripixel sensor was consistent with reference diode measurement within 10%. Also note that the consistency was confirmed among different kinds of radiation, namely 14 MeV neutrons, 16 MeV and 200 MeV protons.
| stripixel sensor thickness [m] | 625 | 625 | 500 |
|---|---|---|---|
| Beam particle | neutron | proton | proton |
| Beam energy [MeV] | 14 | 16 | 200 |
| I/Volume [A/strip] | 3.57 | 7.39 | 5.93 |
| I/Volume [A/cm3] | 4.76 | 9.86 | 9.88 |
| Error I/Volume [A/cm3] | 1.21 | 6.04 | 9.88 |
| [A/cm] | 4.04 | 4.30 | 4.00 |
| Fluence (reference diode) [Neq/cm2] | 1.37 | 2.46 | 3.47 |
| Fluence (neutron counter) [Neq/cm2] | 1.88 | - | - |
| Fluence (activation method) [Neq/cm2] | - | 2.37 | - |
| Fluence (beam monitor) [Neq/cm2] | - | - | 5 |
6 Test at PHENIX IR
In order to better understand the radiation that the stripixel sensors will be exposed to during RHIC II operations and the resultant possible damage, we performed a detailed measurement of the radiation dose in the PHENIX IR (Interaction Region) during the RHIC proton-proton run in 2006 (Run 6).
Thirty thermoluminescent dosimeters (TLDs), sixteen BNL standard test diodes111Wafer: n-type, [111], 100 mm diameter, 400 um thick, resistivity 4-6 kohm-cm
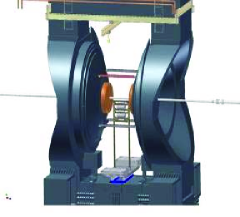
Detector: p+/n/n+ junction diode, two stripixel sensors, five temperature loggers, two C-AD personnel radiation monitoring instruments (chipmunks) and three beam loss monitors (BLMs) were installed at the PHENIX IR area, at various radii underneath the interaction point for the measurement of the instant and accumulated radiation dose during Run 6. Figure 13 shows the position of the radiation measurement structure underneath the beam pipe in the IR area of PHENIX.
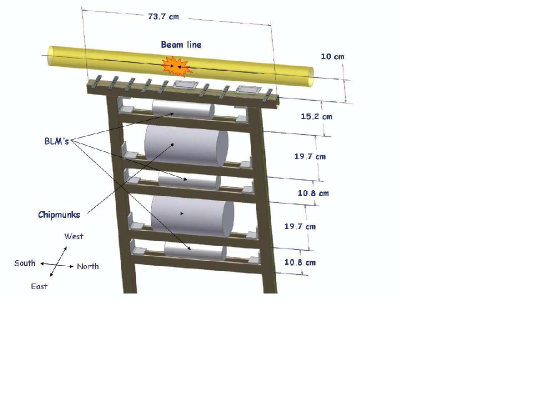
The top strip of the structure was positioned 10 cm away from the beam pipe and ran parallel to the beam line. A set of 12 TLDs was placed on the top strip and six TLDs were positioned on the poletips of the PHENIX central magnet (see Fig. 13), three on the north side and three on the south, at radii where the vertex detector electronics will be positioned (5.08 cm, 10.16 cm, 15.24 cm). They were used to measure integrated dose and study extensively the radial dependence of the dose. The test diodes and stripixel sensors were placed on the top strip and used to measure the actual effect in units of equivalent 1 MeV neutron fluence, which is relevant to a silicon device. Two thermocouples and three battery operated temperature loggers were positioned near the stripixel sensors to monitor the temperature during the irradiation period. The chipmunks were used to measure instantaneous dose and radial dependence of the radiation. The information from the chipmunks and the TLDs was then used to get RHIC II scaling factors and thus accordingly scale the stripixel sensors and test diodes current measurements. The beam loss monitors are not sensitive enough to respond to the radiation from normal RHIC operation. They could detect potential accute radiation. Figure 14 shows the position of the BLMs’ and chipmunks’ ionization chambers in the radiation measurement mounting stand, as well as the sixteen test diodes and two stripixel sensors on the top strip. In further discussions the north-south axis, that runs parallel to the beam line, will be referred as the z axis.
6.1 TLDs
The TLDs were used to measure the accumulated radiation for the duration that the structure was in the IR. They were positioned close to the stripixel sensors and on the BLMs’ and chipmunks’ ionization chambers to cross-check the measurements from these devices.
6.1.1 TLD measurements - Dependence on radial distance from the beam line
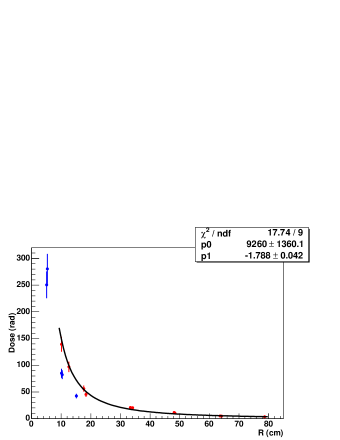
The measurements from a number of TLDs placed at the same position along the beam axis, namely directly underneath the interaction point, were used to obtain the radial dependence R of the radiation from the beam line. In Figure 15 the TLD radiation measurements (red points) are plotted versus their distance R from the beam line and fit to the function (Fig. 15). The estimated R dependence from the fit is -1.788 0.047.
Also six TLDs were placed on the magnet nose cones which are at 41 cm (south) and 41 cm (north) along the beam line (z-axis). These TLDs were left in the Interaction Region for the duration of the run (total luminosity 42 pb as opposed to the TLDs on the strip and the ones attached at the BLMs and chipmunks that were in the area only for part of the run with a delivered luminosity of 12 pb-1. Therefore the accumulated radiation values for these TLDs are higher. The measurements from these TLDs indicate a dependence on the distance from the beam line that is in accordance with the radial dependence in Figure 15. In Figure 15 the nose cone TLD values (blue points), scaled at 12 pb-1, have been overlaid with the values of the rest of the TLDs (red points).
6.1.2 TLD measurements - Dependence on distance from the Interaction Point along the beam line
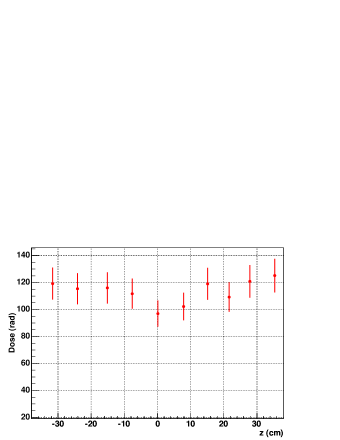
A set of twelve TLDs placed on the strip that run parallel to the beam line (z axis) is used to study the dependence of radiation on z position. In Figure 16 the TLD measured doses have been plotted with respect to their position along the beam axis. No obvious trend was observed.
6.2 Stripixel Irradiation
The sixteen BNL test diodes and two stripixel sensors were irradiated at radial distance 10 cm from the beam line in the PHENIX IR in Run 6. This will be the actual position of the stripixel sensors in the third layer of the VTX array. The center axis of the top strip was offset by 2 cm from the beam line so that one of the stripixel sensors would be directly underneath the interaction point. However the stripixel sensor placed underneath the interaction point was mechanically damaged so we only have results from one of the sensors.
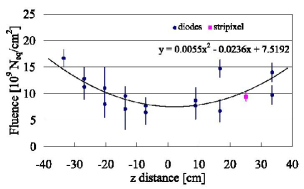
There were two kinds of test diodes with different volumes which were 0.01 cm3 and 0.004 cm3. The increase of the leakage current of the diodes and the relevant fluences are summarized in Table 5. Only fifteen diodes are listed since the other diode was found to be defective during the leakage current measurement. The average fluence of the diodes was 1.0 Neq/cm2. The estimated z dependence of the diode fluence is shown in Fig. 17 which is in agreement with the TLDs.
The sensor was irradiated at Z=25.2 cm for about 50 days and the integrated luminosity during this time was 12 pb-1. The current related damage rate was estimated to be 3.2 A/cm using the temperature history of the temperature loggers in the PHENIX IR. The increase of leakage current of a single strip was 2.2 A/strip as seen in Table 5. Figure 18 shows the IV and CV measurements, where the leakage current and capacitance were measured before and after irradiation. The fluence of irradiated stripixel sensor was estimated to be 9.4 Neq/cm2 which is consistent with the average fluence of the reference diodes.
| Z-distance (cm) | I/Volume | Error I/Volume | Fluence | Error Fluence | |
| [cm] | [A/cm3] | [A/cm3] | [Neq/cm2] | [Neq/cm2] | |
| diode 1 | 33.5 | 4.5 | 5.6 | 1.4 | 1.8 |
| diode 2 | 33.5 | 3.1 | 5.7 | 9.7 | 1.8 |
| diode 3 | 16.8 | 2.1 | 6.8 | 6.7 | 2.1 |
| diode 4 | 16.8 | 4.7 | 5.4 | 1.5 | 1.7 |
| diode 5 | 8.9 | 2.5 | 8.1 | 7.7 | 2.5 |
| diode 6 | 8.9 | 2.8 | 7.6 | 8.7 | 2.4 |
| diode 7 | -7.1 | 2.1 | 7.5 | 6.4 | 2.3 |
| diode 8 | -7.1 | 2.5 | 4.9 | 7.7 | 1.5 |
| diode 9 | -13.7 | 2.3 | 1.2 | 7.0 | 3.9 |
| diode 10 | -13.7 | 3.1 | 5.6 | 9.5 | 1.7 |
| diode 11 | -20.3 | 3.5 | 1.3 | 1.1 | 3.9 |
| diode 12 | -20.3 | 2.6 | 8.1 | 8.0 | 2.5 |
| diode 13 | -26.9 | 3.6 | 7.4 | 1.1 | 2.3 |
| diode 14 | -26.9 | 4.1 | 6.9 | 1.3 | 2.2 |
| diode 15 | -33.5 | 5.3 | 5.3 | 1.7 | 1.7 |
| stripixel sensor | 25.2 | 3.0 | 2.5 | 9.4 | 7.8 |
6.3 Chipmunks
The chipmunks provide a sensitive way to monitor the instantaneous rate of radiation in the IR. They are configured to read in dose equivalent units, i.e. “mrem/hr” on a meter. There is also an accompanying frequency output (Hz) that is proportional to the meter reading, calibrated with the use of a test source Cs-137. C-AD personnel determined that for Chipmunk 1 (positioned at 63 cm distance from the beam pipe) 4.68 Hz = 42 mrem/hr, and for Chipmunk 2 (positioned at 33 cm distance from the beam pipe) 4.86 Hz = 43 mrem/hr. In order to convert the dose equivalent measured by the chipmunks to absorbed dose in units of rad we have to use the following formula:
| (11) |
The currently accepted value of the quality factor Q.F. = 2.5 for the RHIC enviroment was also assigned at PHENIX. Thus, the overall conversion from the frequency output to absorbed dose were determined to be 1 counts/sec = 1 rad/sec for Chipmunk 1 and 1 counts/sec= 0.99 rad/sec for Chipmunk 2. It should be noted that the accuracy of the quality factor is not important for this study since only ratios of chipmunk rates are used for the determination of the radial and luminosity dependence of dose. The doses obtained with the chipmunks were found to be consistently higher than that from the TLDs that were placed on them. This could be due to the different normalizations for converting the measurements in rads for the two kinds of devices. For example the TLDs do not get normalised to account for neutron radiation [12].
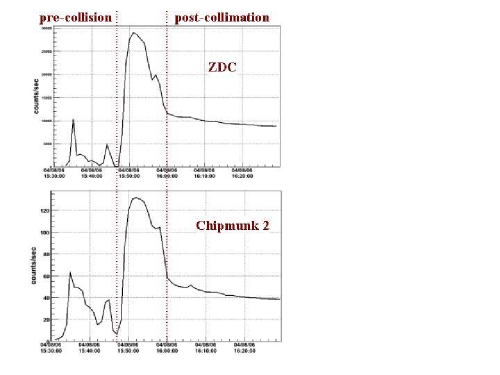
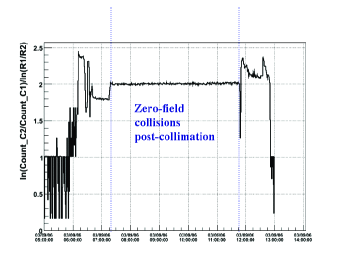
As seen in Figure 19 the chipmunk rates shape for a typical RHIC store is very similar to the PHENIX zero degree calorimeter (ZDC) [13]. The initial structure (from 04/08/06 15:30 to 04/08/06 15:47) corresponds to the ramping, steering of the beams in the collider rings and then the peak during the time 15:47 to 16:00 corresponds to beam collisions having started but prior to the collimation of the beams. The spike in ZDC as well as the chipmunk corresponds to the ions in the periphery of the beams interacting with each other. Once the beams have been collimated the beam “halo” is reduced so the radiation dose goes down.
6.3.1 Dose dependence on radial distance from the interaction point
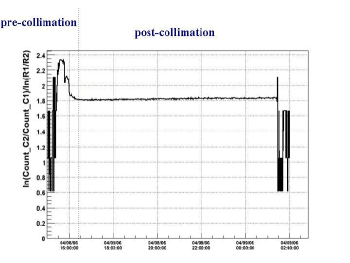
The measurements from the two chipmunks can be used to quantify the radial dependence of the absorbed radiation. In Figure 20 the ratio
| (12) |
for a typical store is plotted, where , are the measured rates converted in rad/sec at Chipmunk 2 and Chipmunk 1 respectively and R2, R1 the distance of Chipmunk 2, Chipmunk 1 (R2=33 cm, R1=63 cm) from the beam pipe. The ratio for the post-collimation phase (Figure 20) indicates a radial dependence of where r is the distance from the beam line, which is in agreement with the R dependence obtained by the TLDs (-1.788 0.047). The reason for the deviation from , which would imply a point-like source, is an effect of the PHENIX magnetic field. This was verified with a zero field run shown in Fig. 21.
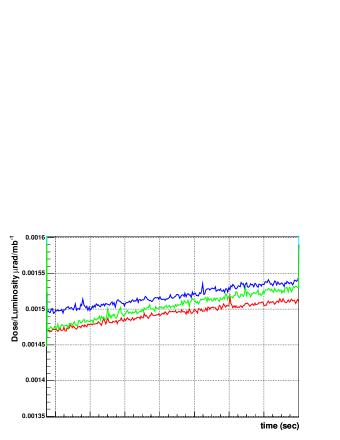
6.3.2 Scaling of Dose with Luminosity
In order to estimate the radiation dose during RHIC II we should examine the dependence of the dose on the delivered luminosities. If the post-collimation radiation is primarily due to collisions, then we can extrapolate the currently received dose to RHIC II according to the expected luminosities. Thus we examine whether the dose scales with luminosity by measuring the dose/luminosity variation from store to store. The luminosity is calculated as described in [13] . In Figure 22 the dose/luminosity ratio (D/L) in rad/mb-1 for Chipmunk 2 indicates that the Dose scales with luminosity after collimation. The ratio D/L is almost constant across all stores (with the luminosity increasing almost by a factor of two) and is D/L= 1.500 0.075 rad/pb-1 at 33 cm.
We confirmed that the post-collimation dose during Run 6 is mostly due to collisions by recording rates while C-AD personnel uncogged the beams, at our request. Namely, they altered the phase of the beams, so the ion bunches did not arrive at the collision points at the same time. Therefore, during the uncogged phase no collisions took place and the chipmunks recorded only 15 of the dose they recorded during the cogged phase.
We can estimate the total post collimation dose that was received during the current run by using the observed D/L = 1.5 rad/pb-1. The total delivered luminosity while the radiation measurement structure was in the IR, is 12 pb-1 and therefore the total estimated post collimation dose is 18 rad. The total dose (pre collimation, post collimation and aborted stores) that the Chipmunk 2 measured at 33 cm was 29.6 rad. Thus at Run 6, the dose due to collisions is
| (13) |
of the total received dose. The pre-collimation phase dependence on beam intensity was studied and the beam quality variations from store to store were such that if any such correlation exists it cannot be observed presently. The typical store during the current run has cumulative radiation dose at 33 cm that varied from 0.08 to 0.2 rad/store. The total received pre-collimation dose was 5 rad and aborted stores contributed 7 rad to the total dose recorded by the chipmunks.
| PHENIX measurement - post collimation at 10 cm for stripixel sensor | ||||||||
| Species | dN/dy | Npart | cross section | radius | Luminosity | fluence | ||
| (GeV) | at y=0 | (b) | (cm) | (nb-1) | (krad) | (Neq/cm2) | ||
| pp | 200 | 3.6 | 2 | 10 | ||||
| Projection at 10 cm for 20 week RHIC II runs | ||||||||
| Species | dN/dy | Npart | cross section | radius | Luminosity | fluence | ||
| (GeV) | at y=0 | (b) | (cm) | (nb-1) | (Neq/cm2) | |||
| pp | 500 | 4 | 2 | 10 | 341.3 | |||
| pp | 200 | 3.6 | 2 | 10 | 58.2 | |||
| AuAu | 200 | 3.6 | 100 | 7.0 | 10 | 35.1 | ||
| CuCu | 200 | 3.6 | 35 | 3.4 | 10 | 58.9 | ||
6.3.3 Projection to RHIC II according to the current PHENIX study
Having established the dependence of the radiation dose on luminosity and radial distance from the beam line, we can extrapolate our current measurements to the RHIC II running conditions and estimate the relevant dose expected.
The radiation dose received at a point of radial distance R from the interaction point, for two species colliding with center of mass energy E should be proportional to the number of particles produced during the collisions. In other words it should be proportional to the particle yield (dN/dy) for proton-proton collisions at rapidity y=0 for the relevant collision energy and the number of interactions occuring. If L is the luminosity delivered, the hadronic cross section at the relevant energy and the number of participants for the species colliding then, the Dose D is
| (14) |
Forming the ratio of the doses , in two different states A and B:
| (15) |
we can estimate the radiation dose that the stripixel sensors will receive after collimation at 10 cm, during RHIC II operations under the assumption that all the dose will be due to collisions. The total measured fluence for the stripixel sensor during Run 6 was Neq/cm2, as mentioned in Section 6.2. However the dose due to collisions should be Neq/cm2 = Neq/cm2 according to formula 13.
In Table 6 there is a summary of the Run 6 PHENIX measurement for the stripixel sensor fluence and run conditions. Also shown are the expected luminosities, cross sections and for twenty week runs for a number of different species and collision energies at RHIC II. Since the purpose of this study is mainly to obtain the projection factors from the current dose received to RHIC II expected radiation dose, we report the ratio , where is the measured fluence for the stripixel sensor at 10 cm for the current run and the expected dose for these 20 week runs, as well as the projected fluences.
For a ten year run, assuming one year of 500 GeV pp run and three years for each of other species (Au-Au, Cu-Cu, pp at 200GeV) the total expected post collimation dose at 10 cm would be Neq/cm2. We could also estimate an upper limit for the total radiation received by the stripixel sensors by using the total measured fluence, Neq/cm2, which includes the pre-collimation, post collimation phases and aborted stores. If we use formula 15 and the total measured fluence then the expected radiation for a ten year run at RHIC II would be Neq/cm2. However a more realistic upper limit can be set by estimating the dose during the pre-collimation phase.
Similarly we can repeat these calculations using the chipmunk dose of 18 rad for L = 12 pb-1 at 33 cm. The expected post-collimation dose for RHIC II at 10 cm from the beam line is estimated to be 127 krad. For the pre-collimation dose, if we assume a scaling of , 500 stores per year and no dependence on beam intensity, then the projected dose at 10 cm for a ten year run of RHIC II would be :
| (16) |
Thus the total (pre+post-collimation) expected radiation is 133.6 krad and the pre-collimation dose would be in the order of a 5 effect. Thus a more realistic upper limit for the expected fluence during 10 years of RHIC II operations would be Neq/cm2.
| PHENIX measurement - post collimation at 10 cm for stripixel sensor | ||||||||
| Species | dN/dy | Npart | cross section | radius | Luminosity | fluence | ||
| (GeV) | at y=0 | (b) | (cm) | (nb-1) | (Neq/cm2) | (Neq/cm2) | ||
| pp | 200 | 3.6 | 2 | 10 | ||||
| CDF measurement | ||||||||
| Species | dN/dy | Npart | cross section | radius | Luminosity | fluence | ||
| (GeV) | at y=0 | (b) | (cm) | (nb-1) | (Neq/cm2) | (Neq/cm2) | ||
| pp | 1800 | 4.3 | 2 | 3 | ||||
| CDF based estimation of fluence at 10 cm for PHENIX stripixel sensor | ||||||||
| Species | dN/dy | Npart | cross section | radius | Luminosity | fluence | ||
| (GeV) | at y=0 | (b) | (cm) | (nb-1) | (Neq/cm2) | (Neq/cm2) | ||
| pp | 200 | 3.6 | 2 | 10 | ||||
6.3.4 CDF fluence measurement
The CDF experiment at the Tevatron Collider at Fermilab has also measured the bulk radiation damage in silicon sensors and the dependence of 1MeV equivalent neutron fluence on the sensor radius from the beam and delivered luminosity [14]. The radiation damage in the SVX and SVX’ silicon vertex detectors was measured at 3 cm distance from the I.R. via their leakage currents. Their estimated equivalent 1MeV neutron fluence per for pp collisions at 1.8 TeV is
| (17) |
It would be instructive to compare their measurement with our results for the stripixel sensor fluence. Using formula 15 but with the r-dependence that was observed at CDF () we can project their measurement to our Run 6 conditions for the stripixel sensor placed at 10 cm from the beam line. In Table 7 there is a summary of the PHENIX Run 6 conditions and measurement for the stripixel sensor fluence, the CDF run conditions and fluence measurement as well as the estimated fluence for the PHENIX stripixel sensor at 10 cm according to the CDF measurement and radial dependence.
The PHENIX post-collimation fluence for the stripixel sensor (5.7 0.8) Neq/cm2 is somewhat higher than the CDF based estimation of (3.7 1) Neq/cm2 fluence at 10 cm from the beam line.
7 Conclusion
In conclusion, we have reproduced the CERN-RD48 proportionality between and I/Volume using their reference diodes in beam irradiation experiments. The CERN results were used to convert I/Volume of the reference diode to 1 MeV neutron equivalent fluence in our irradiation experiments.
PHENIX VTX silicon stripixel sensors were irradiated along with reference diodes using neutron and proton beams with various fluences. We found the same behavior also holds for the stripixel sensor.
A stripixel sensor installed in the PHENIX experimental hall during the run period in 2006 was exposed to the radiation coming from polarized proton-polarized proton collisions at = 200 GeV at 10 cm away from the beam line. The correspondence between integrated luminosity of RHIC for pp collisions and at 10 cm was determined. The conversion factor was found to be /pb-1 = 8 Neqcm-2/pb-1.
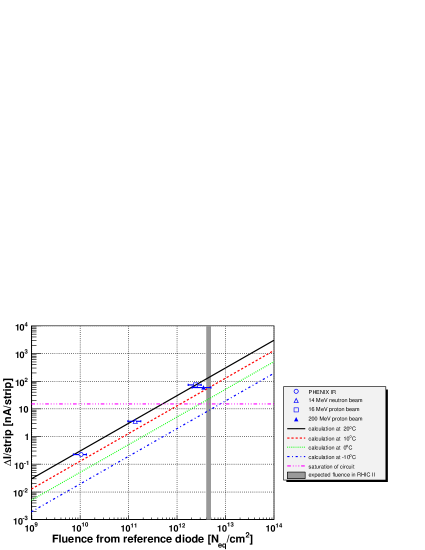
Fig. 23 is the summary plot of the stripixel sensor results as a function of determined by reference diode at . All data points are in agreement with the CERN-RD48 results; Eq. (1).
The estimated integrated luminosity of RHIC II runs for 10 years is 4 fb-1, which translates to = 4.5 Neq/cm2 (gray band in Fig. 23. Though the expected leakage current exceeds the required limit of 15nA/channel at , we can suppress the leakage current by lowering the operating temperature. It is concluded that the stripixel sensors need to be operated at T .
8 Acknowledgement
We thank Dr. M. Moll for providing us with the RD48 reference diodes. We also thank the staff of the Collider-Accelerator and Physics Departments at BNL for their vital contributions. We acknowledge support from the Office of NP in DOE Office of Science (U.S.A.)and MEXT(Japan).
References
- [1]
- [2] K. Adcox et al., Nucl. Instr. and Meth. A499 (2003) 469.
- [3] K. Adcox et al., Nuclear Physics A757 (2005) 184.
- [4] Y. Akiba, et al., Proposal for a Silicon Vertex Tracker (VTX) for the PHENIX Experiment (Brookhaven National Laboratory, Upton, NY, 2005).
- [5] S.S. Adler et al., Phys. Rev. Lett. 93 (2004) 202002.
- [6] Z. Li, et al., Nucl. Instr.and Meth. A 518 (2004) 300-304, A 518 (2004) 738-753, A 535 (2004) 404-409, A 541 (2005) 137-143.
- [7] B. Krieger, et al.: IEEE Trans. Nucl. Sci. 51 1968 (2004).
- [8] M. Moll, Ph.D. Thesis, University of Hamburg, 1999, DESY THESIS-1999-040, ISSN-1435-8085.
- [9] S. M. Sze and Kwon K. Ng, Physics of Semicondoctor Devices, Wiley Published 2006/10.
- [10] A. Vasilescu (INPE Bucharest) and G. Lindstroem (University of Hamburg), Displacement damage in silicon, on-line compilation.
- [11] Sonoda M, Takano M, Migahara J, Kato H. Computed radiography utilizing scanning laser stimulated luminescence. Radiology. 1983;148:833-838.
- [12] Private communication with Landauer.
- [13] S. Adler et al., Nucl. Instrum. Meth A461:337-340, 2001.
- [13] S.Belikov, G.Bunce, M. Chiu, K.A. Drees, B.Fox, Y.Goto, T.Kawabata, N.Saito, H.Sato, and M. Tannenbaum. Determination of the Absolute Luminosity for the Proton-Proton Data at =200 GeV Recorded by PHENIX during RHIC Run-02, analysis note 184.
- [14] John A.J.Matthews Effective Silicon Damage Fluences measured by SVX and SVX’ CDF Note 3937.