FSR 0190 – Another old distant galactic cluster
Abstract
We are conducting a large program to classify newly discovered Milky Way star cluster candidates from Froebrich et al. 2007b . Here we present NIR follow-up observations of FSR 0190 (=, = J2000). The cluster is situated close to the Galactic Plane (=, =). It shows a circular shape, a relatively large number of core helium burning stars – which clearly distinguishes the cluster from the rich field – but no centrally condensed star density profile. We derive an age of more than 7 Gyr, a Galactocentric distance of 10.5 kpc, a distance of 10 kpc from the Sun, and an extinction of = 0.8 mag. The estimated mass is at least of the order of 105 M⊙, and the absolute brightness is 4.7 mag; both are rather typical properties for Palomar-type globular clusters.
keywords:
Galaxy: globular clusters: individual; Galaxy: open clusters, individual1 Introduction
A large number of stars form in clusters. Over time most clusters will dissolve and the cluster stars will migrate into the field, e.g. due to tidal interactions with giant molecular clouds. The study of the distribution of old clusters in the Galaxy will hence shed light on the disruption time-scales and the underlying physical processes. Furthermore, galactic globular clusters (GlCl) allow us to probe the conditions during the time of the formation of our Galaxy. Pre-requisites for these investigations are large, well defined samples of objects. Currently the sample of known old open clusters is very incomplete (e.g. Bonatto & Bica 2007b ). Also the number of newly discovered galactic GlCls in recent years (see Bonatto et al. 2007MNRAS.in.pressB2 (2007) or Bica et al. 2007A&A…472..483B (2007) for a summary) suggests that this sample as well is incomplete, especially at the low mass/luminosity end – the Palomar-type GlCls.
Wide field searches at infrared wavelength have provided a wealth of new clusters and candidates in recent years. Based on star counts in 2MASS (Skrutskie et al. 2006AJ….131.1163S (2006)), Froebrich et al. 2007b presented a list of 1021 new cluster candidates. To improve the usefulness of this sample (contamination rate about 50 %) a classification of the clusters based on e.g. infrared colour-magnitude diagrams has to be performed. One expects that the majority of these cluster candidates are young embedded clusters. However, so far also three old (age 1Gyr) open clusters (FSR 0031/0089/1744, Bonatto & Bica 2007b ) and three GlCls (FSR 0584, Bica et al. 2007A&A…472..483B (2007); FSR 1735, Froebrich et al. 2007a ; FSR 1767, Bonatto et al. 2007MNRAS.in.pressB2 (2007)) have been identified. In this work we present our results on the classification of FSR 0190 based on new deep near infrared observations.
The paper is structured as follows. Our data is presented in Sect. 2 and results including the appearance of the cluster, the contamination with field stars and the isochrone fitting to determine the cluster properties are presented in Sect. 3. Finally in Sect. 4 we discuss and conclude our findings.
2 Data
We secured near-infrared (NIR) J, H, and K-band imaging data with UFTI (Roche et al. 2003SPIE.4841..901R (2002)) at the U.K. Infrared Telescope (UKIRT) on the 29th of May, 2007. We obtained a 55 frame mosaic mapped with half detector spacing to cover the entire field of the cluster. The pixel size in the images is 0.09″. The data where taken under photometric conditions with 120 sec per pixel integration time in each filter. Standard data reduction techniques (dark subtraction and self-flat-fielding) before image-registration and mosaicking was performed using the facility pipeline ORAC-DR (Cavanagh et al. 2003ASPC..295..237C (2003)).
Despite the excellent seeing conditions (stellar FWHM are about 0.55″ in the final JHK mosaics), our photometry suffers from crowding in the field, due to the cluster’s position close to the Galactic Plane ( 70.73∘, 0.95∘). Using 3 detections in the K-band image, there are about 6500 stars in the field. If each star occupies an area with a diameter equal to the seeing (the minimum area required for photometry), then there is a crowding of 3 % in the field. This increases to 4 % when using 2 detections. We have performed our photometry using the SExtractor software (Bertin & Arnouts 1996A&AS..117..393B (1996)). Only 2 detections in the K-band, with quality flags better than 3 and photometric errors below 0.2 mag in all three filters are used in our subsequent analysis.
We have used the 2MASS point sources in the field to flux calibrate our JHK images. The scatter in the calibration is 0.14, 0.13, 0.10 mag in JHK respectively caused mainly by magnitude migration towards brighter magnitudes due to the strong image crowding in this field. Since the 2MASS data are based on much lower resolution, the scatter is expected to be dominated by the uncertainties in the 2MASS magnitudes of the calibration stars.
3 Results
3.1 Cluster Appearance
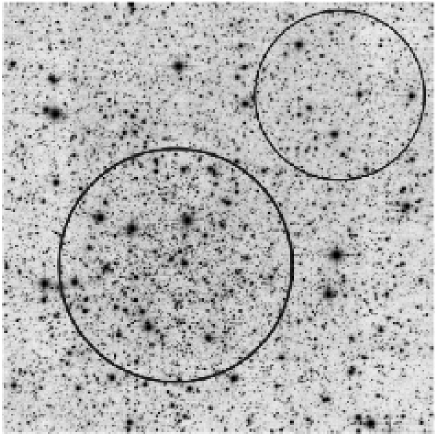
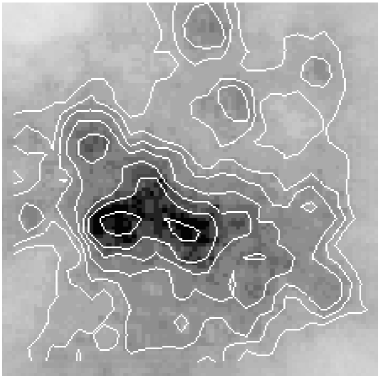
We show the K-band mosaic of the field around the cluster in Fig. 1. The cluster itself is positioned south-east of the centre. An increase in the stellar density can be seen. Due to the close proximity of the Galactic Plane the star density contrast between cluster and field is rather low. The cluster can more clearly be identified in the map showing the distance to the 85th nearest neighbour of each star (left panel in Fig. 2). In this panel one can easily identify a star density enhancement south-east of the image centre. The average star density in the cluster area is a bit less than twice as high as in the field/control area (upper right corner). Hence the star cluster itself possesses a smaller star density as the field integrated along the line of sight. The cluster shows no centrally condensed appearance, but rather a more or less uniformly increased star density across an extended region. A fit of the radial star density by a King-profile results in = 658″ and = 19540″.
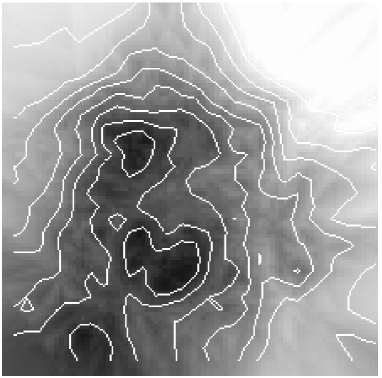
We have created a further nearest neighbour map using only stars that have colours and magnitudes consistent with them being core helium burning objects associated with the cluster (selection see below). In this case the contrast between the cluster and the field becomes much more clear. There are about five times more such stars per unit area in the cluster region than in the control field. In the right panel of Fig. 2 we show the distance to the 10th nearest neighbour for all these stars. There is some sub-structure visible in the map, indicating two regions (south and north of the cluster centre) where the density of these objects is enhanced. It is not clear if this effect is real, or just resembles a selection effect caused by our criteria for stars with acceptable photometry. The same applies to the structure seen in the nearest neighbour plot for all stars in the area.
3.2 Field star decontamination
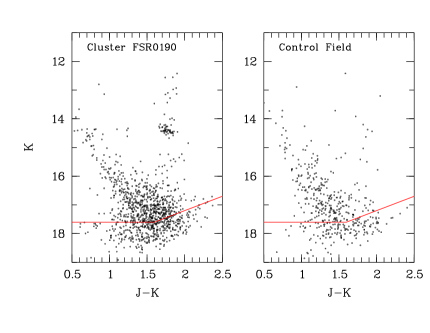
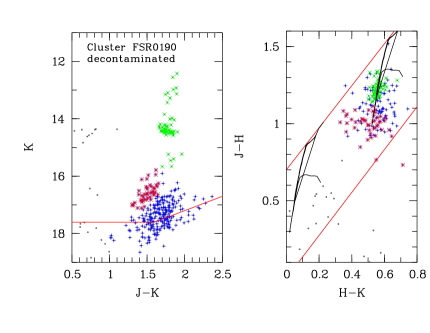
As discussed in Section 3.1, the population of field stars contributes significantly to the stellar density. Hence the analysis of the cluster properties is strongly hampered. This can be seen in the J-K vs. K colour-magnitude diagrams in Fig. 3. There we compare all stars detected in the area of the cluster (1st panel) and the control field (2nd panel). The different number of stars can be explained by the different areas covered by the cluster (4.52 square arcminutes) and the control field (2.38 square arcminutes). However, there are clearly differences in the two diagrams, most notably the group of stars in the cluster area at about J-K = 1.75 mag and K = 14.4 mag.
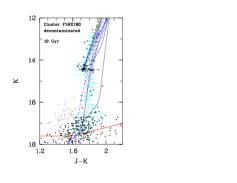
We have used the colour and magnitude information of the stars in the control field to statistically remove foreground and background stars from the cluster area. In particular we adopted the decontamination algorithm described in Bonatto & Bica 2007a . We used cell dimensions of J = 0.5 mag, (J-H) = 0.2 mag and (J-K) = 0.2 mag to compute the expected number of field stars. This number of field stars is then randomly removed from the objects in the cluster area. In panel 3 of Fig. 3 we show one such realisation of the decontamination of the cluster area, while the 4th panel shows the decontaminated H-K vs. J-H colour-colour diagram. Over plotted are the loci of main sequence and giant stars from a fit of a 10 Gyr and Z = 0.004 isochrone (see below), with and without reddening.
In the decontaminated cluster area we find the group of stars remaining at around J-K = 1.75 mag and K = 14.4 mag. These are interpreted as the core helium burning stars in the cluster. There are a number of brighter objects with similar colours, most probably RGB/AGB stars. All these objects form a well defined group in the colour-colour diagram. Furthermore, there are stars remaining in the J-K vs. K diagram with colours of J-K 1.5 mag and K 16 mag. This feature is identified with cluster main sequence stars close to the main sequence turnoff. These stars occupy a region in the H-K vs. J-H diagram that is consistent with this proposal. The larger scatter can be explained by their lower magnitudes. In the J-K vs. K diagram these stars are apparently split in two groups, one of which (about 40 stars) seems to be off-set towards bluer colours and brighter magnitudes (3rd panel of Fig. 3). We interpret this group as blue straggler stars (BSS) in the cluster and the second, much larger, group as the cluster main sequence turn-off. Note that some objects in the region of the suspected BSS might be unresolved binaries, which have not been removed by the decontamination procedure. The BSS interpretation is further supported by the following points: i) If the small group is used as main sequence turn-off we cannot find an isochrone (see Sect. 3.3 and Fig. 4) that fits all the cluster stars, i.e. the majority of objects around K = 17 mag lack an explanation. ii) The stars in the small group correspond to earlier spectral types when plotted in the H-K vs. J-H diagram. iii) The number of BSS and their homogeneous spatial distribution in the cluster are in agreement with the results of Davies et al. 2004MNRAS.349..129D (2004).
3.3 Isochrone Fitting
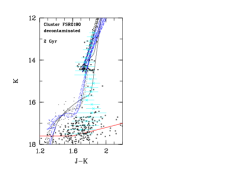
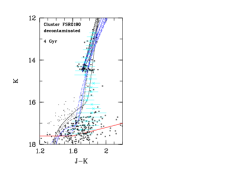
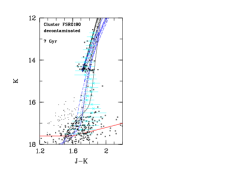
In order to constrain the basic cluster properties (age, metallicity, distance, reddening) we fit isochrones to the decontaminated J-K vs. K colour magnitude diagram. We used isochrones based on Girardi et al. 2002A&A…391..195G (2002) computed for the 2MASS filters111http://stev.oapd.inaf.it/ lgirardi/cgi-bin/cmd. For each case we matched the core helium burning stars in the isochrone and the observations by varying the reddening E(J-K) and the distance of the cluster. In Fig. 4 we show sets of isochrones with different ages for each panel (2, 4, 7, 10 Gyr). In each panel six isochrones are over plotted, using different metallicities ( = 0.0001, 0.0004, 0.001, 0.004, 0.008, 0.019). The panels also contain the observed distribution of cluster stars indicated by light-gray crosses and error bars, as well as our completeness limit (determined as the maximum of the K-band luminosity function). Note that we do not consider the suspected BSS stars when comparing the isochrones with the cluster stars (see below for some more detailed remarks).
From Fig. 4 it becomes apparent that isochrones with ages of 2 to 4 Gyr do not fit the observed upper end of the main sequence. The same applies also for all other lower ages. For ages above 7 Gyr, most isochrones fit the main sequence stars well, with maybe the exception of the lowest metallicities ( = 0.0001). In turn, the highest metallicity isochrones have difficulties explaining the distribution of RGB/AGB stars brighter then the core helium burning objects. The slope of the 0.008 isochrones in the colour-magnitude diagram is too shallow compared to the observations. We additionally can use the H-band information, i.e. match the isochrones with the position of the core helium burning objects in the H-K vs. J-H diagram (see right panel in Fig. 3). This requires a reddening of about =0.8 mag, and thus puts a tighter constraint on the metallicity, since the fit of the isochrones in the J-K vs. K diagram has the extinction as a free parameter. The metallicity range obtained from this process is [M/H] = 0.90.4 dex.
We have not used the suspected BSS stars in the comparison of the isochrones and the observations. If this group is considered as the main sequence turn-off, then the majority of stars below K = 16 mag in the cluster can not be explained (see e.g. left panel of Fig. 4). In case all the stars below K = 16 mag are main sequence turn-off stars the cluster will have an age lower than 7 Gyr, but still in excess of 2 Gyr.
Hence, we can constrain that the age of the cluster is larger than 7 Gyr, while the metallicity is most probably in the range of = 0.001 to 0.006 ([M/H] = 0.90.4 dex). The average distance from the Sun required for the fit is kpc, with an uncertainty of 1.0 kpc, mostly caused by the poorly constrained metallicity. The average values correspond to an age of 10 Gyr and = 0.004. The cluster would have a smaller distance for lower metallicities.
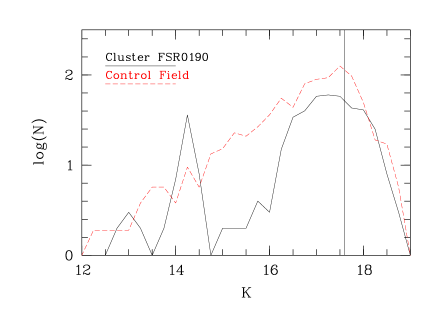
The cluster distance converts to a distance of = 10.5 kpc from the Galactic centre (assuming R⊙ = 7.2 kpc, Bica et al. 2006A&A…450..105B (2006)). The core radius of the cluster is then = 3.2 pc. In Fig. 5 we show the K-band luminosity function of the cluster area after decontamination, compared to the scaled control field. As already discussed with the nearest neighbour plots, the field star density is slightly higher than the average star density in the cluster. The number of stars in the core helium burning stage is about 50 (slightly depending on the decontamination). This can be used to estimate the total mass of the cluster. According to Salaris & Girardi 2002MNRAS.337..332S (2002) this corresponds to 103 104M⊙ for a population of stars with the age and metallicity range of FSR 0190. We also can integrate the brightness of all detected cluster stars to = 6.6 mag or = 4.7 mag (using V-K = 1.9, Leitherer et al. 1999ApJS..123….3L (1999)). Note that the mass and absolute brightness estimates should be considered lower limits, since a number of potential cluster RGB/AGB stars has been excluded from our analysis due to insufficient quality in the photometry. Up to 40 % of the stars in the cluster RGB region are affected, potentially almost doubling the mass estimate and increasing the integrated brightness by 0.5 mag.
4 Discussion and Conclusions
| Parameter | Value |
|---|---|
| R.A. (J2000) | 20 05 31.3 |
| DEC (J2000) | 33 34 09 |
| [deg] | 70.7302 |
| [deg] | 0.9498 |
| [mag] | 0.80.1 |
| Age [Gyr] | 7 |
| M/H | 0.90.4 |
| [kpc] | 10.01.0 |
| [kpc] | 10.50.8 |
| [pc] | 17015 |
| [pc] | 3.20.4 |
| [pc] | 9.72.0 |
| [mag] | 6.60.2 |
| Mcl [104 M⊙] | 101 |
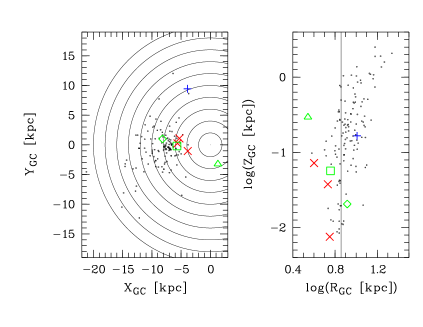
We have summarised the determined properties of the cluster FSR 0190 in Table 1. Despite the significant contamination with field stars we can classify FSR 0190 as an old cluster with an age of more than 7 Gyr. In Fig. 6 we compare the clusters position in the Galactic plane with the other known old (age 1 Gyr) Galactic clusters taken from the WEBDA222http://www.univie.ac.at/webda/ database. Also plotted in this diagram are the so far verified old clusters from the sample of Froebrich et al. 2007b (crosses, FSR 0031/0089/1744, Bonatto & Bica 2007b ); triangle, FSR 1735, GlCl, Froebrich et al. 2007a ; square, FSR 1767, GlCl, Bonatto et al. 2007MNRAS.in.pressB2 (2007); lozenge, FSR 0584, GlCl, Bica et al. 2007A&A…472..483B (2007)). The figure shows, that FSR 0190 might be one of the most distant known old open clusters in the Milky Way. There are only a few other known clusters with comparable ages and distances. The cluster also nicely follows the relation of distance to the Galactic Plane with , as can be seen in the right panel of Fig. 6. Note that FSR 1735 does not follow the relation in this plot, in accordance to its GlCl nature.
Could FSR 0190 also be another so far unknown GlCl of the Milky Way? There are obviously no definite arguments against such an interpretation. According to Fig. 4 an age above 8 Gyr and a metallicity below [M/H] = -0.75 dex (the most common values for the galactic GlCl sample – Harris 1996AJ….112.1487H (1996)) are certainly possible for this object. The integrated luminosity of = 4.7 mag, or slightly brighter, would place it at the fainter end of the GlCl distribution, well within the Palomar-like GlCl regime. This type of object might be considerably more abundant given the number of recent discoveries (e.g. Bonatto et al. 2007MNRAS.in.pressB2 (2007) and Bica et al. 2007A&A…472..483B (2007)). However, its position in the Galaxy nicely follows the relation for old Galactic clusters, and its optical appearance does not show a centrally condensed cluster. It is hence not possible to be absolutely certain that FSR 0190 is a GlCl. Nevertheless, such a possibility can currently not be excluded.
With the identification of FSR 0190 as a distant old Milky Way cluster, now seven objects in the sample of Froebrich et al. 2007b have been confirmed as so far unknown old Milky Way clusters. The distribution of these objects shows that the FSR-sample contains a number of clusters in the least complete regions, i.e. the inner Galaxy and/or distant objects. A continued effort to classify the other cluster candidates will further enhance the completeness of the known cluster sample. This will greatly improve studies of star cluster mortality, as well as the formation history of the Milky Way.
acknowledgments
We would like to thank the referee Sergio Ortolani for helpful comments to improve the analysis of our data. The United Kingdom Infrared Telescope is operated by the Joint Astronomy Centre on behalf of the Science and Technology Facilities Council of the U.K. The data reported here were obtained as part of the UKIRT Service Program. This research has made use of the WEBDA database, operated at the Institute for Astronomy of the University of Vienna.
References
- (1) Bertin, E., Arnouts, S. 1996, A&AS, 117, 393
- (2) Bica, E., Bonatto, C., Barbuy, B., Ortolani, S. 2006, A&A, 450, 105
- (3) Bica, E., Bonatto, C., Ortolani, S., Barbuy, B. 2007, A&A, 472, 483
- (4) Bonatto, C., Bica, E. 2007, MNRAS, 377, 1301
- (5) Bonatto, C., Bica, E. 2007, A&A, in press
- (6) Bonatto, C., Bica, E., Ortolani, S., Barbuy, B. 2007, MNRAS, in press
- (7) Cavanagh, B., Hirst, P., Jenness, T., Economou, F., Currie, M.J., Todd, S., Ryder, S.D. 2003, in Astronomical Data Analysis Software and Systems XII ASP Conference Series, H.E. Payne, R.I. Jedrzejewski, and R.N. Hook, eds., 295, 237
- (8) Davies, M.B., Piotto, G., de Angeli, F., 2004, MNRAS, 349, 129
- (9) Dutra, C.M., Santiago, B.X., Bica, E. 2002, A&A, 381, 219
- (10) Froebrich, D., Meusinger, H., Scholz, A. 2007, MNRAS, 377, 54L
- (11) Froebrich, D., Scholz, A., Raftery, C.L. 2007, MNRAS, 374, 399
- (12) Froebrich, D. & del Burgo, C. 2006, MNRAS, 369, 1901
- (13) Girardi, L., Bertelli, G., Bressan, A., et al. 2002, A&A, 391, 195
- (14) Harris, W.E. 1996, AJ, 112, 1487
- (15) Leitherer, C., Schaerer, D., Goldader, J.D., et al. 1999, ApJS, 123, 3
- (16) Mathis, J.S. 1990, ARA&A, 28, 37
- (17) Robin, A.C., Reylé, C., Derrière, S., Picaud, S. 2003, A&A, 409, 523
- (18) Roche, P.F., Lucas, P.W., Mackay, C.D., et al. 2003, in Instrument Design and Performance for Optical/Infrared Ground-based Telescopes. Edited by Iye, Masanori; Moorwood, Alan F. M. Proceedings of the SPIE, 4841, 901
- (19) Salaris, M., Girardi, L. 2002, MNRAS, 337, 332
- (20) Skrutskie, M.F., Cutri, R.M., Stiening, R., et al. 2006, AJ, 131, 1163