The HELLAS2XMM survey: XI. Unveiling the nature of X-ray Bright Optically Normal Galaxies 111Based on observations made at the European Southern Observatory, Paranal, Chile (ESO Programme ID 69.A-0554).
Abstract
Aims. X-ray Bright Optically Normal Galaxies (XBONGs) constitute a small but not negligible fraction of hard X-ray selected sources in recent Chandra and XMM-Newton surveys. Even though several possibilities were proposed to explain why a relatively luminous hard X-ray source does not leave any significant signature of its presence in terms of optical emission lines, the nature of XBONGs is still subject of debate. We aim to a better understanding of their nature by means of a multiwavelength and morphological analysis of a small sample of these sources.
Methods. Good-quality photometric near-infrared data (ISAAC/VLT) of four low-redshift () XBONGs, selected from the HELLAS2XMM survey, have been used to search for the presence of the putative nucleus, applying the surface-brightness decomposition technique through the least-squares fitting program GALFIT.
Results. The surface brightness decomposition allows us to reveal a nuclear point-like source, likely to be responsible of the X-ray emission, in two out of the four sources. The results indicate that moderate amounts of gas and dust, covering a large solid angle (possibly 4) at the nuclear source, combined with the low nuclear activity, may explain the lack of optical emission lines. The third XBONG is associated with an X-ray extended source and no nuclear excess is detected in the near infrared at the limits of our observations. The last source is associated to a close (d 1 arcsec) double system and the fitting procedure cannot achieve a firm conclusion.
Key Words.:
galaxies: active - X-rays:galaxies1 Introduction
Thanks to the Chandra and XMM-Newton surveys, the hard X-ray sky is now probed down to a flux limit where the bulk of the X-ray background is almost completely resolved into discrete sources (Hasinger et al. 2001; Alexander et al. 2003; Bauer et al. 2004; Worsley et al. 2004, 2005). Extensive programs of multiwavelength follow-up observations showed that the large majority of hard X-ray selected sources are identified with Active Galactic Nuclei (AGN) spanning a broad range of redshifts and luminosities. At variance with optically selected quasars, X-ray selected AGN are characterized by a much larger spread in their optical properties, especially for what concerns the intensity of the emission lines. Indeed, a sizable fraction of relatively luminous X-ray sources hosting an active nucleus would not have been easily recognized as such on the basis of optical observations either because associated with very faint ( 24) counterparts (e.g., Fiore et al. 2003; Mignoli et al. 2004; Civano et al. 2005) or due to the lack of AGN emission lines in their optical spectra. The latter class of sources is variously termed as “optically-dull”, “optically normal” or XBONGs (X-ray Bright Optically Normal Galaxies; Comastri et al. 2002). The common meaning of these definitions is that they lack evidence of accretion-driven activity in their optical spectra, in contrast with “normal” Seyfert galaxies and quasars. Their X-ray luminosities ( erg s-1), X-ray spectral shape and X-ray-to-optical flux ratio (X/O222Where X/O is defined as .) suggest AGN activity of moderate strength. Originally discovered in early Einstein observations (Elvis et al. 1981) and named optically dull galaxies, the interest on the nature of these sources has gained a renewed attention after the discovery of several examples in XMM-Newton and Chandra surveys (Fiore et al. 2000; Comastri et al. 2002a,b; Georgantopoulos et al. 2005; Kim et al. 2006). Several possibilities were proposed in the literature in order to explain why a relatively luminous, hard X-ray source does not leave any significant signature of its presence in the form of emission lines.
A simple explanation favoured by Moran et al. (2002) and more recently by Caccianiga et al. (2007) for faint sources in the Chandra deep fields and brighter object in the XMM-Newton XBS survey, respectively, is dilution by the host galaxy starlight. The combination of optical faintness and lack of strong emission lines in the observed wavelength range for distant Chandra sources or the inadequate observing set-up among brighter nearby XMM-Newton objects (Severgnini et al. 2003) may account for the XBONG properties. More in general, if the contrast between the host galaxy starlight and nuclear emission is high, AGN emission lines may easily be undetected. The physical reason may be ascribed to obscuration, most likely with a large covering factor, or to the fact that the lines are not efficiently produced by the central engine.
If XBONGs are merely obscured AGN, two hypotheses may be envisaged:
In order to explain the multiwavelength properties of the XBONG prototype PKS 0312018, also known as P3, Comastri et al. (2002) suggested heavy obscuration by Compton-thick gas covering almost 4 at the nuclear X-ray sources. In this way, no ionizing photons can escape to produce the narrow emission lines which are observed in “normal” Type 2 narrow-line AGN which are thought to have a lower covering fraction following the AGN Unified Scheme (but see Section 3 for a recent re-analysis of the X-ray data of P3).
According to a detailed multiwavelength analysis of “optically-dull” galaxies
in the Chandra deep fields, Rigby et al. (2006) conclude that extranuclear
dust in the host galaxy plays an important role in hiding the emission lines.
Alternatively, XBONGs may be members of a class, or classes, of exotic objects for which emission lines are either intrisically weak or absent:
Radiatively Inefficient Accretion Flows (RIAFs) are expected at accretion rates well below those inferred for Seyferts and quasars. A distinctive property of low accretion-rate flows is that the standard Shakura-Sunyaev accretion disk is truncated at a relatively large inner radius. As a consequence, it cannot generate the “big blue bump” and enough UV photons to photoionize the line-emitting circumnuclear gas. The infalling gas is heated to high temperatures and emits a hard X-ray power-law by upscattering of low-energy seed photons. According to Yuan & Narayan (2004), the SED of source P3 could be reproduced by a RIAF model.
XBONGs could be extreme BL Lac objects in which the featureless non-thermal continuum is much weaker than the host galaxy starlight. Following Fossati at al. (1998), XBONGs could belong to the low-luminosity tail of the blazar spectral sequence based on the anti-correlation between luminosity and frequency of the synchrotron peak.
A highly speculative possibility is that of a transient AGN phenomenon in the process of tidally disrupting a star. If this were the case, the X-ray emission should be witnessing the transient accretion phenomenon (see Komossa et al. 2004 for extreme variability events in ROSAT observations; see also Gezari et al. 2006 for a luminous flare observed in the GALEX Deep Imaging Survey). The transient is most likely over in subsequent follow-up optical observations.
Finally, it should be noted that diffuse emission from a galaxy group, whose X-ray extended emission may have escaped detection in low signal-to-noise X-ray observations, is also possible and indeed observed in a few cases (Georgantopoulos et al. 2005).
While a unique solution may not necessarily hold for all the XBONGs observed in different surveys, they represent a useful benchmark for a better understanding of the AGN activity and, as such, deserve further studies. Ideally, one would need sensitive, high-spatial resolution, multiwavelength observations from radio to X-rays. As a first step, in the following we use good-quality photometric near-infrared data obtained with ISAAC at VLT of four low-redshift () XBONGs, selected in the HELLAS2XMM survey to search for the presence of a putative nucleus which has escaped detection in the optical spectroscopy. The rather obvious advantage of near-infrared data is that the effects of dust reddening are minimized and that the nuclear emission in this band should rise more rapidly than the stellar light due to the reprocessing by hot dust. At the same time, the excellent quality of the near-IR images makes possible to apply a surface brightness decomposition technique, already successfully applied by several authors (e.g. Sánchez et al. 2004; Peng et al. 2006), to search for weak unresolved nuclear emission down to faint near-infrared magnitudes. We also discuss the broad-band properties of the four XBONGs using available multiwavelength data. Throughout the paper we assume a cosmological model with = 70 km s-1 Mpc-1, = 0.3 and .
2 The sample
In the following, the term XBONG is referred to relatively nearby ( 0.3), low luminosity ( erg s-1), hard X–ray (2–10 keV) selected sources with an optical spectrum typical of early type galaxies. All together they represent a small fraction ( 5%) of the sources in hard X–ray surveys. The four XBONGs were selected from the HELLAS2XMM survey: 3 sources belong to the one square degree field (1dF) sample (see Baldi et al. 2002 for a description of the X–ray data and Fiore et al. 2003 for the optical identification process), while one object (Abell 1835140) is from the survey extension (Cocchia et al. 2007). They represent 40% of the HELLAS2XMM XBONG sample (10 objects), and have been selected for infrared observations on the basis of a high quality optical spectrum and bright optical magnitudes (R18).


The spectroscopic observations were obtained at the ESO 3.6m telescope equipped with EFOSC2 during different observing runs in 2001. The optical spectra, all of them characterized by absorption features over a red stellar continuum, are shown in Fig. 1. While the relatively large slit width (2 arcsec) used in the spectroscopic observations do not preserve us from a galaxy light contamination (and consequent line dilution), the good signal-to-noise ratio (S/N13–20) and the well suited spectral range (including the expected wavelength of the and lines, with the exception of Abell 1835140) allow us to place firm constraints on the line fluxes.
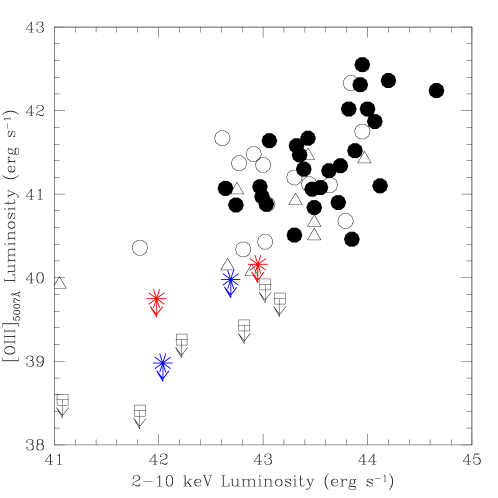
The corresponding luminosity upper limits for the O[III] line of the four XBONGs (starred symbols in Fig. 2) are in the range 1039–1040 erg s-1, about one order of magnitude fainter than that measured in the optical spectra of HELLAS2XMM broad-line (BLAGN, filled circles) and narrow-line (NLAGN, open circles) AGN with comparable X-ray luminosity (see Fig. 2 and Cocchia et al. 2007). The upper limits are more than one order of magnitude below the relation between X–ray luminosity and O[III] to X–ray luminosity ratio obtained by Netzer et al. (2006) for a large sample of X–ray selected Type 1 and Type 2 AGN spanning the same range of X–ray luminosities. We also note that only 0.4% of DR6 SDSS AGN (about 7000 quasars; Adelman-McCarthy et al. 2007) have O[III] luminosity below 1040 erg s-1.
The redshifts obtained from the position of the principal absorption lines are for PKS 03120017, PKS 03120018, Abell 2690013 and Abell 1835140, respectively (Fiore et al. 2003; Cocchia et al. 2007). The X-ray unabsorbed luminosities are reported in Table LABEL:tabxray. Radio observations at 5 GHz are available for the two objects in the PKS 0312-77 field. Source PKS 03120017 was detected with a flux density of 1.3 mJy at 5 GHz, while source PKS 03120018 remains undetected (F 0.15 mJy at the 3 level). An observations at 8.7 GHz is also available for source PKS 03120017 which was detected with a flux density of 0.5 mJy.
3 X-ray spectral analysis
The results of the spectral analysis of the X-ray sources in the 1dF sample are presented in Perola et al. (2004) with particular emphasis towards the statistical properties of the sample. The X-ray spectra of the four XBONGs discussed here were re-analyzed including an additional observation of the Abell 1835140 field (not included in the Perola et al. paper) using the most recent calibrations. The data were processed using standard sas333XMM-Newton Science Analysis System; see http://xmm.vilspa.esa.es/external/xmm_sw_cal/sas_frame.shtml. v6.1.0 and ftools tasks.
The pn spectra were grouped with a minimum of 10 counts per bin (for PKS 03120018 and PKS 03120017) and 15 counts per bin (for Abell 26900013 and Abell 1835140) using the task grppha, and fitted with xspec v11.3.0 (Arnaud 1996), while MOS1 and MOS2 data, having much lower counting statistics, were left unbinned and fitted with the C-statistic (Cash 1979). We checked and found consistency between the pn and MOS data. However, the X-ray spectral results reported in Table LABEL:tabxray and the best-fitting spectra shown in Fig. 3 are referred to the pn data alone, given the lower counting statistics of the MOS data.


| Src. ID | kT | /d.o.f | F | |||
|---|---|---|---|---|---|---|
| (keV) | (cm-2) | (erg cm-2 s-1) | (erg s-1) | |||
| PKS 03120017 | 2.4 | 3.7/11 | 1.4 | 5.0 | ||
| PKS 03120018 | 2.1 | 6.9 | 9.6/9 | 1.5 | 1.1 | |
| Abell 26900013 | 0.73 | 1.6 | 34.4/25 | 1.5 | 9.6 | |
| Abell 1835140 | 1.5 | 4.3 | 14.0/12 | 5.3 | 9.0 | |
| 1.7 | 6.5 | 32.9/35 | 1.8 | 3.3 |
In the following we summarize the main X-ray spectral results.
Two sources, PKS 03120018 and Abell 1835140, are best fitted by
an absorbed power law with photon index in the range
1.5–2.1 and column densities ( cm-2), typical
of a mildly obscured AGN. Despite the relatively large errors in the determination
of the X-ray spectral parameters, this analysis seems to rule out
Compton-thick absorption, at least in the energy range covered by XMM-Newton.
The radio-loud
source PKS 03120017 is best fitted by a relatively steep 2.4 spectrum (but consistent with 2)
and no absorption in excess to the Galactic value (see Table LABEL:tabxray).
Abell 26900013 is well fitted using a thermal (mekal) model at soft
energies and a weakly constrained power-law tail at higher (2 keV) energies.
The thermal spectrum is consistent with the extended appearance of the X-ray emission,
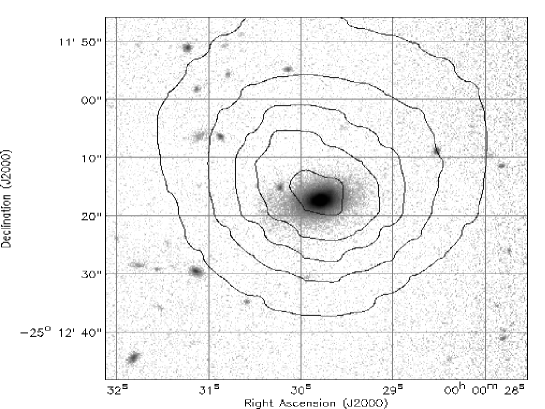
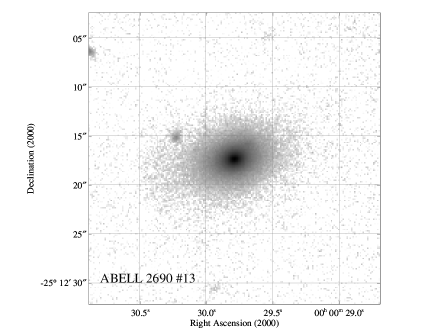
as shown by the overlay of the X-ray contours on the Ks-band image (see Fig. 4).
Significant X-ray flux variability (a factor about 3) is present between the two XMM-Newton observations of Abell 1835140. This object was also observed twice and detected by Chandra (in 1999 and 2000, for 20 and 10 ks, respectively). The Chandra data (especially the data of the first and longer observation) confirmed the XMM-Newton spectral results and allowed for a long-term variability study of this source. Over 3 and half years, Abell 1835140 was found to be variable by a factor of 7.5, with its 2–10 keV flux increasing from the value of in 1999 to in 2003, with no evidence for significant changes in the X-ray spectral parameters. Even if the flux variability could be connected with the tidal disruption of a star, the increasing of the X-ray flux allows us to rule out such a possibility.
4 Near-Infrared data analysis
4.1 Near-Infrared imaging observations
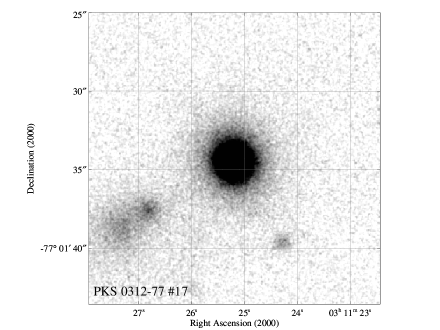
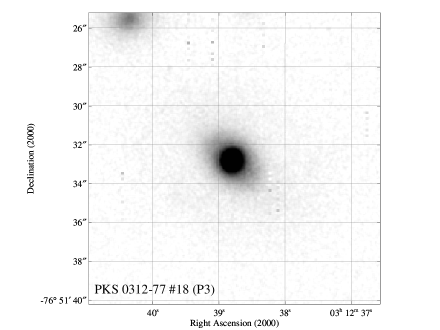
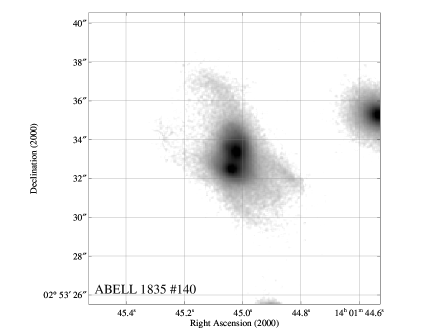
Deep near-infrared observations have been carried out using the Infrared Spectrometer and Array Camera () mounted on the ESO VLT (Very Large Telescope). is equipped with a Rockwell Hawaii 10241024 HgCdTe array, with a pixel scale of 0147/pixel and a field of view of 25 25. The observations have been collected in service mode over several nights during September 2002 under good seeing conditions (08). The ISAAC images were taken in two near-IR bands (the and Ks444The Ks (K-short) filter is centered at shorter wavelenght than the standard filter in order to reduce thermal background. filters) and were reduced using the DIMSUM555Deep Infrared Mosaicing Software, developed by P.Eisenhardt, M.Dickinson, A.Stanford and J.Ward., and available at the site ftp://iraf.noao.edu/contrib/dimsumV2. package, following standard procedures. A detailed discussion on the data reduction of similar images taken for other sources revealed in the HELLAS2XMM 1dF is reported in Mignoli et al. (2004). The total exposure times for each galaxy is 600 sec in and 1800 sec in Ks band. The effective seeing on final frames ranges between 0.5 and 0.8 arcsec (FWHM). The magnitude limits for point-like sources are about (lim)=22 and Ks(lim)=21.5 in all the images. The Ks-band images of all the four sources are shown in Figure 5.
4.2 The fitting procedure
In order to search for the presence of a putative nucleus, we applied the surface brightness decomposition technique using GALFIT (Version 2.0.3b, Peng et al. 2002), a two-dimensional algorithm designed to extract structural parameters directly from galaxy images combining several analytical models and by convolving them with the image Point Spread Function (PSF). The PSF has been modeled adopting several field stars in each ISAAC image. The fitting has been performed in a box around each object large enough (220220 pixels) to contain most of the bulge.
The fitting procedure described below was performed separately in both and Ks bands, allowing us to cross-check the results and test for a possible color trend. In order to better constrain the galaxy structural parameters (magnitude and effective radius), first we fitted each object in the band, where the AGN contribution to the total light was expected to be lower (according to a standard AGN SED), as actually found in our analysis. Then we applied GALFIT to the Ks-band images, using the galaxy parameters obtained in the band as start-up values for the nuclear decomposition.
As a first guess of the profile of the host galaxy, we applied a Sérsic model (Sérsic 1968) of the form:
| (1) |
where is the effective surface brightness, the effective radius, the Sérsic index, and a constant determined from in order to have half of the integrated flux within . The Sérsic index assumes the value in case of exponential profile and value in case of a de Vaucouleurs profile (de Vaucouleurs 1948). A fit with a Sérsic model returns 6 in all the sources. Since this index is higher than the typical values found in early-type galaxies (e.g. Andredakis et al. 1995; Cassata et al. 2005) and given the early type like galaxy spectra of our sources, we adopted a de Vaucouleurs profile, hereafter referred to as MODEL 1.
If residual emission in the innermost region were still present after fitting the galaxy profile with MODEL 1, we added the contribution of a point-like source (MODEL 2). The latter is modeled using the PSF profile obtained by averaging stars in the field. The centroid of the unresolved component and that of the host galaxy have been linked each other in the fitting procedure. We considered the unresolved component as detected if (1) the significantly improves with the inclusion of the nuclear component (see Section 4.3) and (2) it is brighter than the image magnitude limit for point-like sources. The results of the fitting are shown in Table LABEL:galfit.
In order to check the GALFIT capabilities to detect a faint unresolved source at the center of a bright galaxy, accurate simulations were performed using the IRAF task mkobject. We started with a profile and then a point-like source has been added. In the simulations, we adopted a grid of magnitudes in the range Ks=17 – 22 for the point-like component and Ks=14 – 22 for the host galaxy; different effective radii (from 30 to 120 pixels) for the host component have been used. The input parameters have been chosen in an appropriate range to reproduce the observed data and to span a wider but realistic parameter space. The simulated images have been convolved with the seeing and the noise of our images; the PSF has been modeled with the parameters determined from the field stars. We applied GALFIT on the simulated sources first modeling with a de Vaucouleurs profile and then adding a central unresolved component, as performed for the XBONGs. The fitting results are fully consistent with the input parameters. Uncertainties () on the determination of the nuclear magnitude have been found in the case of a very faint (Ks 22.5) unresolved source hosted by a bright (Ks 15) galaxy. We conclude that at the magnitude limit of our images for point-like sources, the errors on the parameters due to the GALFIT detection capabilities are not affecting our results significantly.
4.3 The fitting results
| id | band | Model | mhost | reff (kpc) | mnucleus | d.o.f. | ||
|---|---|---|---|---|---|---|---|---|
| PKS03120017 | 1 | 16.940.03 | 4.790.51 | 45983 | 48835 | 0.94 | ||
| 2 | 16.920.05 | 5.640.86 | 20.750.29 | 45614 | 48832 | 0.93 | ||
| Ks | 1 | 15.240.01 | 4.960.17 | 54680 | 48835 | 1.12 | ||
| Ks | 2 | 15.210.01 | 6.500.10 | 18.390.24 | 49722 | 48832 | 1.02 | |
| PKS03120018 | 1 | 16.510.02 | 3.730.30 | 75401 | 48835 | 1.54 | ||
| 2 | 16.520.01 | 4.030.40 | 20.300.35 | 67046 | 48432 | 1.37 | ||
| Ks | 1 | 15.250.01 | 3.300.05 | 85728 | 48835 | 1.75 | ||
| Ks | 2 | 15.200.01 | 5.040.20 | 18.090.10 | 71944 | 48832 | 1.47 | |
| Abell2690013 | 1 | 15.410.01 | 7.340.10 | 51227 | 48835 | 1.05 | ||
| Ks | 1 | 14.290.01 | 6.860.20 | 106194 | 48835 | 2.17 |
The best-fitting parameters (mhost, radius, mnucleus) obtained in each band for MODEL 1 and MODEL 2 are reported in Table LABEL:galfit. The fifth column of Table LABEL:galfit gives the effective radius, which is always larger than the seeing disk (up to 3.5 kpc at z = 0.3). Since the uncertainties quoted by GALFIT are very small (see Peng et al. 2002), the errors reported in Table LABEL:galfit have been estimated comparing the best-fitting results obtained using the different stars in the images one by one as a model for the PSF; this method has been applied because it is known that steep profiles are very sensitive to the accuracy of the used PSF (see the online manual666http://zwicky.as.arizona.edu/ cyp/work/galfit/TFAQ.html.).
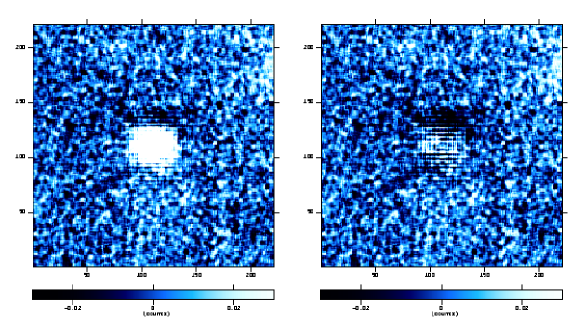
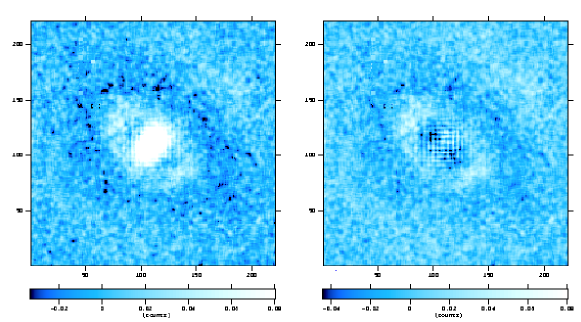
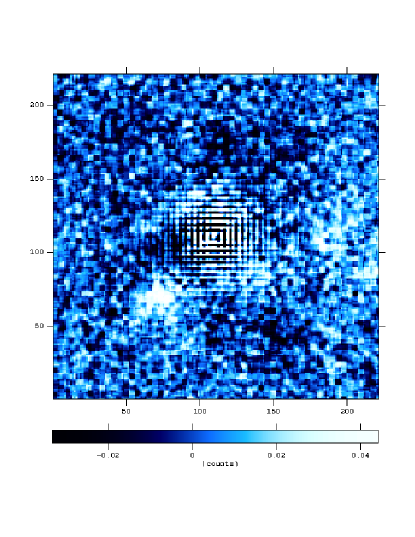
In two out of the four sources (PKS 03120017 and PKS 03120018), we found clear evidence for an unresolved component on top of the elliptical galaxy profile. The Ks-band residual images, obtained by subtracting the fitted models from the original images, are shown in Fig. 6; the residuals obtained with MODEL 1 are shown in the left panels, while those obtained with MODEL 2 are shown in the right panels. Introducing an unresolved component improves the quality of the fit, mostly in the Ks band, as evident from the residual images and the values reported in Table LABEL:galfit. The excess with respect to the bulge profile in the innermost region increases towards longer wavelengths. The variation in the reduced , obtained by adding a nuclear component, is significant at a high ( 99.9999%) confidence level, estimated using an F–test, for both sources. We note that the statistic is computed over a very large number of degrees of freedom (see Table LABEL:galfit), corresponding to each individual pixel in the image. In order to further assess the improvement in the statistic obtained by the addition of a nuclear component, whose contribution is relevant only over a small portion of the image, we ran GALFIT (both MODEL 1 and MODEL 2) over the central innermost part of the image (2525 pixels) keeping fixed the best fit parameters obtained by the analysis of the entire image. Also in this case, the fit quality improves significantly ( 99.9999% level, according to the F–test) using MODEL 2 with respect to MODEL1, indeed enforcing the findings obtained considering a larger region.
The fitting procedure found no evidence for a unresolved nuclear component in Abell 2690013. The residual images obtained with MODEL 1 in both and Ks bands show no need for a central unresolved source in the fitting model; the residuals in the Ks band are shown in Fig. 7. If a nuclear component is present, its magnitude is fainter than the limit of our observations. The absence of a central unresolved component is also supported by the X-ray analysis: the X-ray emission is well fitted by a thermal model consistent with the extended appearance, as shown in Figure 4.
Thanks to the high quality of the ISAAC images with sub-arcsec seeing, it has been possible to unveil the complex morphology of source Abell 1835140. It is a close interacting system, composed by two nearby bulges embedded in a common envelope (see bottom right panel of Fig. 5). The angular separation of the two nuclei is 0.9 arcsec. The morphological fitting was attempted including simultaneously the two components, despite the small angular separation. We fitted a Sérsic model for both galaxies: in the band the fit did not provide a statistically reasonable solution (i.e., by means of ), while in the Ks band we obtained a steep profile for the northern nucleus and a flatter profile for the southern one. Therefore we performed a new fit, adding an unresolved component only to the northern source and a de Vaucouleurs profile to both the bulges, as performed for the other XBONGs. The results are suggestive of the presence of a point-like component in the northern source of the double system. Since the fitting did not provide a statistically acceptable description of the two sources, leaving significant residuals because of their low spatial separation, this result should be considered just qualitative.
4.4 Near-Infrared color
The surface brightness decomposition technique allowed us to separate the galaxy from the unresolved nuclear contribution in two out of four XBONGs. The host galaxy parameters (mhost, re) and the –Ks colors are in good agreement with the Ks-band luminosity vs. radius relation (Pahre 1999) and the color typical of elliptical galaxies (Cutri et al. 2000; Mannucci et al. 2001), respectively, lending further support to the morphological analysis. The total luminosity of the galaxies in our sample is of the order of of early-type galaxies in the Ks band (Kochanek et al. 2001).
The nuclear near-infrared colors of PKS 03120018 (–Ks=) and PKS 03120017 (–Ks=) are reported in Figure 8 along with literature data. Dots represent the optically selected quasars with near-infrared counterparts in the 2MASS (Barkhouse et al. 2001), while the open squares are the 2MASS selected red quasars from Hutchings et al. (2003) in a redshift range (0.1 0.3) similar to that of our sources.
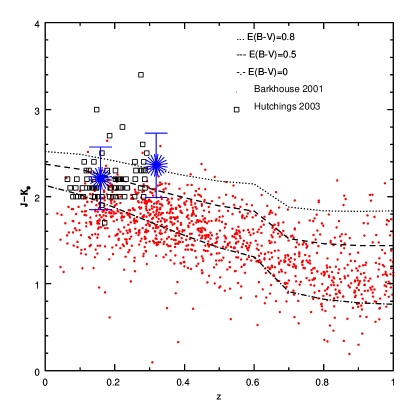
Even if affected by large uncertainties, mainly due to the extremely faint -band magnitudes, the –Ks colors of the two XBONGs are consistent with those of 2MASS red quasars at the same redshift. The tracks plotted in Fig. 8 represent the color-redshift relations for a composite quasar template from the Large Bright Quasar Survey (LBQS; Francis et al. 1991) extended to the near-IR using the mean radio-quiet quasar energy distribution (SED) by Elvis et al. 1994 (see also Maiolino et al. 2000). We have included the effect of dust attenuation on the LBQS template using a dust screen model and the SMC extinction law (Pei at al. 1992), to keep into account the presence of nuclear or galactic dust. The curves represent different extinction values (=0, 0.5, 0.8 from bottom to top). At the face value, the best-fit –Ks color of the nuclei implies which corresponds to cm-2 if we use a standard Galactic dust-to-gas ratio777 cm-2 (Bohlin et al. 1978). as a conversion factor.
5 Simulated optical spectra
In order to check whether the extinction values, estimated from the nuclear near-infrared colors (–Ks), could explain the lack of the optical emission lines, we compared the observed optical spectra of our XBONGs with simulated optical spectra. We adopted the SDSS quasar composite spectrum (Vanden Berk et al. 2001) extended to the near infrared (see previous section) to reproduce the nuclear component.
The approach we used is as follows:
-
1.
using the IRAF task deredden, the quasar template was reddened with different extinction values: =0, 0.2, 0.4, 0.6, 0.8;
-
2.
the templates were redshifted to the redshift of the sources using the IRAF task dopcor;
-
3.
the spectra were normalized to the Ks band on the basis of the estimated magnitude for the unresolved central source;
-
4.
the nuclear simulated spectra were summed to the observed XBONG optical spectra.
We computed simulated spectra for both PKS 03120017 and PKS 03120018. In spite of the good signal-to-noise ratio of the observed spectra, the emission line is not visible in all the summed spectra, even in the case without reddening. On the contrary, it is possible to reveal the presence of an emission line at the expected wavelength of the redshifted in the spectra with =0.
In order to quantify the emission-line detection limits as a function of , we measured the equivalent width (EW) of the in the simulated spectra. The average EW of the line in the SDSS QSO composite spectrum is 190 (Vanden Berk et al. 2001). Since the EW is defined as the ratio between the line and the continuum fluxes, its value does not change applying the extinction in the nuclear simulated spectra. On the contrary, the EW in the total spectra depends from both the nuclear and the steady host galaxy continuum, thus it decreases for increasing extinction. Figure 9 shows the equivalent width measured in the summed spectra as a function of the along with the 3 level of detectability (dot-dashed line) for both sources. The EW detection limit has been estimated following the relation presented in Mignoli et al. (2005):
| (2) |
where is the resolution element (in Å) of our spectra, is the significance level of the detectable line, expressed in terms of above the continuum noise, and is the signal-to-noise ratio of the continuum in the total spectra. The extinction values for which the equivalent width is lower than the estimated detection limit is , in fair agreement with the values found with the near-infrared morphological analysis. In the next section we will compare all the extinction values found so far. The above described results are not strongly dependent on the assumed EW. In fact, also adopting a lower value (70 , corresponding to the 2 lower bound of the average intensity of FBQS survey; Brotherton et al. 2001 888The dispersion around the average H value is not quoted for the SDSS composite spectrum.), a weak line is detected in the simulated spectra with null extinction.

6 Discussion
The surface brightness decomposition technique allowed us to detect and separate the nuclear from the galaxy contribution in two (PKS 03120018 and PKS 03120017) out of the four XBONGs.
There is no evidence for the presence of a significant nuclear component in Abell 2690013; the magnitude and the effective radius of the galaxy are in good agreement with the Kormendy relation extended to the Ks band (Pahre 1999). Moreover, the presence of an active nucleus could be ruled out also thanks to a more careful analysis of the X-ray image. The X-ray source is clearly extended (Fig. 4) and the X-ray spectrum is well fitted by a thermal model.
The presence of two close (0.9 arcsec) galaxies embedded in a common halo with disturbed morphology in source Abell 1835140 prevented us from a detailed analysis with GALFIT. A qualitative analysis suggested the presence of a unresolved component in the northern source of the system, possibly associated with the X-ray emission.
The estimated nuclear –Ks colors, even if affected by large errors due to the uncertainties on the nuclear -band magnitudes, are consistent with extinction values of 0.5 and 0.8 for PKS 03120018 and PKS 03120017, respectively. For both sources, the lower limit found with the optical simulated spectra, as explained in Section 5, is . These values are in agreement with the gas absorption column densities found with the X-ray spectral analysis, assuming a Galactic dust-to-gas ratio (Bohlin et al. 1978).
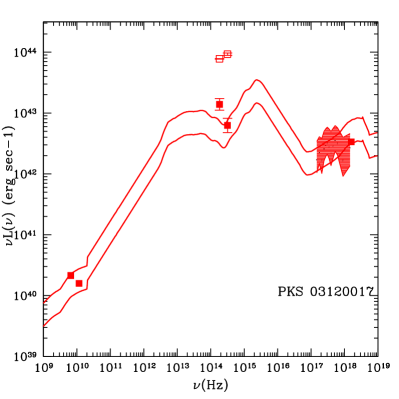
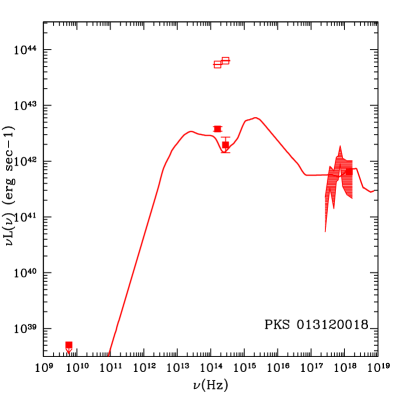
The SEDs of PKS 03120017 and PKS 03120018 are reported in Figure 10 and 11. Open squares represent the host galaxy and filled squares the nuclear emission. The X-ray spectra are the same as Figure 3, taking into account the errors on the X-ray flux. We note that source PKS 03120017 has been detected at 5 and 8.7 GHz, with flux densities of 1.29 and 0.55 mJy, respectively. In the left panels the data are compared with the Type 1 AGN template from Elvis et al. (1994), normalized to match the 5 keV rest-frame luminosity for both sources as well as the 5 GHz rest frame luminosity for PKS 03120017. The X-ray to near-infrared ratio of both sources is consistent with that of a Type 1 AGN. The radio spectral index of source PKS 03120017 is very steep ( 1.7), at variance with the value expected for an active nucleus ( 0.8). However, the radio observations are not simultaneous and thus source variability may affect the slope estimated above.
The detection of PKS 03120017 in the radio band suggested (Brusa et al. 2003) that it could be an example of a high-energy-peaked BL Lac (the so called HBL). To shed light on the nature of the broad-band emission of this object, we report in Fig. 10 (right panel) the SED with the lowest radio luminosity belonging to the “blazar sequence” (Fossati et al. 1998), roughly matching the observed 5 GHz flux density of our source. The X-ray-to-radio luminosity ratio of PKS 03120017 is one order of magnitude lower than that expected for a HBL. The HBL SED does not adequately fit the nuclear data of PKS 03120017 suggesting that either the blazar sequence breaks down at low luminosities or, more likely, that PKS 03120017 is not a BL Lac object.
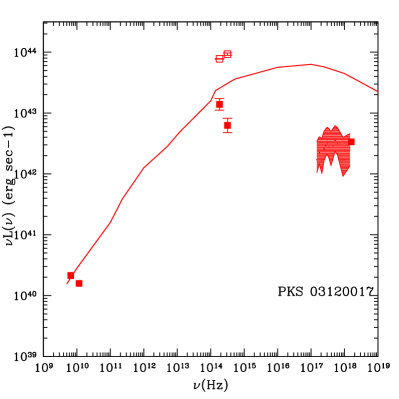
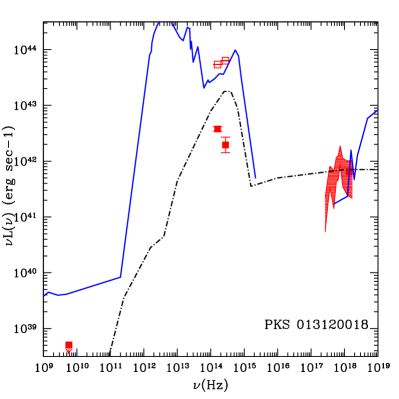
The presence of Compton-thick absorption for source PKS 03120018 was favoured by Comastri et al. (2002), on the basis of the comparison of the source SED (including the host galaxy) with that of NGC 6240, the prototype of this class of objects (see their Fig. 5). The near-infrared nuclear fluxes, obtained with the present analysis, along with a re-analysis of the X-ray spectrum, consistent with Compton-thin obscuration (NH5 cm-2), make the Compton-thick hypothesis no more tenable (Fig. 11, right panel).
A multiwavelength spectral fit to the total emission of source PKS 03120018 with a RIAF plus thin-disk model was presented by Yuan & Narayan (2004). Even if a detailed analysis of the RIAF model is beyond the scope of this paper, their model is also reported in Fig. 11 (right panel). We note that the solution proposed by Yuan & Narayan (2004) does not provide a good fit to the nuclear data; however, given the large number of free parameters in RIAF models, we cannot rule out that inefficient accretion may explain the PKS 03120018 SED.
To explain the properties of more than half of the XBONGs selected in the Chandra deep fields at high redshift, Rigby et al. (2006) proposed the presence of extranuclear dust and gas distributed on large scales (i.e., kpc dust lanes). Dust lanes have been observed in HST images of nearby galaxies hosting a Seyfert 2 nucleus (Malkan et al. 1998) and seem also to be ubiquitous in nearby early-type active galaxies, selected from the Ho et al. (1995) sample and analyzed by Lopes et al. (2007). X-ray observations of galaxies belonging to the Malkan et al. sample suggest a strong correlation between the presence of dust lanes and X-ray absorption (Guainazzi et al. 2001, 2005). Moreover, the presence of extranuclear dust lanes in both samples is always associated with optical emission lines, at variance with the XBONG definition. If extranuclear dust were responsible of the XBONG classification, as proposed by Rigby et al. (2006), it should be visible in our sources in the optical band, since our XBONGs are much brighter and at lower redshift. We have retrieved from the HST archive two ACS/HRC images of source PKS 03120018 taken in the F475W and F625W filters. The optical images along with near-infrared images do not show any obvious large-scale dust structure.
If heavy nuclear absorption or absorption related to the presence of dust lanes are not responsible for the lack of optical emission lines in PKS 03120017 and PKS 03120018, our results require an alternative explanation. One speculative possibility is that the ionizing flux does not reach the narrow line regions because absorbed by intervening dust and gas, with and N1021cm-2, covering 4 at the central engine.
Having estimated the host galaxy magnitude, it is possible to compute the black hole mass adopting the Marconi & Hunt (2003) relation, safely assuming that it holds at the redshift of our sources. The rest frame Ks-band luminosity has been computed using an evolving elliptical galaxy template 999The galaxy template includes an exponential star formation with a time-scale =0.3 and formation redshift 6. (Bruzual & Charlot 2003) to properly account for the K-correction. The black hole masses obtained are and for PKS 03120017 and PKS 03120018, respectively. Assuming a range of the bolometric correction value (15–30) which, following Marconi et al. (2004; see also Elvis et al. 1994), is appropriate for the X-ray luminosity of the XBONG nuclei ( erg sec-1 and erg sec-1 for PKS 03120017 and PKS 03120018, respectively), it is possible to derive the bolometric luminosity and, therefore, to estimate the Eddington ratio () of the two sources. The resulting Eddington ratio is close to for both sources. Should the bolometric correction be significantly lower (as it seems to be the case among low luminosity AGN e.g. Ho 1999) then the estimated Eddington ratio would correspondingly decreases. At such low values of the Eddington rate, the accretion is expected to be radiatively inefficient and described by a RIAF solution. However, it has also been suggested that the thin disk solution is stable down to Eddington ratios as low as (Park & Ostriker 2001). Therefore, the lack of optical emission lines may be explained by a either a RIAF model or by standard accretion disk which, at low values of the Eddington ratio, does not produce enough UV photons able to ionize the narrow line regions.

In Fig. 12 the black hole masses of the two XBONGs as a function of the X-ray luminosity (filled squares) are reported along with the low-luminosity AGN (LLAGN) from Panessa et al. (2006). Keeping into account the uncertainties on our estimates, the black holes that reside in our objects are more massive than those of the LLAGN of Panessa et al. (2006) and, for the same X–ray luminosity, are characterized by a lower Eddington ratio.
7 Conclusions
We have presented a multiwavelength analysis of four XBONGs selected from the HELLAS2XMM survey. For these sources, deep near-infrared images taken with ISAAC at VLT, good-quality optical spectra and XMM-Newton data are available. Applying the morphological decomposition technique, we were able to detect the presence of a nuclear component in two out of the four sources (PKS 03120017 and PKS 03120018). There is no evidence of nuclear emission in the near-infrared in Abell 2690013; moreover, the X-ray appearance is consistent with an extended source. For source Abell 1835140, the near-infrared images reveal a complex morphology, where two sources are embedded in a common envelope. The main issue about the XBONG nature is whether they represent a truly distinct class or, rather, they are a mixed source population. Our results point towards the latter hypothesis.
The results regarding the nature of the XBONGs with nuclear component and the lack of optical emission lines can be summarized as follows.
-
•
Source PKS 03120017 and PKS 03120018 are well described by a mildly obscured () optically weak nucleus, responsible for the X-ray emission, hosted by a bright galaxy (mag–mag ).
-
•
The lack of optical emission lines cannot be attributed to observational limitations such as a inadequate observational setup or low signal-to-noise-ratio, at least for the objects in the present sample for which high-quality spectroscopic and photometric observations are available.
-
•
We can safely discard for the two objects both a Compton-thick scenario (as found by Caccianiga et al. 2007 for a sample of elusive AGN in the XBSS) and an important blazar contribution. A RIAF solution seems to be supported by the estimated values of the Eddington ratios in the two objects and is not ruled out by the broad-band SED fitting, also because of the large number of free parameters in the RIAF model that can be tuned in order to reproduce the observed SEDs. A weak nuclear source, described by a standard accretion disk solution, but not powerful enough in the production of UV photons, would also provide an acceptable description of the observations.
-
•
The presence of a thin nuclear gas and dust structure (as argued by Cocchia et al. 2007) covering 4 at the nuclear source, combined with the low level of activity of the BH, could prevent the ionization of the narrow-line regions and produce also the extinction we measured.
The analysis of already obtained VLT/VIMOS-IFU (Integral Field Unit) observations could help in the detection of the typical AGN emission lines down to a very faint flux limit and in the study of the gas kinematics.
Acknowledgements.
We acknowledge financial contribution from contract ASI-INAF I/023/05/0 and PRIN–MIUR grant 2006–02–5203. The authors thank G. Zamorani, G.C. Perola and P. Ciliegi for useful discussions.References
- Adelman-McCarthy & for the SDSS Collaboration (2007) Adelman-McCarthy, J. K., & for the SDSS Collaboration 2007, ArXiv e-prints, 707, arXiv:0707.3413
- Alexander et al. (2003) Alexander, D. M., et al. 2003, AJ, 126, 539
- Andredakis et al. (1995) Andredakis, Y. C., Peletier, R. F., & Balcells, M. 1995, MNRAS, 275, 874
- Arnaud (1996) Arnaud, K. A. 1996, ASP Conf. Ser. 101: Astronomical Data Analysis Software and Systems V, 101, 17
- Baldi et al. (2002) Baldi, A., Molendi, S., Comastri, A., Fiore, F., Matt, G., & Vignali, C. 2002, ApJ, 564, 190
- Barkhouse & Hall (2001) Barkhouse, W. A., & Hall, P. B. 2001, AJ, 122, 496
- Bohlin et al. (1978) Bohlin, R. C., Savage, B. D., & Drake, J. F. 1978, ApJ, 224, 132
- Brotherton et al. (2001) Brotherton, M. S., Tran, H. D., Becker, R. H., Gregg, M. D., Laurent-Muehleisen, S. A., & White, R. L. 2001, ApJ, 546, 775
- Brusa et al. (2003) Brusa, M., et al. 2003, A&A, 409, 65
- Bruzual & Charlot (2003) Bruzual, G., & Charlot, S. 2003, MNRAS, 344, 1000
- Caccianiga et al. (2007) Caccianiga, A., Severgnini, P., Della Ceca, R., Maccacaro, T., Carrera, F. J., & Page, M. J. 2007, A&A, 470, 557
- Cassata et al. (2005) Cassata, P., et al. 2005, MNRAS, 357, 903
- Cash (1979) Cash, W. 1979, ApJ, 228, 939
- Civano et al. (2005) Civano, F., Comastri, A., & Brusa, M. 2005, MNRAS, 358, 693
- Cocchia et al. (2006) Cocchia, F., et al. 2007, A&A,466, 31
- Comastri et al. (2002) Comastri, A., et al. 2002a, ApJ, 571, 771
- Comastri et al. (2002) Comastri, A., Vignali, C., Brusa, M., The Hellas, & Hellas2XMM Consortia 2002b, ASP Conf. Ser. 284: IAU Colloq. 184: AGN Surveys, 284, 235
- Cutri et al. (2000) Cutri, R. M., Nelson, B. O., Huchra, J. P., & Smith, P. S. 2000, Bulletin of the American Astronomical Society, 32, 1520
- de Vaucouleurs (1948) de Vaucouleurs, G. 1948, Annales d’Astrophysique, 11, 247
- Elvis et al. (1981) Elvis, M., Schreier, E. J., Tonry, J., Davis, M., & Huchra, J. P. 1981, ApJ, 246, 20
- Elvis et al. (1994) Elvis, M., et al. 1994, ApJS, 95, 1
- Fiore et al. (2003) Fiore, F., et al. 2003, A&A, 409, 79
- Fossati et al. (1998) Fossati, G., Maraschi, L., Celotti, A., Comastri, A., & Ghisellini, G. 1998, MNRAS, 299, 433
- Francis et al. (1991) Francis, P. J., Hewett, P. C., Foltz, C. B., Chaffee, F. H., Weymann, R. J., & Morris, S. L. 1991, ApJ, 373, 465
- Georgantopoulos & Georgakakis (2005) Georgantopoulos, I., & Georgakakis, A. 2005, MNRAS, 358, 131
- Gezari et al. (2006) Gezari, S., et al. 2006, ApJ, 653, L25
- Guainazzi et al. (2001) Guainazzi, M., Fiore, F., Matt, G., & Perola, G. C. 2001, MNRAS, 327, 323
- Guainazzi et al. (2005) Guainazzi, M., Matt, G., & Perola, G. C. 2005, A&A, 444, 119
- Ho et al. (1995) Ho, L. C., Filippenko, A. V., & Sargent, W. L. 1995, ApJS, 98, 477
- Ho (1999) Ho, L. C. 1999, ApJ, 516, 672
- Hutchings et al. (2003) Hutchings, J. B., Maddox, N., Cutri, R. M., & Nelson, B. O. 2003, AJ, 126, 63
- Kim et al. (2006) Kim, D.-W., et al. 2006, ApJ, 644, 829
- Komossa et al. (2004) Komossa, S., Halpern, J., Schartel, N., Hasinger, G., Santos-Lleo, M., & Predehl, P. 2004, ApJ, 603, L17
- Kochanek et al. (2001) Kochanek, C. S., et al. 2001, ApJ, 560, 566
- Simões Lopes et al. (2007) Simões Lopes, R. D., Storchi-Bergmann, T., de Fátima Saraiva, M., & Martini, P. 2007, ApJ, 655, 718
- Malkan et al. (1998) Malkan, M. A., Gorjian, V., & Tam, R. 1998, ApJS, 117, 25
- Mannucci et al. (2001) Mannucci, F., Basile, F., Poggianti, B. M., Cimatti, A., Daddi, E., Pozzetti, L., & Vanzi, L. 2001, MNRAS, 326, 745
- Marconi & Hunt (2003) Marconi, A., & Hunt, L.K. 2003, ApJ, 589, L21
- Marconi et al. (2004) Marconi, A., Risaliti, G., Gilli, R., Hunt, L. K., Maiolino, R., & Salvati, M. 2004, MNRAS, 351, 169
- Mignoli et al. (2005) Mignoli, M., et al. 2005, A&A, 437, 883
- Moran et al. (2002) Moran, E. C., Filippenko, A. V., & Chornock, R. 2002, ApJ, 579, L71
- Netzer et al. (2006) Netzer, H., Mainieri, V., Rosati, P., & Trakhtenbrot, B. 2006, A&A, 453, 525
- Pahre (1999) Pahre, M. A. 1999, ApJS, 124, 127
- Park (2001) Park, M. G. and Ostriker, J. P. 2001, ApJ, 549,100
- Panessa et al. (2006) Panessa, F., Bassani, L., Cappi, M., Dadina, M., Barcons, X., Carrera, F. J., Ho, L. C., & Iwasawa, K. 2006, A&A, 455, 173
- Pei (1992) Pei, Y. C. 1992, ApJ, 395, 130
- Peng et al. (2002) Peng, C. Y., Ho, L. C., Impey, C. D., & Rix, H.-W. 2002, AJ, 124, 266
- Peng et al. (2006) Peng, Z., Gu, Q., Melnick, J., & Zhao, Y. 2006, A&A, 453, 863
- Perola et al. (2004) Perola, G. C., et al. 2004, A&A, 421, 491
- Pierre et al. (2001) Pierre, M., et al. 2001, A&A, 372, L45
- Rigby et al. (2006) Rigby, J. R., Rieke, G. H., Donley, J. L., Alonso-Herrero, A., & Pérez-González, P. G. 2006, ApJ, 645, 115
- Sánchez et al. (2004) Sánchez, S. F., et al. 2004, ApJ, 614, 586
- Sérsic (1968) Sersic, J. L. 1968, Cordoba, Argentina: Observatorio Astronomico, 1968
- Severgnini et al. (2003) Severgnini, P., et al. 2003, A&A, 406, 483
- Vanden Berk et al. (2001) Vanden Berk, D. E., et al. 2001, AJ, 122, 549
- Worsley et al. (2004) Worsley, M. A., Fabian, A. C., Barcons, X., Mateos, S., Hasinger, G., & Brunner, H. 2004, MNRAS, 352, L28
- Worsley et al. (2005) Worsley, M. A., et al. 2005, MNRAS, 357, 1281
- Yuan & Narayan (2004) Yuan, F., & Narayan, R. 2004, ApJ, 612, 724