The UV Spectrum of the Galactic Bulge
Abstract
The UV excess shown by elliptical galaxies in their spectra is believed to be caused by evolved low-mass stars, in particular sdB stars. The stellar system most similar to the ellipticals for age and metallicity, in which it is possible to resolve these stars, is the bulge of our Galaxy. sdB star candidates were observed in the color magnitude diagram of a bulge region by Zoccali et al. (2003). The follow-up spectroscopic analysis of these stars confirmed that most of these stars are bulge sdBs, while some candidates turned out to be disk sdBs or cool stars. Both spectroscopic and photometric data and a spectral library are used to construct the integrated spectrum of the observed bulge region from the UV to the optical: the stars in the color magnitude diagram are associated to the library spectra, on the basis of their evolutionary status and temperature. The total integrated spectrum is obtained as the sum of the spectra associated to the color magnitude diagram. The comparison of the obtained integrated spectrum with old single stellar population synthetic spectra calculated by Bruzual & Charlot (2003) agrees with age and metallicity of the bulge found by previous work. The bulge integrated spectrum shows only a very weak UV excess, but a too strict selection of the sample of the sdB star candidates in the color magnitude diagram and the exclusion of post-Asymptotic Giant Branch stars could have influenced the result.
To be published in the Proceedings of the Third Meeting on Hot Subdwarfs and Related Objects, Bamberg 2007
INAF-Osservatorio di Teramo, Via M. Maggini s.n.c., 64100 Teramo, Italy
European Southern Observatory, Karl-Schwarzschild-Strasse 2, 85748 Garching bei München, Germany
1. Introduction
The UV excess that elliptical galaxies and bulge of spiral galaxies show in their spectra at shorter than 2300 Å was one of the most puzzling discoveries in the last 30 years, since these stellar systems are believed to be old and metal rich, without young and massive stars emitting most of their flux at short wavelength. It is now widely accepted that this UV emission is caused by evolved low mass stars, in particular Extreme Horizontal Branch stars (EHB), called also sdB stars from their spectral classification. These stars are faint in the optical wavelength range and with the current instrumentation it is impossible to resolve them in the nearest galaxies. The stellar system most similar to the ellipticals for age and metallicity in which it is possible to resolve sdB stars is the bulge of our Galaxy. A sample of sdBs star candidates was observed in the Galactic bulge by Zoccali et al. (2003), by means of and photometry of the region MW05 from the ESO Imaging Survey (EIS111http://www.eso.org/science/eis/, the observations were taken with the Wide Field Imager, WFI@2.2m). These stars could be either highly reddened sdBs or cooler stars affected by lower reddening. A follow-up spectroscopic analysis of these stars has been necessary and observations at the Very Large Telescope (VLT) telescope were obtained. The data reduction and the comparison of the obtained spectra with models of hot evolved stars confirmed indeed that most of these stars are bulge sdBs, while some candidates turned out to be disk sdBs or cool stars (for more details, see Busso et al. 2005). To be sure that the observed bulge region was not peculiar, other bulge fields were searched for sdB candidates: EIS photometric data of the bulge fields MW07 and MW08 were reduced and analyzed, finding that sdB star candidates are present also in these fields.
This work presents the procedure adopted (following the recipe as in Santos et al. 1995) to construct the integrated spectrum of the bulge region MW05.
2. Correction for Reddening and for other Contaminating Stellar Populations
In order to construct the integrated spectrum of the bulge, it is necessary to correct for the extinction caused by the interstellar medium and to take in account that along the line of sight we are observing not only the bulge but also the Galactic disk. Moreover also a globular cluster (NGC 6558) is present in the observed field.
To correct for reddening the Schlegel et al. (1998) dust maps were used. Their resolution is roughly 5 arcmin, that is about half the size of a WFI chip: the reddening was calculated then for the 16 regions resulting by splitting each of the 8 WFI chips in half, correcting in this way also for differential reddening.
If two stellar populations have different kinematics, the more precise method to distinguish them is to compare proper motions of the stars, which can be measured only by comparing the positions of the same stars at two different epochs. In this case though, the observations were taken in one epoch only. To subtract the contaminating stars of the globular cluster NGC 6558 in the MW05 bulge field, a region centered on the center of the globular cluster, with a radius equal to the tidal radius of the cluster, was considered. To validate this approach, also radial star counts on the image were taken in account: in the external regions, roughly beyond 2000 pixels (8 arcmin) from the center, the star counts start to flatten, indicating that there is no significant contribution from the globular cluster beyond that range. Only stars in this external region were then taken into account.
To decontaminate the bulge color magnitude diagram (CMD) from the foreground disk population, a statistical approach was adopted, using synthetic CMDs of the disk in the direction of the observed bulge field. The disk simulations (one for each WFI chip) were provided by S. Ragaini (priv. comm., PhD Thesis at the University of Padua, for a detailed description of the simulations, see Vallenari et al. 2000, 2006).
For each disk star in the disk CMD (Fig. 1, top right panel) the closest star in the bulge CMD was picked up and subtracted. The “photometric” distance between two stars in the CMD was defined as:
and the bulge star with the smallest distance from the disk star was subtracted. The resulting, cleaned CMD of the bulge is shown in the left bottom panel of Fig. 1, while the CMD of the stars statistically removed from the bulge CMD is shown in the right bottom panel.
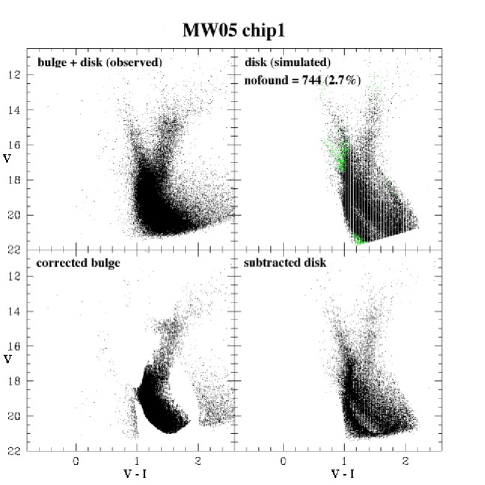
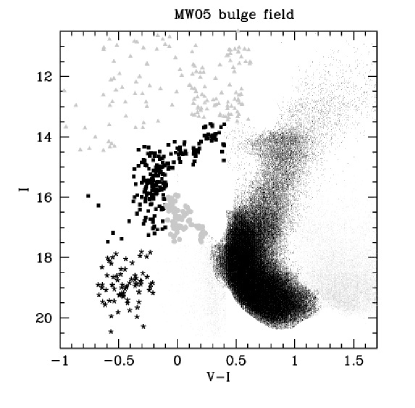
The remaining bulge stars were combined to obtain the final CMD for the bulge field MW05 shown in Fig. 2. In this figure the typical bulge sequences, as the Main Sequence (MS), the red giant branch (RGB), the red horizontal branch (HB) clump (at 0.6 and 14) are evident. The grey dots are stars that remain after the disk subtraction, because the simulations do not manage to reproduce well the photometric errors. The filled grey circles could be Blue Stragglers but previous studies as Kuijken & Rich 2001 ruled out their presence in the bulge, therefore they are assumed to be caused by a not precise subtraction. The stars marked as filled squares seem to form an extended HB sequence. Blue HB stars have been previously observed in the bulge by Peterson et al. (2001) and moreover an extended HB is not typical for the disk population. The black triangles are probably a combination of real post-HB stars and remaining disk blue MS stars. Since there is no way to disentangle the two populations in this case and since post-HB stars should play only a marginal role in the UV excess (Brown et al. 1997), they were left out from the construction of the integrated spectrum. The stars marked with asterisks represent the sdB star candidates and they are a mixture of real sdB stars and cooler stars with lower reddening. For the construction of the integrated spectrum therefore only the black (MS, RGB, Red HB, Blue HB and Extended HB) stars were considered.
3. The Bulge integrated spectrum
To finally construct the integrated spectrum of the Galactic bulge from the UV to the optical the method of Santos et al. (1995) was adopted, using both spectroscopic and photometric data and spectral libraries (Pickles 1998, Lejeune et al. 1997) and the Bamberg archive of optical and UV-spectra of hot subdwarfs (Heber, priv.comm.) to extend the sdB spectra to the UV.
To construct the sdB spectrum, first of all it was necessary to decide which of the sdB star candidates in the CMD to take into account. Only stars with a good photometry were selected (error in the color magnitude diagram smaller than 0.1), obtaining 112 sdB star candidates. The disk simulation, while taking into account the presence of Horizontal Branch stars, does not include sdB stars which therefore remain in the corrected disk CMD. However the analysis of the spectra (see Sec. 1.) showed that only 80% of the candidates are really sdB stars and not all these stars have turned out to belong to the Galactic bulge. The percentages found from the spectroscopic analysis were applied to the total number of sdB stars candidates, since there is no reason to assume that peculiar stars were picked up during the selection of the spectroscopic targets: of 116 candidates therefore, only 55 % have been considered to be true sdB stars of the bulge (Busso et al. 2005), the remaining ones being cool stars or hot stars belonging to the disk or unclear membership, thus narrowing the sdBs sample to 62 candidates.
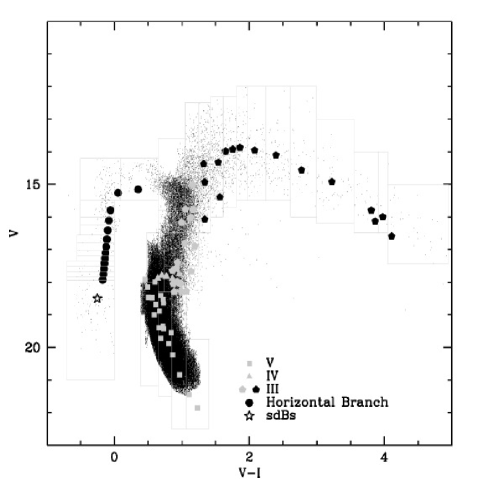
In order to associate the appropriate spectrum to the other CMD stars, the Pickles (1998) spectral library was plotted on the cleaned and reddening corrected CMD of the bulge region, as shown in Fig. 3. In this figure, the library points are marked with different symbols, depending on the luminosity of class (filled squares: dwarfs (V); filled triangles: subgiant (IV)); filled pentagons: giants (III)) while HB stars are marked with filled circles and sdB stars with an empty star. Each different point corresponds to a library spectrum with a different temperature. The boxes on the CMD were chosen so that every box contains at least one library point. For each box the following parameters were calculated: the mean absolute magnitude 222assuming an average distance of 8.15 Kpc, calculated as the most probable distance. of the stars in the -th box; the corresponding library spectrum “magnitude” obtained from the convolution with the filter; the weighting factor of the stars inside a certain box contributing to the total spectrum ( is the number of stars inside the box):
Finally, the total integrated spectrum of this bulge region was calculated as sum of all spectra () associated to the CMD boxes, taking in account their weights :
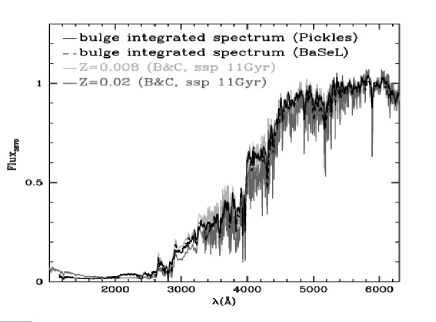
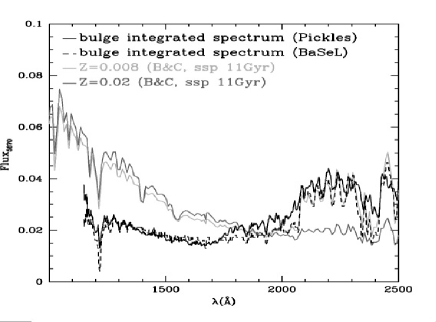
The same procedure was applied also using the BaSeL (Lejeune et al. 1997) syntethic spectral library, where the spectra at solar metallicity, with temperature and luminosity class corresponding to those of the Pickles (1998) stars were selected. The result is shown in Fig. 4, where also the comparison with the integrated spectra (from Bruzual & Charlot 2003) of two simple stellar populations (SSPs) with an age of 11 Gyr and metallicity Z=0.008 and Z=0.02 is shown.
The two integrated spectra obtained using the Pickles and BaSeL library are very similar, both in the optical and UV range (see bottom panel). Neither the SSP at Z=0.008 ([Fe/H]0.5) nor the one at Z=0.02 ([Fe/H]0.09) agree perfectly with the integrated spectra, particularly in the region between 3300 and 4000 Å, where the two synthetic spectra bracket the integrated one. Probably a population with an intermediate metallicity would fit better. It is necessary to keep in mind though that the bulge is not a single stellar population with only one value for the metallicity, but it has a metallicity distribution from metal-poor (down to [Fe/H]2) to metal-rich (up to [Fe/H]0.5), with a peak at [Fe/H]0.2 (Zoccali et al. 2003, Rich & Origlia 2005), intermediate between the metallicity of the two single stellar populations adopted. The expected age for the bulge is 10-13 Gyr while the adopted single stellar populations are 11 Gyr old. We note in passing that the fact that the spectrum characteristic of a single stellar population, hence formed in an ”instantaneous” burst, is in agreement with the recent work of Zoccali et al. (2006), that, by means of -element analysis, found that probably the bulge formed very quickly.
Integrated and synthetic spectra do not match in the UV instead, with the synthetic spectra showing a larger UV flux. This could be explained with two reasons. Firstly, in their stellar population synthesis, Bruzual & Charlot (2003) take into account also post-HB and post-AGB, which have a strong flux in the UV range. These stars were not accounted for here since it was not possible to disentangle them from the disk population. Secondly, probably the selection of sdBs stars was too strict. On the base of the spectroscopic analysis, were selected, as bulge sdBs, on the color magnitude diagram only 55% of the candidates to construct the integrated spectrum. Taking into account also the stars with unknown membership the percentage would raise to 65%, increasing the UV flux by about 20%, which is insufficient to achieve agreement with the SSP predictions.
Thus the Galactic bulge probably shows only a very weak UV excess, in contrast to what is observed in the bulge of M31. This is consistent with UV observations of the closest extragalactic systems, which show that this UV excess can vary strongly from object to object (Rich et al. 2005). In addition, the same observations indicate also that the UV excess shows no correlation with physical parameters as metallicity or velocity dispersion. A correlation with age appears more probable but it would be visible only at high redshift (Brown et al. 2003).
To verify the procedure, we constructed the integrated spectrum also for the Galactic Globular Clusters NGC 6388 and NGC 6441, which show an unexpected population of sdB stars. The procedure was the same as for the bulge fields, with the same choice of not including the post-HB and post-AGB stars. The integrated spectra were compared with the observed integrated spectrum of the two clusters in the optical (Schiavon et al. 2005) and in the UV (Rich et al. 1993). Also in these cases, while in the optical the calculated and observed integrated spectra match, in the UV there seems to be no agreement. This could be a hint that sdB stars are not the dominant cause for the UV excess in these systems, while a more important role could be played by post-HB and post-AGB stars.
In conclusion, the bulge of our Galaxy probably shows only a weak UV excess. We note that this result is neither in contradiction with nearby observations, as in the case of M31, nor with observations of more distant galaxies. In fact the UV excess can vary considerably from object to object and shows no dependence on physical parameters like metallicity and velocity dispersion, as explained by Rich et al. (2005).
Acknowledgments.
We warmly thanks Manuela Zoccali for providing the photometric data, Uli Heber for the Bamberg spectroscopic archive of sdBs and Sukyoung Yi for the theoretical tracks. GB gratefully acknowledges support from the Deutsche Forschungsgemeinschaft through grant Mo 602/8.
References
- (1) Brown, T. M., Ferguson, H. C., Davidsen, A. F., & Dorman, B., 1997, ApJ, 482, 685
- (2) Brown, T. M., Ferguson, H. C., Smith, E., Bowers, C. W., Kimble, R. A., Renzini, A., & Rich, R. M., 2003, ApJ, 584, L69
- (3) Bruzual, G., & Charlot, S., 2003, MNRAS, 344, 1000
- Busso et al. (2005) Busso, G., Moehler, S., Zoccali, M., Heber, U., & Yi, S. K., 2005, ApJ, 633, L29
- (5) Kuijken, K., & Rich, R. M., 2001, AAS, 199, 9113
- (6) Lejeune, Th., Cuisinier, F., & Buser, R., 1997, A&AS, 125, 229
- (7) Peterson, R. C., Terndrup, D. M., Sadler, E. M., & Walker, A. R., 2001 ApJ, 547, 240
- (8) Pickles, A. J., 1998, PASP, 110, 863
- (9) Rich, R. M., Minniti, D., & Liebert, J. W, 1993, ASPC, 50, 231
- (10) Rich, R. M., Salim, S., Brinchmann, J., Charlot, S., and 24 coauthors, 2005, ApJ, 619, L107
- (11) Rich, R. M., & Origlia, L., 2005, ApJ, 634, 1293
- Santos et al. (1995) Santos, J. F. C. Jr., Bica, E., Dottori, H., Ortolani, S., & Barbuy, B., 1995, A&A, 303, 753
- (13) Schiavon, R. P., Rose, J. A., Courteau, S., & MacArthur, L. A., 2005, ApJS, 160, 163
- Schlegel et al. (1998) Schlegel, D. J., Finkbeiner, & D. P., Davis, M., 1998, ApJ, 500, 525
- Vallenari et al. (2000) Vallenari, A., Bertelli, G., & Schmidtobreick, L., 2000, A&A, 361, 73
- Vallenari et al. (2006) Vallenari, A., Pasetto, S., Bertelli, G., Chiosi, C., Spagna, A., & Lattanzi, M., 2006, A&A, 451, 125
- Zoccali et al. (2003) Zoccali, M., Renzini, A., Ortolani, S., Greggio, L., Saviane, I., Cassisi, S., Rejkuba, M., Barbuy, B., Rich, R. M., & Bica, E., 2003, A&A, 399, 931
- (18) Zoccali, M., Lecureur, A., Barbuy, B., Hill, V., Renzini, A., Minniti, D., Momany, Y., Gomez, A., & Ortolani, S., 2006, A&A, 457, L1