-Process Nucleosynthesis in Population III Core-Collapse Supernovae
Abstract
We investigate the effects of neutrino-nucleus interactions (the -process) on the production of iron-peak elements in Population III core-collapse supernovae. The -process and the following proton and neutron capture reactions produce odd- iron-peak elements in complete and incomplete Si burning region. This reaction sequence enhances the abundances of Sc, Mn, and Co in the supernova ejecta. The supernova explosion models of 15 and 25 stars with the -process well reproduce the averaged Mn/Fe ratio observed in extremely metal-poor halo stars. In order to reproduce the observed Mn/Fe ratio, the total neutrino energy in the supernovae should be ergs. Stronger neutrino irradiation and other production sites are necessary to reproduce the observed Sc/Fe and Co/Fe ratios, although these ratios increase by the -process.
Subject headings:
Galaxy: halo — neutrinos — nuclear reactions, nucleosynthesis, abundances — supernovae: general1. Introduction
The abundance-metallicity relation of low mass extremely metal-poor (EMP) stars (; where and are the abundances of elements X and Y, respectively) and very metal-poor (VMP) stars () has been clarified by observations of very high quality spectra (e.g., Norris et al., 2001; Cayrel et al., 2004). This relation is expected to provide the information of supernovae (SNe) of Population (Pop) III (the first generation) massive stars (e.g., Nomoto et al., 2006) and the first stage of Galactic chemical evolution (GCE) (e.g., Kobayashi et al., 2006). The EMP stars are considered to have suffered the injection of heavy elements from one or a few SNe (e.g., Shigeyama & Tsujimoto, 1998). A halo interstellar medium becomes gradually homogeneous with metallicity (Argast et al., 2004). Although recent studies of the star formation in the first stage of GCE have been in progress, the characteristics of first generation stars, such as initial mass function, have not been clarified. In order to clarify such characteristics, we should investigate nucleosynthesis in the candidates of the first generation stars as well as the observed variations of the abundance distributions of the EMP and VMP stars.
Recent observations have indicated that the abundance ratios [X/Fe] averaged in the metal-poor stars with are between and 0.5 for most of observed elements (Cayrel et al., 2004). Their scatter around the average values deduced from the new observation is much smaller than found in earlier studies. The elemental abundance distribution of the metal-poor stars is not so different from that of the solar-system composition. Therefore, the small scatter is considered to suggest primordial burst of high-mass stars or the very rapid mixing of matter from different bursts of early star formation.
From theoretical viewpoint, Tominaga et al. (2007b) compared the Pop III hypernova (HN) yields with the abundance pattern of EMP stars with the metallicity range in Cayrel et al. (2004). They adopted the mixing-fallback model for the HNe. The HN yields give good agreement with the observed abundances for C, Na, Mg, Al, Si, Ca, Ni, and Zn. They also compared the Pop III SN and HN yields integrated over the Salpeter initial mass function (IMF) with the abundances of VMP stars in the metallicity range in Cayrel et al. (2004). They reproduced the observed trends of abundance ratios for C, O, Na, Mg, Al, Si, Ca, Cr, Ni, and Zn. The SN and HN yields of N, K, Sc, Ti, Mn, and Co are short for explaining the observed yield ratios, although Sc and Ti may be improved in the high-entropy explosion models. The yields of Mn and Co may be reproduced by the modification of electron fraction , of which value is still uncertain in the innermost region of SNe and HNe. Additional nucleosynthesis processes also remain open for these elements.
During a SN explosion, the collapsed core becomes extremely high temperature and high density, and neutrinos are produced through pair creation. The neutrinos are almost thermalized by neutrino-nucleus scattering at the center. They pass away through the neutrino sphere with carrying the gravitational binding energy of the core. The neutrino irradiation lasts for about s. The total number of neutrinos emitted in a SN is very huge, i.e., about . The neutrinos interact with nuclei in the surrounding stellar material to produce new species of nuclei. This is called the -process.
The -process is expected to be an important production process for some elements in Pop III SN explosions. The -process is important for the synthesis of light elements, Li and B (Domogatsky et al., 1978; Woosley et al., 1990; Woosley & Weaver, 1995; Yoshida et al., 2004, 2005a, 2006a, 2006b), F (e.g., Woosley et al., 1990; Woosley & Weaver, 1995), and some heavy neutron-deficient nuclei such as 138La and 180Ta (Goriely et al., 2001; Heger et al., 2005). The -process products are synthesized through the spallations by neutrinos from abundant seed nuclei. It also produces protons and neutrons and their capture reactions also enhance the abundances of some elements. For Pop III SNe, the seed nuclei are -nuclei abundantly produced in complete and incomplete Si burning during the explosions. Thus, the -process in Pop III SNe will produce additional some odd- elements.
We note that most of the nucleosynthesis calculations including the -process have been carried out using spherical explosion models (Woosley & Weaver, 1995; Yoshida et al., 2005b). Although the total neutrino energy should be close to the gravitational binding energy released from the collapsing core, properties of the neutrinos are still uncertain. The properties strongly depend on explosion mechanism but details of the mechanism have not been clarified. On the other hand, aspherical explosions have been investigated recently (e.g. Kotake et al., 2004; Scheck et al., 2004). In such a case, aspherical structure of neutrino sphere can be formed and the properties of the neutrinos are also still uncertain. Therefore, the dependence of the abundances of Pop III SNe and HNe on neutrino properties should be investigated.
In this study, we focus on the effect of the -process on the production of odd- iron-peak elements, Sc, Mn, and Co, during Pop III SN and HN explosions. We calculate the SN nucleosynthesis including the -process. Then, we investigate the dependence of the abundances of Sc, Mn, and Co in the SN ejecta on the energy of neutrinos, the stellar mass, and the explosion energy. Sc, Mn, and Co are expected to be at least partly synthesized through the -process. We also indicate whether the abundance ratios of Sc, Mn, and Co to Fe reproduce those observed in the EMP stars when we take into account the -process.
In §2 we explain stellar evolution models and the explosion models of SNe and a HN. We also describe the nucleosynthesis models including the -process and the neutrino irradiation models. In §3 we show the abundance distributions of Sc, Mn, and Co in the ejecta of the SN and HN models. We explain additional production of these elements through the -process. In §4 we explain the effect of the -process on the abundance ratios of Sc, Mn, and Co to Fe and the dependence on the neutrino irradiation strength. We also compare our results with the abundance ratios observed in the EMP stars. In §5 we discuss other production processes of Sc, Mn, and Co proposed in recent studies and the effect of the -process. Finally, we summarize this study in §6.
2. SN Explosion Models for Population III Massive Stars
2.1. Stellar Evolution and SN Explosion Models
We calculate the evolution of Population III stars for initial masses of 15 and 25 from zero-age main-sequence to the onset of the core collapse. We use a Henyey-type stellar evolution code including a nuclear reaction network with about 300 isotopes to calculate detailed nucleosynthesis and energy generation. The input physics is the same as the models used in Umeda & Nomoto (2002). SN explosions are calculated using a hydrodynamical code of spherically symmetrical piecewise parabolic method (Colella & Woodward, 1984).
We set the explosion energy of the 15 and 25 SN models to be , where is the explosion energy in units of ergs. We also calculate the explosion of a HN for the 25 star model with .
The location of the mass cut of the SN explosions is determined as follows. For the 15 star model, we set the location of the mass cut at ( being the mass coordinate of a star) to obtain the ejected 56Ni mass of 0.07 . In the case of 25 SN, we set the mass cut location at , so that large (Co,Zn)/Fe ratios are obtained. This location corresponds to the bottom of the layer where electron fraction is close to 0.5 (Umeda & Nomoto, 2005; Tominaga et al., 2007b). A large amount of 56Ni is produced in the region of (see §3.2 for details). Since the location of the mass cut is deep, this model ejects the 56Ni mass of 0.36 . This model corresponds to a SN with the explosion energy of and yielding a large 56Ni amount ((56Ni)) such as SN 2005bf (Tominaga et al., 2005). Note that the mixing-fallback model is not applied to these cases.
In the case of the 25 HN model, we apply the mixing-fallback model (Umeda & Nomoto, 2005; Tominaga et al., 2007b). This model approximates aspherical effects of HN explosions (Tominaga et al., 2007a). During aspherical explosion, the central core of a star first collapses. Then, jet-like explosion ejects the surrounding stellar materials. Some of the materials in an inner region may fallback to the central core from off-axis direction of the jet. There are three parameters in the mixing-fallback model; the initial mass cut (ini), the outer boundary of the mixing region (out), and the ejection factor . The initial mass cut corresponds to the mass of the initially collapsing core. The outer boundary of the mixing region corresponds to the location where the surrounding materials infall to the core during the explosion. The ejection fraction is the ejected material fraction in the mixing region. Details of the mixing-fallback model have been described in Tominaga et al. (2007b).
The values of the mixing-fallback parameters should be related to the explosion features such as asphericity and energy deposition rate (Tominaga et al., 2007a). However, the explosion mechanism has not been clarified. Therefore, we determine these parameter values similar to case A in Tominaga et al. (2007b). The location of the initial mass cut is set as , which is the bottom of the layer. This condition deduces large Zn/Fe ratio (Umeda & Nomoto, 2002, 2005). The outer boundary of the mixing region is determined as where the mass fraction of 56Ni decreases to . The ejection factor is determined as in order to yield [O/Fe] = 0.5. The electron fraction in complete and incomplete Si burning regions is not modified in this study. The 56Ni mass of each explosion model is listed in Table 1.
2.2. SN Neutrinos and Nucleosynthesis Models
A huge amount of neutrinos are emitted during SN explosions. For spherically symmetrical SN explosions, neutrinos are emitted isotropically from the neutrino sphere and carry the majority of gravitational energy of a proto-neutron star. On the other hand, aspherical SNe and jet-like explosion would emit neutrinos anisotropically. In this case neutrino irradiation may be very strong in a specific direction. Since we assume spherically symmetrical SN explosions, we assume isotropic neutrino emission.
The strength of the neutrino flux is determined by the total neutrino energy. The adopted values of the total neutrino energy are ergs, ergs, and ergs. The first value corresponds to normal neutrino irradiation and is almost equal to the gravitational binding energy of a 1.4 neutron star (Lattimer & Prakash, 2001). We assume that the neutrino luminosity decrease exponentially with time. The decay time of the neutrino luminosity is set to be 3.0 s.
The spectra of the SN neutrinos are assumed to obey Fermi distribution with zero chemical potentials. The temperatures of , and , are set to be MeV/ and 4 MeV/, respectively. This set of the neutrino temperatures is the same as in Rauscher et al. (2002) and Yoshida et al. (2005b). We note that Woosley & Weaver (1995) provided the SN yields adopting the and temperature of MeV and ergs. Therefore, we briefly mention the yields obtained using this parameter set. Detailed nucleosynthesis during the SN explosions is calculated by postprocessing using a code of Hix & Thielemann (1996) to which the -process reactions in Yoshida et al. (2005b) were added.
We should note that the evolution of neutrino luminosity and energy spectra of HNe may be different from that of SNe. The neutrino emission from rapidly accreting disks surrounding black holes during gamma ray bursts and HNe has been investigated (e.g., McLaughlin & Surman, 2007). They showed that and smaller amount of are mainly emitted from the accretion disks with slightly hard energy spectra compared with those from proto-neutron stars. However, the evolution of neutrino emission during HN explosions is still largely uncertain. On the other hand, the main contribution of the -process is neutral-current interactions, which do not depend on neutrino flavors (Woosley & Weaver, 1995; Yoshida et al., 2004). Furthermore, the yields of the -process products depend on both neutrino energy spectra and the total neutrino energy. Roughly speaking, a larger total neutrino energy corresponds to harder neutrino energy spectra (Yoshida et al., 2005a). Therefore, we set the total neutrino energy as a parameter.
The value of total neutrino energy ergs may be too large even in the HN model. If an element is not produced abundantly through the -process with ergs, the -process contribution should be very small for the production of the element.

| (56Ni) | [Sc/Fe] | [Mn/Fe] | [Co/Fe] | |
|---|---|---|---|---|
| (ergs) | () | |||
| 15 SN | ||||
| No neutrinos | ||||
| (=8 MeV) | ||||
| 25 SN | ||||
| No neutrinos | ||||
| (=8 MeV) | ||||
| 25 HN | ||||
| No neutrinos | ||||
| (=8 MeV) | ||||
3. Abundance Distributions of Sc, Mn, and Co
3.1. 15 Supernova
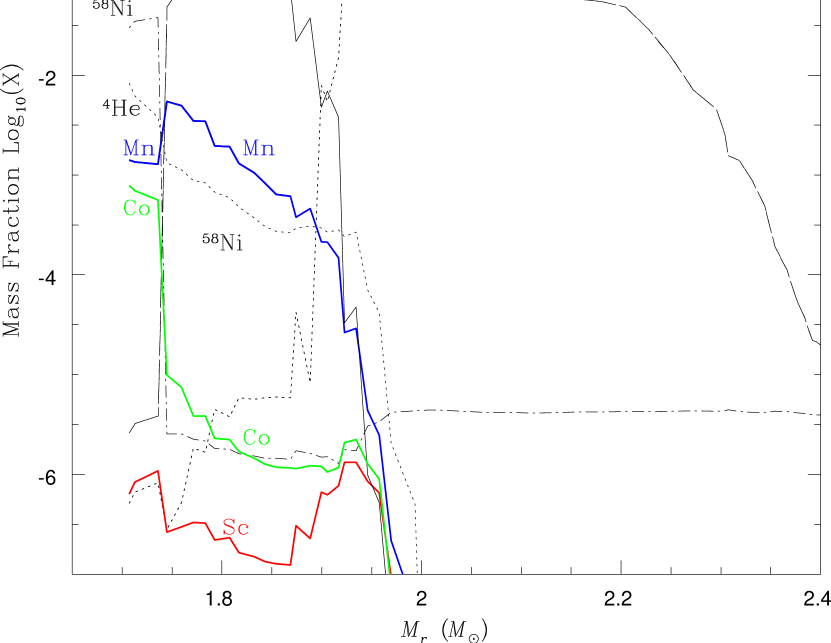
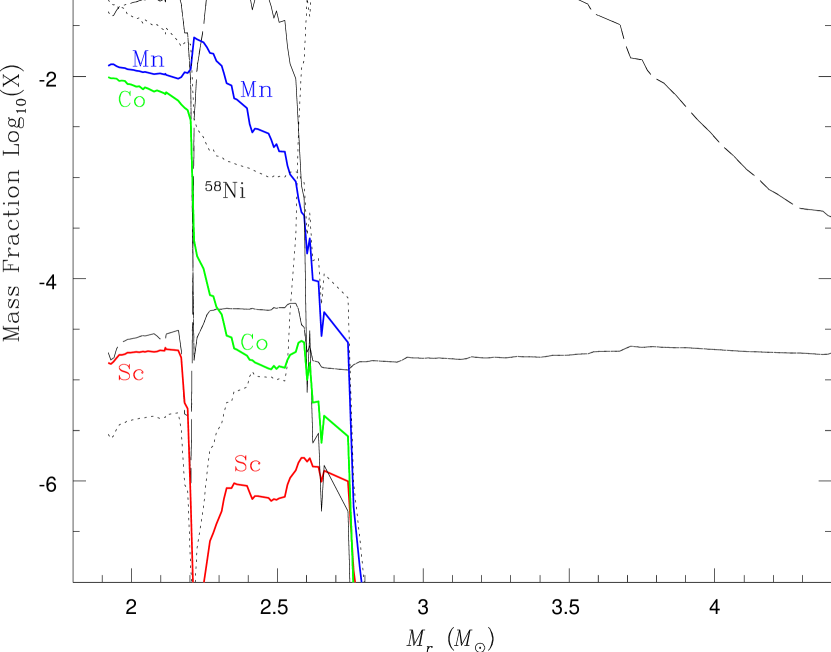
We explain the mass fractions of Sc, Mn, and Co as well as the contribution of the -process for their production. Figure 1 shows the distributions of the mass fractions of Sc, Mn, and Co in the 15 SN model without taking into account the -process. In this figure, the main product in the range of is 56Ni. In this region a large amount of iron-peak elements are produced through complete Si burning. We call this region the Ni layer. In the region outside the Ni layer, incomplete Si burning occurs during the explosion and a large amount of Si as well as a smaller amount of iron-peak elements are produced. We call this region () the Si/S layer.
The characteristics of the mass fractions and main production sites of Sc, Mn, and Co without the -process are explained as follows.
-
1.
Small mass fraction of Sc is produced at . The mass fraction is about at the maximum. Most of Sc is produced through incomplete Si burning.
-
2.
Most of Mn is produced in the Si/S layer through incomplete Si burning. The mass fraction at the maximum is about , which is much larger than that of Sc. A part of Mn is also produced in the Ni layer but the mass fraction is much smaller.
-
3.
Co is also produced in the Ni layer. The mass fraction of Co is about throughout this layer.
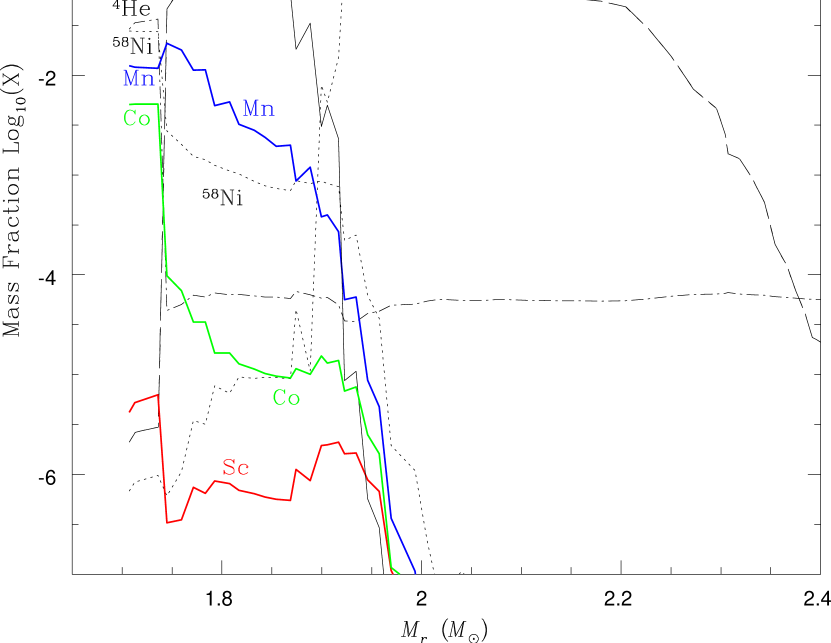
Hereafter we consider the effect of the -process on the production of Sc, Mn, and Co. Figures 1 and 1 show the distributions of the mass fractions taking into account the -process with ergs and ergs, respectively.
3.1.1 Sc
We see that additional Sc is produced in the Si/S layer () and in the Ni layer. The mass fraction of Sc is less than . Most of the Sc is first produced as 45Ti and 45V. In the Ni layer, a large amount of 44Ti is produced through complete Si burning. At the same time, 45Ti and 45V are partly produced through neutron- and proton-captures of 44Ti. Without the -process, however, the produced 45Ti and 45V are smoothly captured or decomposed again during the explosion. With the -process, additional protons are produced through the -process, so that some 45V is produced again by the proton capture.
3.1.2 Mn
We see the increase in the mass fraction of Mn in the Ni layer by about three orders of magnitude compared with the case without the -process. The mass fraction in the Si/S layer also increases by about a factor of 1.4. During the SN explosion, Mn is produced as 55Co. The amount of 55Mn originally produced in the SN is much smaller. In the Si/S layer, 55Co is produced by 54Fe(Co or photodisintegration from 56Ni. When the -process is considered, 55Co is also produced through 56Ni(Co after the production of 56Ni through complete and incomplete Si burning. Since the decay time of the neutrino luminosity is longer than the time scale of Si burning, the neutrino irradiation proceeds after ceasing Si burning.
3.1.3 Co
When we consider the -process, the mass fraction of Co increases by about a factor of three throughout the Ni layer. The main production region of Co is not changed when we consider the -process. Most of Co is produced as 59Cu and about of 59Co is produced as 59Ni. We see increase in the mass fractions of 59Cu and 59Ni similarly in the Ni layer. Most of 59Cu and 59Ni are produced through the captures of protons and neutrons by 58Ni. The protons and neutrons are produced through the -process even after the cease of complete Si burning. Therefore, the additional production raises the mass fraction of Co.
3.1.4 Larger Neutrino Irradiation
We also consider the case of larger neutrino irradiation with ergs. The distributions of the mass fractions are shown in Fig. 1. We see that the mass fractions of Sc, Mn, and Co in the Ni layer are larger by a factor of than those in the case of ergs. The dependence of the obtained mass fractions on the total neutrino energy is slightly smaller than the linear one. In this case all three elements are mainly produced in the Ni layer although Mn is mainly produced in the Si/S layer in the case of the former cases.
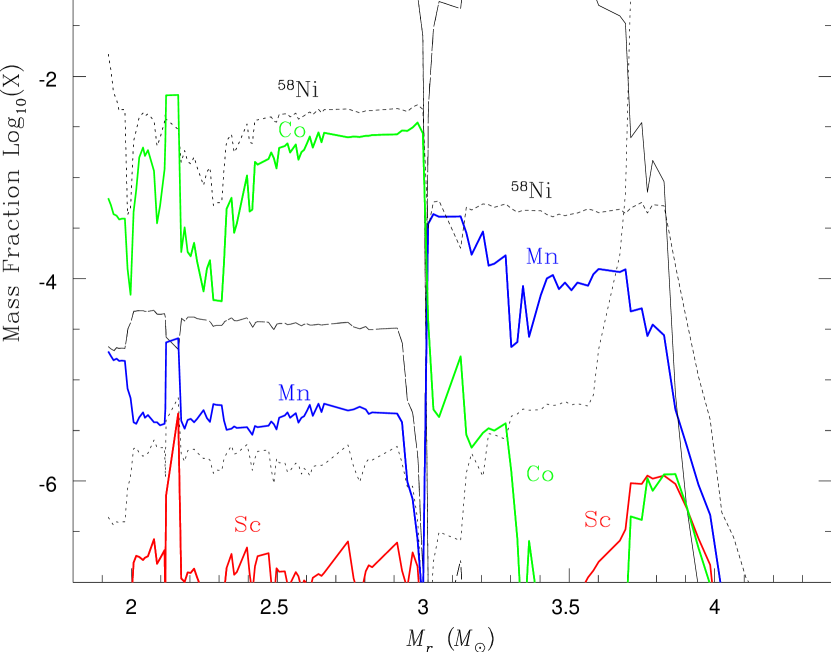
3.2. 25 Supernova
The mass fractions of the 25 SN model without the -process is shown in Fig. 2. In this figure, the Ni layer where complete Si burning occurs is in the range between and in the mass coordinate. The Si/S layer which suffered incomplete Si burning is between and . The ejected masses of these layers are larger than the corresponding layers in the 15 SN model. The distributions of the mass fractions of Sc, Mn, and Co in the 25 SN model are roughly similar to those of the 15 SN model. Most of Sc is produced in outer part of the Si/S layer (). Mn is mainly produced in the Si/S layer, too. Most of Co is produced in the Ni layer.
The mass fractions of Sc, Mn, and Co with the -process of ergs are shown in Fig. 2. When we consider the -process, their increase is seen in the Ni layer. For Sc, the mass fraction reaches about . It is about for Mn but the main Mn production is still in the Si/S layer. Increase in the abundance by the -process is seen in the Si/S layer. For Co, the abundance increases by about a factor of two.
The mass fractions of Sc, Mn, and Co in the case of a larger neutrino irradiation ( ergs) are shown in Fig. 2. We obtain larger ones for Sc, Mn, and Co. The mass fraction of Sc in the Ni layer is about , which is larger than that of the 15 SN. For Mn and Co, the abundances in the Ni layer are close to those of the 15 SN. The increase in the Mn abundance in the Si/S layer is also seen.
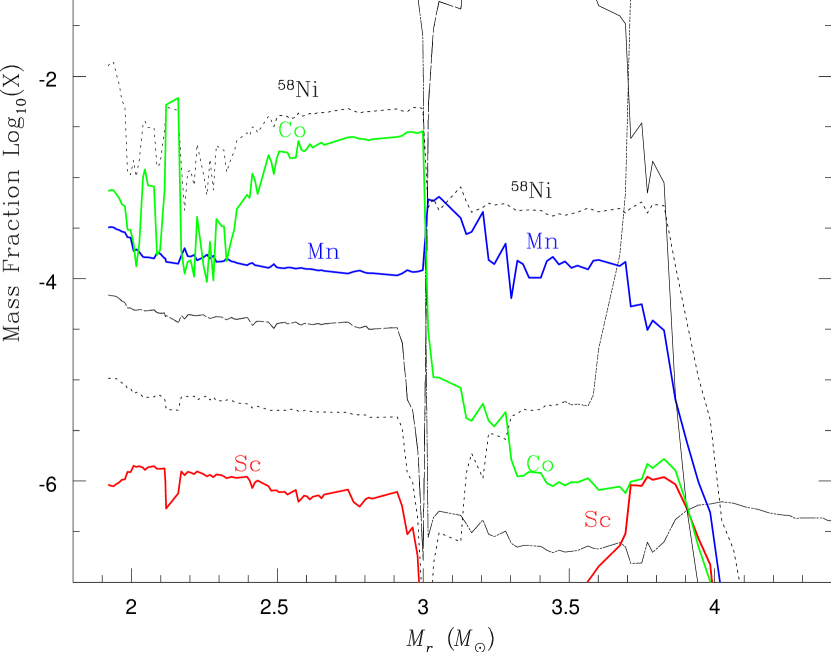
3.3. 25 Hypernova
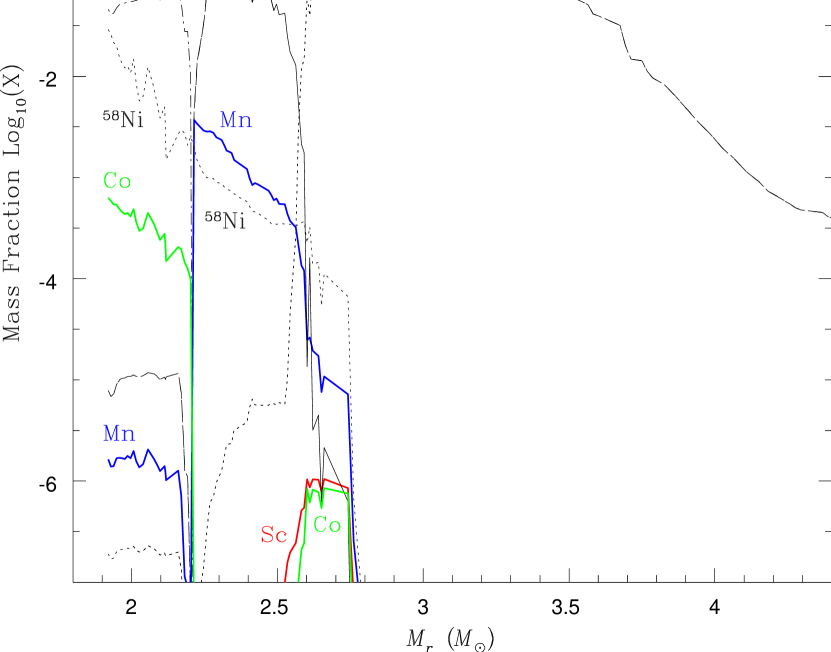
We explain effects of the -process on the production in the 25 HN model with . Figure 3 shows the distribution of the mass fractions in the 25 HN model without the -process. The mass coordinate ranges of the Ni and Si/S layers are and , respectively. The mass contained in each of the two layers for the 25 HN is larger than that of the corresponding layer of the 25 SN model. We see that the mass fractions of Sc, Mn, and Co in each burning region are not so different from those in the 25 SN; most of Sc and Mn are produced in the Si/S layer and Co is produced in the Ni layer. The average value of the Co mass fraction in the Ni layer is larger than that in the 25 SN.
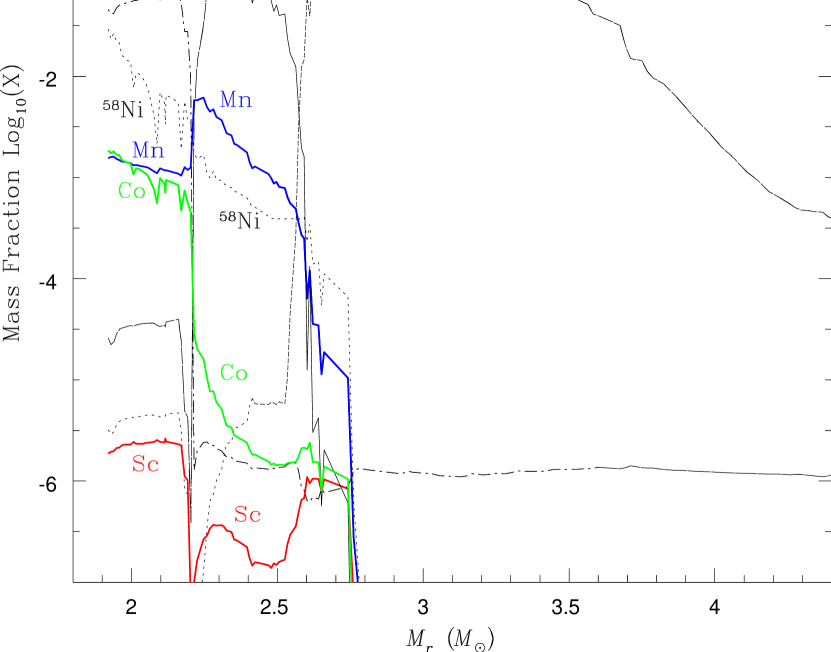
The distribution of the mass fractions in the 25 HN model with the -process ( ergs) is shown in Fig. 3. Increase in the mass fraction by the -process is mainly seen for Sc and Mn. As shown in the cases of the SNe, additional Sc is produced in the Ni layer. In addition, some Mn is also produced in there. Since the range of the Ni layer is large, the contribution from the Ni layer is larger than that from the Si/S layer in this case. On the other hand, clear effect of the -process is not seen for Co.
Figure 3 shows the mass fractions in the 25 HN model with larger neutrino irradiation ( ergs). As same as the SN case, the Sc abundance in the Ni layer is larger by about a factor of ten than that in the case of the normal neutrino irradiation ( ergs). The mass fraction of Mn is similarly larger. In the Si/S layer, the Mn amount also increases. On the other hand, the mass fraction of Co does not so change even with large neutrino irradiation. Co is produced through complete Si burning in the Ni layer and most of it is not decomposed during the explosion. Since HNe produce large amount of Co even without neutrino irradiation (Umeda & Nomoto, 2005), the additional production through the -process hardly affects the Co production.
4. Abundance Ratios of Sc, Mn, and Co
We have shown that some amounts of Sc, Mn, and Co are produced through the -process and the following capture reactions of neutrons and protons. This additional production increases the total abundances of these elements in Pop III SN and HN explosions. Hereafter we show the distributions of abundance ratios in the 15 and 25 SN and the 25 HN models. We also compare our results with the observed abundances of low mass EMP stars. As a reference of the observed abundances, we use the abundance ratios to Fe averaged in the data of 22 low mass halo stars with [Fe/H] in Cayrel et al. (2004).
4.1. 15 Supernova
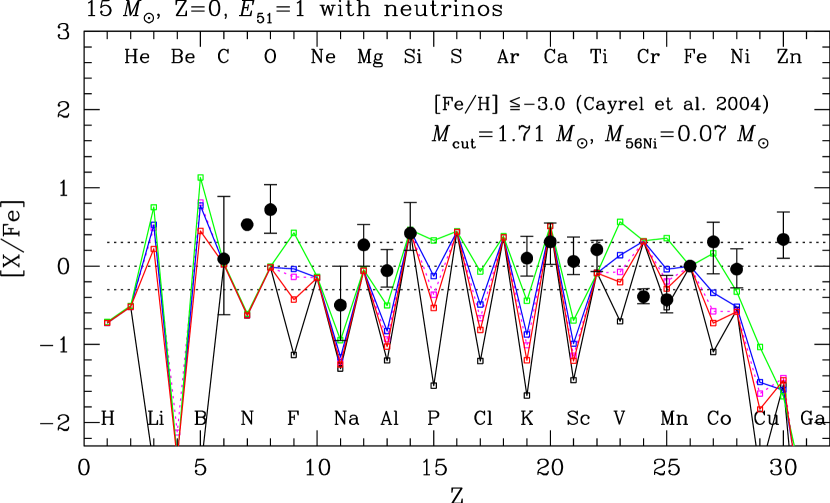
We show the abundance ratios in the 15 SN model in Fig. 4. The ratios of [Sc/Fe], [Mn/Fe], and [Co/Fe] are listed in Table 1. The abundance ratios of the three elements are much smaller than the corresponding solar ratios. For other elements, the abundance ratios of odd- elements are smaller than those of the even- elements in the neighbors. When we consider the -process, the ratios [Sc/Fe], [Mn/Fe], and [Co/Fe] increase by dex (see Table 1). Thus, the -process raises the abundances of these elements. Since the Fe abundance is not altered by the -process, the increase in the abundance ratios is due to the increase in the abundances by the -process. Larger irradiation of neutrinos enhances the abundances of these elements. In the case of ergs, the abundance ratios for Mn and Co are larger than the corresponding solar ratios (see Table 1 and Fig. 4). The abundance ratios of V, Mn, and Co are larger than those of the even- elements Ti, Cr, and Fe, respectively.
We see that [Sc/Fe], [Mn/Fe], and [Co/Fe] for ergs and ergs increase by dex and dex, respectively, compared with those with ergs. The total neutrino energies with ergs and ergs are three times and ten times larger than that with ergs.
Simple consideration leads to that the abundances of odd- elements produced through the -process are proportional to the neutrino flux, i.e., the total neutrino energy. Numerical simulations of the -process show that this property is approximately correct. The reaction rates of the -process are proportional to the total neutrino energy. At the same time, production rates of protons and neutrons produced through the -process are also proportional to the total neutrino energy. The increase in the production rates brings about the increase in the production of odd- elements through proton- and neutron-captures. However, decomposition rates of the odd- elements through proton- and neutron-captures also increase. Thus, the abundances produced through the -process increase less than proportional to the total neutrino energy.
We compare the obtained [Sc/Fe], [Mn/Fe], and [Co/Fe] with the corresponding observed results. The observed [Sc/Fe] averaged in 22 low mass EMP stars is 0.06. This value is slightly larger than the solar ratio and is still much larger than the calculated abundance ratio even in the case of the largest neutrino irradiation. For Mn, the observed [Mn/Fe] is . This abundance ratio is larger than the ratio without the -process and is reproduced by the result with the -process of the normal neutrino irradiation ( ergs). On the other hand, the Mn/Fe ratio in the case of ergs is much larger than the largest value in the observed ratios. The observed [Co/Fe] is 0.31, which is larger than the solar ratio. It is larger than the value in the SN model even with the largest neutrino irradiation.
4.2. 25 Supernova
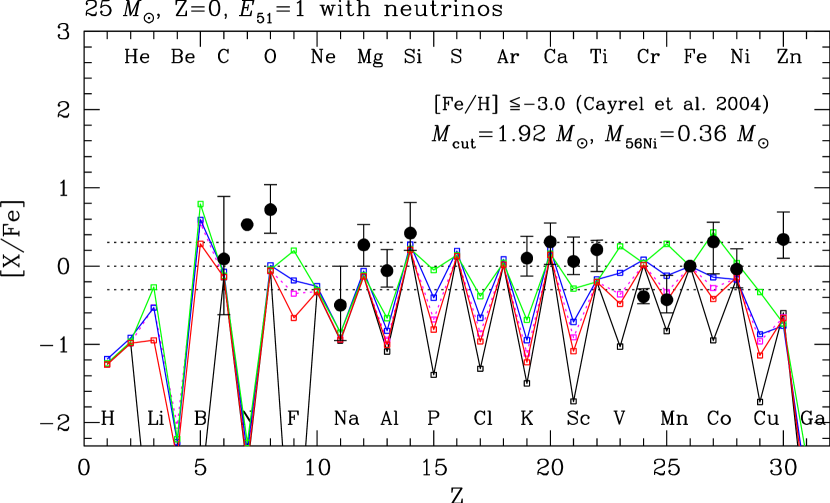
Figure 5 shows the abundance ratios of the 25 SN model. When we do not consider the -process, the abundance ratios of Sc, Mn, and Co are much smaller than the corresponding solar ratios (see also Table 1). The -process also enhances the production of these elements. When we consider the -process, the Sc/Fe ratio in this model is larger than that in the 15 SN model. This is because the seed nucleus of 45V, i.e., 44Ti, is abundantly produced in complete Si burning for the 25 SN. However, the Sc/Fe ratio is smaller than the observed ratio even in the case of the largest neutrino irradiation. On the other hand, the Mn/Fe ratio in this model well reproduces the observed ratio in the case with the -process of normal neutrino irradiation. The model with the largest neutrino irradiation ( ergs) overproduces Mn. The observed Co/Fe ratio is reproduced by the 25 SN model with the largest neutrino irradiation ergs; large neutrino irradiation is required similarly to the 15 SN case.
4.3. 25 Hypernova
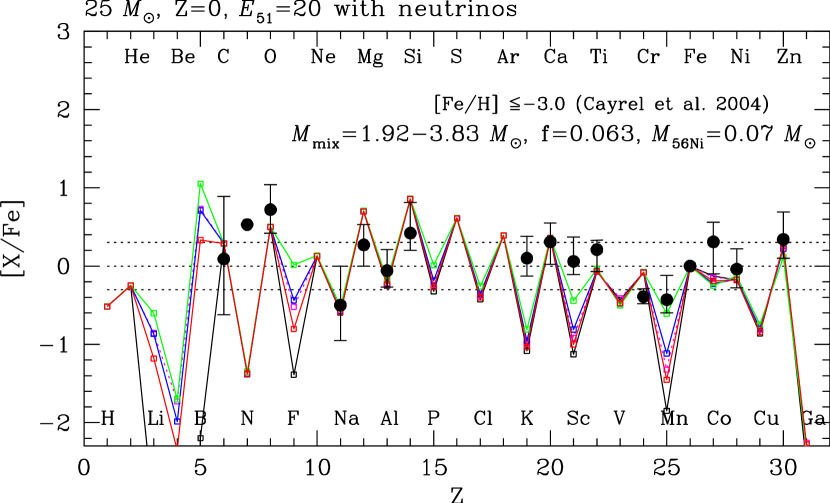
Figure 6 shows the distribution of the abundance ratios of the 25 HN model with . In this model we considered mixing-fallback as described in §2.1. When we do not consider the -process, the [Sc/Fe] and [Mn/Fe] are and , respectively (see also Table 1). The Mn/Fe ratio is much smaller than the corresponding ratios in the other two models. Mn is mainly produced in the Si/S layer without the -process (see Fig. 3), whereas the range of the Ni layer in the HN is larger than in the 25 SN. On the other hand, the Co/Fe is larger than those in the other SN models (see also Table 1). As shown in Fig. 3, the HN provides a large amount of Co through complete Si burning. The mass fraction of Co in the Ni layer is of order for the 15 and 25 SN models, and for the 25 HN.
When we consider the -process, the abundance ratios of Sc and Mn increase with the total neutrino energy. However, the Co abundance scarcely changes even taking into account the -process. The -process raises the abundances of Sc and Mn in the Ni layer. Although it also enhances the Co abundance there, the contribution from the -process is hindered by large Co production through complete Si burning.
We also compare our results with the observed ones. The obtained Sc/Fe ratio is smaller than the observed ratio. Even in the case of the largest neutrino irradiation, the abundance ratio is smaller by about 0.5 dex. The Mn/Fe ratio is marginally consistent with the observed ratio in the largest neutrino irradiation case. At the same time, the Co/Fe ratio is also marginally consistent with the observed ratio despite the -process; the smallest Co/Fe ratio is reproduced. The HN model reproduces the observed Mn/Fe ratio when the -process with large neutrino irradiation is taken into account. It reproduces the observed Co/Fe ratio even without the -process.
When we do not consider the -process, the abundance ratios of Sc/Fe, Mn/Fe, and Co/Fe in the Pop III SNe are smaller than the corresponding observed ratios. On the other hand, the observed Mn/Fe ratio is reproduced by the 15 and 25 SN models with the -process. The observed Co/Fe ratio is marginally reproduced by the 25 HN model even without neutrino irradiation. Thus, we can say that the -process in the Pop III SNe produce most of Mn observed in low mass EMP stars. The -process also produces Sc but the abundance is still short of the reproduction of the observed Sc/Fe ratios. HNe may provide Co being abundant enough to reproduce the observed Co/Fe ratios.
4.4. -Process with MeV
We briefly mention the abundance ratios in the case of the -process with MeV and ergs, which has been adopted in Woosley & Weaver (1995). The abundance patterns in the 15 and 25 SN and the 25 HN models are shown as dotted lines in Figs. . The values of [Sc/Fe], [Mn/Fe], and [Co/Fe] are tabulated in Table 1. The yields of Sc, Mn, and Co in this neutrino parameter set are larger by about 0.1 dex than those in the case of MeV. They are still smaller than those in the case of MeV and ergs. Therefore, the dependence on the neutrino temperature is not strong for the Sc, Mn, and Co yields.
5. Discussion
5.1. Abundance Pattern of VMP Stars
The abundance pattern of VMP stars are considered to reflect partly mixed interstellar materials in the early Universe. Recently, the averaged abundance pattern of VMP stars with in Cayrel et al. (2004) has been reproduced by the Pop III SN and HN yields integrated over the Salpeter IMF function (Tominaga et al., 2007b). However, the evaluated [Sc/Fe] and [Mn/Fe] are still short of the observed ratio. We discuss the enhancement of these ratios by the -process.
Tominaga et al. (2007b) evaluated the Sc/Fe ratio as [Sc/Fe] = whereas the observed value is [Sc/Fe] = . In this study, we showed that the -process raises the Sc yield by 1.1 dex at the maximum. However, this enhancement is still short for reproducing the observed value. Production sites other than the -process is needed to reproduce it (see §5.2).
The [Mn/Fe] ratio observed in VMP stars is . The evaluated value of [Mn/Fe] is . When we take into account the -process, this value increases by dex with ergs and dex with ergs. The increase by the -process with ergs will provide better fitting of the Pop III SN and HN yields to [Mn/Fe] in VMP stars.
The Pop III SN and HN models in Tominaga et al. (2007b) indicate [Co/Fe] close to the lowest ratio in VMP stars; [Co/Fe] = . Taking into account the -process with ergs, [Co/Fe] increases by dex in SNe and it does not in HNe. This enhancement is enough to reproduce the average [Co/Fe] ratio in VMP stars. The -process of the Pop III SNe and HNe is one of the preferable sites of the Mn and Co in VMP stars.
5.2. Other Production Sites of Sc, Mn, and Co
We have shown that Sc, Mn, and Co are produced through the -process in the Pop III SNe and HNe. For other than Mn, the -process in the SNe and HNe does not produce large enough abundances to reproduce the abundances observed in low mass EMP stars. So, we will discuss other synthesis processes proposed in recent studies.
5.2.1 Sc
Aspherical Explosions
As shown in previous studies (e.g., Umeda & Nomoto, 2002), spherically symmetrical SN and HN models do not provide enough amount of Sc to reproduce the observed abundance of low mass EMP stars. On the other hand, aspherical explosion and jet-like explosion produce larger amount of Sc (Maeda & Nomoto, 2003). In the case of spherical explosions, low-density structure enables to supply larger amount of Sc (Umeda & Nomoto, 2005). Thus, higher temperature and low density, which are realized by aspherical explosions, are one of the favorable environments to produce Sc. The amount of Sc produced in SNe and HNe is also sensitive to in complete Si burning region. Large value () brings about a large amount of Sc (Iwamoto et al., 2006).
Nucleosynthesis in Innermost Region of SNe
Detailed thermal evolution of the innermost region of SN ejecta, i.e., the neighbor of the “mass cut” has not been solved strictly. However, recent progress of hydrodynamical calculations has gradually revealed thermal evolution in such a deep region. At the same time, detailed nucleosynthesis in such a deep region has also been investigated. Pruet et al. (2005, 2006) investigated the nucleosynthesis in convective bubbles in the innermost region of SN ejecta and in early stage of neutrino-driven winds. They used results of two-dimensional hydrodynamical calculations by Janka et al. (2003). Fröhlich et al. (2006a) examined the simulations of one-dimensional self-consistent treatment of core-collapse SNe with modified neutrino cross sections to explode. They also investigated the nucleosynthesis in the innermost region just above the mass cut produced self-consistently.
Both of the studies showed that the electron fraction exceeds 0.5 in such regions, which enhances the production of Sc. In the latter study, they took into account all charged-current weak-interactions that changes in the ejecta. They obtained that the amount of Sc with is produced in the innermost region with . The Sc/Fe ratio evaluated in their study is slightly smaller than the averaged abundances observed in low mass EMP stars (Cayrel et al., 2004). Thus, the Sc/Fe ratio is larger than our result. They also showed that a significant amount of nuclei with mass of in this region, especially light -nuclei such as 92,94Mo and 96,98Ru (the -process; Fröhlich et al., 2006b).
It is noted that the region of is convectively unstable so that the region will mix with outer smaller region in dynamical time scale. However, they expected that the remains high in an average sense. Indeed, the former study took into account the convection in two-dimensional simulations and obtained . We also note that neutral-current -process reactions were not included in Fröhlich et al. (2006a, b). They also pointed out that neutrino-induced spallation reactions can change the final abundances of some nuclei. We expect that these reactions enhance the abundance of Sc and that the Sc/Fe ratio becomes close to the observed ratio.
It is also noted that materials blown off in neutrino-driven winds in early time after a SN explosion can achieve large value. Accordingly, the -process can take place in the materials. This synthetic process is strongly preferable for the production of the light -nuclei (Wanajo, 2006). However, the contribution of the -process in neutrino-driven winds to Sc production is small.
5.2.2 Mn
The amount of Mn produced in SNe and HNe is strongly sensitive to electron fraction in incomplete Si burning region (Umeda & Nomoto, 2002, 2005). Their HN models modifying value to produce enough amount of Mn to reproduce the observed one in low mass EMP stars. However, HN models, whose in incomplete Si burning region is not modified, indicated that the amount of Mn is less than the observed value. Aspherical explosions suppress Mn production (Maeda & Nomoto, 2003). We have shown that the Mn production during SN explosions is mainly due to the -process rather than to the incomplete Si burning. The -process with normal neutrino irradiation ( ergs) in SNe reproduces the Mn/Fe ratio averaged in low mass EMP stars even without modifications. In the case of ergs, the Mn amount marginally reproduces the upper limit of the observed Mn abundance. In the case of ergs, however, the SN models overproduce Mn. Thus, the -process in the Pop III SNe is one of the main production processes of Mn observed in low mass EMP stars. The observed abundance constrains the total neutrino energy in SNe. The observational constraint is ergs.
5.2.3 Co
A large amount of Co can be produced through complete Si burning in aspherical explosion (Maeda & Nomoto, 2003). For spherical explosions, Umeda & Nomoto (2005) pointed out that the Co abundance is significantly enhanced for in the case of HNe. However, the Co/Fe ratio in Fröhlich et al. (2006a) is still smaller than the observed ratio in Cayrel et al. (2004). Their model corresponds to a normal SN explosion. Therefore, HNe () with produce Co of which amount reproduces observed Co/Fe ratio in low mass EMP stars. Neutral-current -process reactions may help additional production in the deep region just above the mass cut. However, in the case of HNe, large amount of protons are also produced through -rich freeze out. This effect may hinder the proton production by the -process.
5.3. Comparison with Other SN Nucleosynthesis Models
The nucleosynthesis in Pop III SNe have been conducted in several groups. Here, we briefly compare with the abundances of Sc, Mn, and Co of 15 and 25 Pop III SN models in Woosley & Weaver (1995), hereafter abbreviated to WW95, (Z15A and Z25B models) and in Chieffi & Limongi (2004), abbreviated to CL04. The SN nucleosynthesis models in WW95 include the -process. The temperature of in WW95 is assumed to be 8 MeV, which is larger than the one adopted in this study. The SN nucleosynthesis with updated physics inputs of WW95 has been shown in Rauscher et al. (2002) but the Pop III SN nucleosynthesis has not been calculated. The nucleosynthesis models in CL04 do not include the -process. The explosion models in CL04 were set to be the ejected mass of 56Ni equal to 0.1 .
Woosley & Weaver (1995) indicate [Sc/Fe]= for model; the Sc/Fe is much larger than our result. On the other hand, CL04 indicates Sc/Fe slightly larger than our results of SN models without the -process ([Sc/Fe]= for 25 model). Although the Sc/Fe in WW95 is much larger than the other models, it is still smaller than the observed ratio. Therefore, other synthesis processes such as discussed above are necessary for Sc production.
The Mn/Fe shown in WW95 is smaller than the observed ratio ([Mn/Fe]). The 15 model in CL04 also indicates the Mn/Fe smaller than the observed one ([Mn/Fe]). The 25 model in CL04 indicates larger Mn/Fe ratio, which is comparable to the observed one ([Mn/Fe]). We showed that the -process increases the Mn abundance, but difference of stellar evolution models may affect the abundance.
The 15 models of WW95 and CL04 show [Co/Fe] of and , which are larger than the ratio of our SN models. Their 25 models indicate the Co/Fe similar to our results without the -process. The evaluated Co/Fe ratios are still short of the observed ratio, so that HNe will have an important role for Co production in the early Universe.
5.4. The -Process for Other Elements
5.4.1 Li and B
Among Li, Be, and B, 7Li and 11B are mainly produced through the -process. When the -process is not considered, the Li/Fe and B/Fe ratios are much smaller than the corresponding solar ratio. SN explosions with the neutrinos of ergs bring about Li yield ratio of [Li/Fe] . They also produce B of which yield ratio to Fe is larger than the solar ratio. Therefore, SN explosions may contribute to the B production in the early universe. The 7Li is mainly produced as 7Be in the He-rich region. The 11B is produced as 11C and 11B in C-enriched oxygen layer and C-enriched He layer. The Li and B production in HNe is less effective than that in SNe. Higher maximum temperature in the He layer decomposes 7Be and 11C produced through the -process and the following -captures. In addition, strong explosion makes the region of C-rich oxygen layer small.
5.4.2 F
The -process is a main F production process in SNe (Woosley et al., 1990). The F/Fe ratio including the -process is much larger than the one without the -process. The seed nucleus of F in the -process is 20Ne. Most of F is produced in O and Ne-enriched region. Stellar mass dependence of the F/Fe ratio is small in the SN models. On the other hand, the HN model shows smaller F/Fe ratio. The HN explosion brings about stronger explosive Ne burning, so that the O and Ne-enriched region becomes smaller.
5.4.3 Na and Al
Figures show that the -process scarcely affects the yields of Na and Al. Furthermore, the yield ratios are much smaller than the observed ratios even in the case of the largest neutrino irradiation. Although the -process enhances the abundances of Na and Al in incomplete Si burning region, Na and Al are mainly produced in carbon and neon shells. The yields produced in the outer two shells strongly depend on the nucleosynthesis in stellar evolution. Iwamoto et al. (2005) successfully reproduced relatively large [Na/Fe] and [Al/Fe] observed in two hyper-metal-poor stars. They considered that the effect of overshooting during preSN evolution and extensive matter mixing and fallback during SN explosions with small explosion energies.
5.4.4 V
Vanadium is mainly produced as 51Mn in incomplete Si burning region in SNe. In the case of the HN model, it is mainly produced in complete Si burning region. Additional production through the -process from 52Fe in incomplete Si burning region contributes to the enhancement of V in SNe. Low metallicity stars with indicate the V abundance ratios of (e.g., Honda et al., 2004; Kobayashi et al., 2006). The average abundance ratio is reproduced by the 15 and 25 SN models with the -process of ergs. In order to reproduce the V/Fe ratios, strong neutrino irradiation in the SNe is favored. In the case of the HN model, V is also produced through the -process. However, the produced abundance is much smaller than that produced in complete Si burning region.
6. Summary
The chemical compositions of low mass EMP stars are expected to be injected from one or a few SN or HN explosions evolved from Population III massive stars. The abundance ratios of odd- elements to Fe observed in these stars are close to the corresponding solar ratios. On the other hand, the abundances produced in complete and incomplete Si burning in SN explosion models are still in short.
In this study, we investigated the -process of odd- iron-peak elements, Sc, Mn, and Co, in the SN and HN explosions of 15 and 25 Pop III stars. Then, we compared the abundance ratios of these elements in the SN and HN models with those observed in the EMP stars. The obtained results are summarized as follows.
-
1.
Sc, Mn, and Co are produced through the -process and the following capture reactions of protons and neutrons in complete and incomplete Si burning region of Pop III SNe. The produced amounts of these elements are roughly proportional to the total neutrino energy.
-
2.
The observed Mn/Fe ratio averaged in low mass EMP stars is reproduced by the 15 and 25 Pop III SN models with the -process. Therefore, the -process in Pop III SNe is one of the main synthesis processes of Mn observed in low mass EMP stars. The observed Mn abundance constrains the total neutrino energy to ergs. This value is roughly consistent with the gravitational binding energy of a typical neutron star. In the case of the 25 Pop III HN model, large neutrino irradiation enables to reproduce the observed Mn/Fe ratio.
-
3.
The observed Co/Fe ratio is reproduced by the SN models. However, required total neutrino energy is ergs, which is larger than typical value of the gravitational binding energy of a proto-neutron star. Complete Si burning in Pop III HNe should be favorable to Co production rather than the -process of SNe and HNe.
-
4.
Although larger amount of Sc is produced through the -process, the Sc/Fe ratio is still smaller than the ratio observed in low mass EMP stars.
-
5.
Explosive nucleosynthesis during aspherical explosions and in a deep region just above the mass cut would be favorable to produce Sc and Co. The -process and the capture reactions of protons and neutrons may also enhance the production of Sc, Mn, and Co in these environments.
References
- Argast et al. (2004) Argast, D., Samland, M., Gerhard, O. E., & Thielemann, F.-K. 2004, A&A, 356, 873
- Cayrel et al. (2004) Cayrel, R., et al. 2004, A&A, 416, 1117
- Chieffi & Limongi (2004) Chieffi, A. & Limongi, M. 2004, ApJ, 608, 405
- Colella & Woodward (1984) Colella, P. & Woodward, P. R. 1984, J. Comput. Phys., 54, 174
- Domogatsky et al. (1978) Domogatsky, G. V., Eramzhyan, R. A., & Nadyozhin, D. K. 1978, in Neutrino Physics and Neutrino Astrophysics, ed. M. A. Markov et al. (Moscow: Nauka), 115
- Fröhlich et al. (2006a) Fröhlich, C., et al. 2006a, ApJ, 637, 415
- Fröhlich et al. (2006b) Fröhlich, C., Martínez-Pinedo, G., Liebendörfer, M., Thielemann, F.-K., Bravo, E., Hix, W. R., Langanke, K., & Zinner, N. T. 2006b, Phys. Rev. Lett., 96, 142502
- Goriely et al. (2001) Goriely, S., Arnould, M., Borzov, I., & Rayet, M. 2001, A&A, 375, L35
- Heger et al. (2005) Heger, A., Kolbe, E., Haxton, W. C., Langanke, K., Martínez-Pinedo, G., & Woosley, S. E. 2005, Phys. Lett. B, 606, 258
- Hix & Thielemann (1996) Hix, W. R. & Thielemann, F.-K. 1996, ApJ, 460, 869
- Honda et al. (2004) Honda, S., Aoki, W., Kajino, T., Ando, H., Beers, T. C., Izumiura, H. Sadakane, K., & Takada-Hidai, M. 2004, ApJ, 607, 474
- Iwamoto et al. (2005) Iwamoto, N., Umeda, H., Tominaga, N., Nomoto, K., Maeda, K. 2005, Science, 309, 451
- Iwamoto et al. (2006) Iwamoto, N., Umeda, H., Nomoto, K., Tominaga, N., Thielemann, F.-K., & Hix, W. R. 2006, in International Symposium on the Origin of Matter and Evolution of Galaxies 2005, ed. S. Kubono et al. (San Francisco: AIP), 409
- Janka et al. (2003) Janka, H.-Th., Buras, R., & Rampp, M. 2003, Nucl. Phys. A, 718, 269
- Kobayashi et al. (2006) Kobayashi, C., Umeda, H., Nomoto, K., Tominaga, N., & Ohkubo, T. 2006, ApJ, 653, 1145
- Kotake et al. (2004) Kotake, K., Sawai, H., Yamada, S., & Sato, K. 2004, ApJ, 608, 391
- Lattimer & Prakash (2001) Lattimer, J. M. & Prakash, M. 2001, ApJ, 550, 426
- Maeda & Nomoto (2003) Maeda, K. & Nomoto, K. 2003, ApJ, 598, 1163
- McLaughlin & Surman (2007) McLaughlin, G. C. & Surman, R. 2007, Phys. Rev. D, 75, 023005
- Nomoto et al. (2006) Nomoto, K., Tominaga, N., Umeda, H., Kobayashi, C., & Maeda, K. 2006, Nucl. Phys. A777, 424
- Norris et al. (2001) Norris, J. E., Ryan, S. G., & Beers, T. C. 2001, ApJ, 561, 1034
- Pruet et al. (2006) Pruet, J., Hoffman, R. D., Woosley, S. E., Janka, H.-T., & Buras, R. 2006, ApJ, 644, 1028
- Pruet et al. (2005) Pruet, J., Woosley, S. E., Buras, R., Janka, H.-T., & Hoffman, R. D. 2005, ApJ, 623, 325
- Rauscher et al. (2002) Rauscher, T., Heger, A., Hoffman, R. D., & Woosley, S. E. 2002, ApJ, 576, 323
- Scheck et al. (2004) Scheck, L., Plewa, T., Janka, H.-Th., Kifonidis, K., & Müller, E. 2004, Phys. Rev. Lett., 92, 011103
- Shigeyama & Tsujimoto (1998) Shigeyama, T. & Tsujimoto, T. 1998, ApJ, 507, L135
- Tominaga et al. (2007a) Tominaga, N., Maeda, K., Umeda, H., Nomoto, K., Tanaka, M., Iwamoto, N., Suzuki, T., & Mazzali, P. 2007a, ApJ, 657, L77
- Tominaga et al. (2007b) Tominaga, N., Umeda, H., & Nomoto, K. 2007b, ApJ, 660, 516
- Tominaga et al. (2005) Tominaga, N., et al. 2005, ApJ, 633, L97
- Umeda & Nomoto (2002) Umeda, H. & Nomoto, K. 2002, ApJ, 565, 385
- Umeda & Nomoto (2005) Umeda, H. & Nomoto, K. 2005, ApJ, 619, 427
- Wanajo (2006) Wanajo, S. 2006, ApJ, 647, 1323
- Woosley et al. (1990) Woosley, S. E., Hartmann, D. H., Hoffman, R. D., & Haxton, W. C. 1990, ApJ, 356, 272
- Woosley & Weaver (1995) Woosley, S. E. & Weaver, T. A. 1995, ApJS, 101, 181
- Yoshida et al. (2005a) Yoshida, T., Kajino, T., & Hartmann, D. H. 2005a, Phys. Rev. Lett., 94, 231101
- Yoshida et al. (2006a) Yoshida, T., Kajino, T., Yokomakura, H., Kimura, K., Takamura, A., & Hartmann, D. H. 2006a, ApJ, 649, 319
- Yoshida et al. (2006b) Yoshida, T., Kajino, T., Yokomakura, H., Kimura, K., Takamura, A., & Hartmann, D. H. 2006b, Phys. Rev. Lett., 96, 091101
- Yoshida et al. (2004) Yoshida, T., Terasawa, M., Kajino, T., & Sumiyoshi, K. 2004, ApJ, 600, 204
- Yoshida et al. (2005b) Yoshida, T., Umeda, H., & Nomoto, K. 2005b, ApJ, 631, 1039