001–005
The Relation of Galaxies
Abstract
Courteau et al. (2007a) reported on the dependence of the ratio of a galaxy’s maximum circular velocity, , to its central velocity dispersion, , on morphology, or equivalently total light concentration. This concentration relation, which involves details about the local and global galaxy physics, poses a fundamental challenge for galaxy structure models. Furthermore, not only must these models reproduce the relation and its various dependences, they must simultaneously match other fundamental scaling relations such as the velocity-size-luminosity and color-luminosity relations of galaxies. We focus here on the interpretation of parameters that enter the relation to enable proper data-model comparisons and follow-up studies by galaxy modelers and observers.
keywords:
galaxies: fundamental parameters, galaxies: kinematics and dynamics1 Introduction
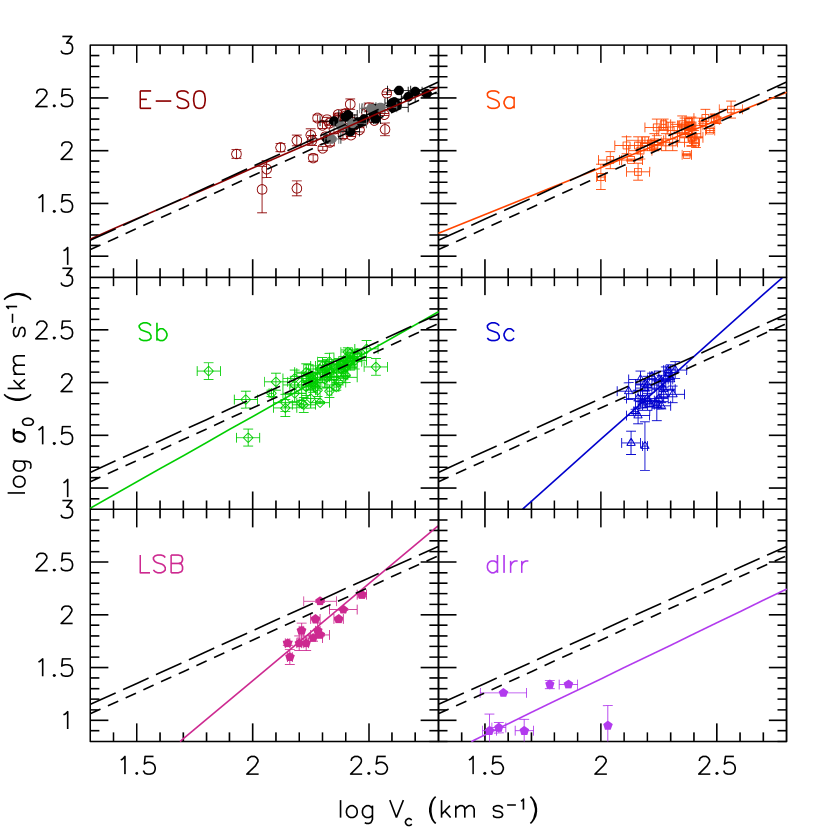
The relation is of great interest for galaxy structure models since it links two quantities that depend separately on global and local physics. The galaxy circular velocity, where is the total mass within of the center, is directly related to the total mass of the galaxy whereas the central velocity dispersion, , is a measure of the local central potential. These two quantities could in principle be independent. It is well known that the brightest, bulge dominated (E, S0, and some Sa), galaxies obey closely the relation expected for isothermal gravitational systems (Whitmore et al. 1979; Courteau et al. 2007a; Ho 2007). The lower surface brightness regime, dominated by later-type spiral and dwarf galaxies, however departs from the isothermal solution and the ratio here scales with surface brightness (Pizzella et al. 2005; Buyle et al. 2006; Courteau et al. 2007a; Ho 2007) or, equivalently, total light concentration or morphological type. The correlation between concentration index and Hubble type is discussed by Strateva et al. (2001) in the context of SDSS galaxies. Figure 1 encapsulates the dependence of the relation on the galaxy Hubble type. The current data (see Courteau et al. 2007a for details) show that for dIrr galaxies suggesting that these galaxies live in very dominant dark matter halos.
In order to understand and, ideally, model the values of and and their dependence on each other, we must pay close attention to their precise definition and how they are being measured.
2 Data
Measurements of the circular velocity differ for gas-rich and gas-poor systems. For the former, is often estimated to be the maximum deprojected orbital velocity, , usually measured from emission lines. This is marginally correct so long as lies beyond the radius where non-circular velocities from asymmetric drift are dominant; for bright spiral galaxies, that radius can be as small as two disk scale lengths (e.g. Courteau et al. 2003; Spekkens & Sellwood 2007) but it rises to more than three disk scale lengths at lower surface brightnesses (Rhee et al. 2004; Valenzuela et al. 2007). Neglect of this effect can have nefarious consequences on estimates of . The measurement of for gas-poor (spheroidal) galaxies is inferred via non-parametric dynamical modeling of the absorption line features and surface brightness profiles of these galaxies (Gerhard et al. 1998; Kronawitter et al. 2000; Gerhard et al. 2001; Cappellari et al. 2006).
The one-dimensional line-of-sight (projected) central velocity dispersion, , is measured from selected absorption lines (e.g. Lick indices) typically within the central or the radius corresponding to the slit width. A theorist would estimate first by building a model for the phase space distribution function (DF) of the stars and then integrating over the DF (see Binney & Tremaine 1987, Eq. 4-57). Alternatively, one can generate an N-body representation of the galaxy from the DF and calculate the rms velocity along a given line of sight within a “beam” whose width is chosen to match that of the observations. This N-body representation provides a suitable starting point for numerical simulations to study the formation of bars and bulges which in turn can affect .
Various observers correct to a standard aperture of , where is the effective radius of the galaxy spheroid (e.g. Jorgensen et al. 1995; Cappellari et al. 2006; MacArthur et al. 2007). This definition is however awkward for disk dominated systems with a bulge as cannot be uniquely determined. Fortunately, aperture effects may be small (Pizzella et al. 2004) and the correction to for aperture size is here neglected. is therefore measured the same way for high and low surface brightness galaxies. Two other effects may bias the determination of : net rotation of the bulge and contamination from the (largely rotating) disk. The latter has been verified to be small, even in late-type spirals (Pizzella et al. 2004). The rotation of the bulge can be estimated on a case-by-case basis and while most studies thus far have found little angular momentum in galaxy bulges more research on this topic, with the largest possible telescopes or numerical simulations, is called for. Thus, much like Gebhardt et al. (2000), our aperture dispersions include a contribution from rotationally supported material (i.e., the rms velocity is measured relative to the systemic velocity, not relative to the local mean velocity). The measured dispersion also depends on the inclination of the galaxy; this can be estimated in principle by the strength of the stellar rotation.
and are linked, as in Courteau et al. (2007a) and Ho (2007), by concentration (figures not shown here). Our data base includes the concentration measure where and are the radii measured at 80% and 20% of total light. Theory suggests that is controlled by the degree of compactness of a galaxy as measured either by morphology, B/T, surface brightness, concentration, etc. (Courteau et al. 2007a; Peñarrubia et al. 2007). A significant advantage of concentration is its non-parametric definition, independence of photometric calibration, and weak dependence on inclination. Concentration indices however depend on the photometric bands and our data base uses SDSS -band images.
It should be noted that Ho (2007) recently used integrated 21cm line widths and central velocity dispersions from HyperLeda and SDSS for 792 galaxies spanning a broad range of Hubble types to reproduce the results presented in Courteau et al. (2007a). His concentrations used a ratio of SDSS -band Petrosian radii enclosing 90% and 50% of the light. There is global agreement between the two concentration measures of Courteau et al. (2007a) and Ho (2007) albeit with noticeable scatter. In spite of these concerns and differences in the global samples and data products, the complimentary studies of Courteau et al. (2007a) and Ho (2007) come to close agreement about the dependence of the ratio on concentration.
Nonetheless, in order to reproduce Fig. 1 and the overall concentration relation of galaxies, especially from theoretical/numerical stand-points (which we have no room to discuss here but see Courteau et al. 2007a for an introduction), care must be taken to use quantities as defined above. Our complete data compilation is available at www.astro.queensu.ca/courteau/data/VSigmaC28.dat.
3 Further developments
Models of galaxy structure ought to reproduce the relation and its dependence on concentration, in addition to matching other basic scaling relations of galaxies such as the velocity-size-luminosity relations reported in, for instance, Gnedin et al. (2006), Courteau et al. 2007b and Dutton et al. (2007). Matching these relations at different wavebands, and thus accounting for the color-luminosity relation of galaxies, is another formidable challenge.
One must bear in mind that the data reported here, as well as in Ho (2007), come from widely heterogeneous data bases. While homogenization has been optimised, there is still no substitute to perfectly homogeneous data by design and we urge the community to invest in long-term dedicated surveys of kinematic parameters for galaxies of all types. Only with well-understood dynamical measurements can we construct a complete and robust picture of dynamical evolution of galaxies ranging from the central supermassive black holes and nuclear star clusters to the largest halo structures in galaxies.
Acknowledgements.
We are grateful to Alessandro Pizzella, Anatoly Klypin, Sandra Faber and Andy Burkert for useful discussions that prompted various comments reported here. S.C. and L.M.W. acknowledge the support of NSERC through respective Discovery grants. Thank you Martin for a superb symposium!References
- [Binney & Tremaine(1987)] Binney, J., & Tremaine, S. 1987, Princeton, NJ, Princeton University Press, 1987; see p. 205.
- [Buyle et al.(2006)] Buyle, P., Ferrarese, L., Gentile, G., Dejonghe, H., Baes, M., & Klein, U. 2006, MNRAS, 373, 700
- [Cappellari et al.(2006)] Cappellari, M., et al. 2006, MNRAS, 366, 1126
- [Courteau et al.(2003)] Courteau, S., Andersen, D. R., Bershady, M. A., MacArthur, L. A., & Rix, H.-W. 2003, ApJ, 594, 208
- [Courteau et al.(2007a)] Courteau, S., McDonald, M., Widrow, L. M., & Holtzman, J. 2007a, ApJL, 655, L21
- [Courteau et al.(2007b)] Courteau, S., Dutton, A. A., van den Bosch, F., MacArthur, L. A., Dekel, A., McIntosh, D. H., & Dale, D. A. 2007b, ArXiv e-prints, 708, arXiv:0708.0422
- [Dutton et al.(2007)] Dutton, A. A., van den Bosch, F. C., Dekel, A., & Courteau, S. 2007, ApJ, 654, 27
- [Gebhardt et al.(2000)] Gebhardt, K., et al. 2000, ApJL, 539, L13
- [Gerhard et al.(1998)] Gerhard, O., Jeske, G., Saglia, R. P., & Bender, R. 1998, MNRAS, 295, 197
- [Gerhard et al.(2001)] Gerhard, O., Kronawitter, A., Saglia, R. P., & Bender, R. 2001, AJ, 121, 1936
- [Gnedin et al.(2006)] Gnedin, O. Y., Weinberg, D. H., Pizagno, J., Prada, F., & Rix, H.-W. 2006, ArXiv Astrophysics e-prints, arXiv:astro-ph/0607394
- [Graham et al.(2001)] Graham, A. W., Erwin, P., Caon, N., & Trujillo, I. 2001, ApJL, 563, L11
- [Ho(2007)] Ho, L. C. 2007, ArXiv e-prints, 706, arXiv:0706.4347
- [Jorgensen et al.(1995)] Jorgensen, I., Franx, M., & Kjaergaard, P. 1995, MNRAS, 276, 1341
- [Kronawitter et al.(2000)] Kronawitter, A., Saglia, R. P., Gerhard, O., & Bender, R. 2000, A&A Supp., 144, 53
- [Kuijken & Dubinski(1995)] Kuijken, K., & Dubinski, J. 1995, MNRAS, 277, 1341
- [Lotz et al.(2004)] Lotz, J. M., Primack, J., & Madau, P. 2004, AJ, 128, 163
- [MacArthur et al.(2007)] MacArthur, L. A., Ellis, R. S., & Treu, T. 2007, Proceedings IAU Symposium 245, Eds. M. Bureau, E. Athanassoula & B. Barbuy
- [Peñarrubia et al.(2007)] Peñarrubia, J., McConnachie, A., & Navarro, J. F. 2007, ArXiv Astrophysics e-prints, arXiv:astro-ph/0701780
- [Pizzella et al.(2004)] Pizzella, A., Corsini, E. M., Vega Beltrán, J. C., & Bertola, F. 2004, A&A, 424, 447
- [Pizzella et al.(2005)] Pizzella, A., Corsini, E. M., Dalla Bontà, E., Sarzi, M., Coccato, L., & Bertola, F. 2005, ApJ, 631, 785
- [Rhee et al.(2004)] Rhee, G., Valenzuela, O., Klypin, A., Holtzman, J., & Moorthy, B. 2004, ApJ, 617, 1059
- [Spekkens & Sellwood(2007)] Spekkens, K., & Sellwood, J. A. 2007, ArXiv e-prints, 708, arXiv:0708.2852
- [Strateva et al.(2001)] Strateva, I., et al. 2001, AJ, 122, 1861
- [Valenzuela et al.(2007)] Valenzuela, O., et al. 2007, ApJ, 657, 773
- [Whitmore et al.(1979)] Whitmore, B. C., Schechter, P. L., & Kirshner, R. P. 1979, ApJ, 234, 68
- [Widrow & Dubinski(2005)] Widrow, L. M., & Dubinski, J. 2005, ApJ, 631, 838
EmsellemAre the models by Widrow & Dubinski (2005 [WD05]) reported in Courteau et al. (2007a) and shown in your presentation [but omitted in this paper] using values for on consistent with observed values?
CourteauTo all possible extent, yes. The GalactICS model (Kuijken & Dubinski 1995; WD05) provides self-consistent equilibrium phase-space distribution functions for bulge-disk-halo systems. So, in principle, it is possible to compute the way observers do as a mix of all bulge and disk particles within some fixed apertures projected on the sky. The development of such models is a life-long affair though and better data-model agreements should be expected with improved treatments of density profile cores, presence of spiral arms, hydrodynamical effects, etc. I was delighted to learn at this conference that Hervé Wozniak is already attempting to reproduce the relation. Unlike WD05, his models include gas dynamics though the significance of this has yet to be fleshed out.
BendoRather than using concentration which depends on inclination, why not use a more robust parameter for morphology such as M20 as defined by Lotz et al. 2004?
CourteauThe motivation of this exercise is to use any unbiased morphological indicator that can be linked to a theoretical interpretation of the dependence of on . Hubble type, surface brightness, concentration, Gini, M20, and the likes are all useful. However, morphological types usually have an observer bias, surface brightnesses depend on the absolute magnitude calibration, etc. We chose concentration because it is a straightforward parameter that can be computed with unscaled profiles ( does depend on waveband though) for observers and theorists alike. Note also that this concentration parameter is only weakly inclination dependent since the similar inclination dependences of the radii and essentially cancel out [a figure was shown to support this argument]. The inclination dependence is even weaker for the concentration parameter of Ho (2007).
PeletierCould you use a parameter from pseudo-bulges to disentangle the relation?
CourteauGraham et al. (2001) have already discussed the correlation of the bulge light concentration, in lieu of the central velocity dispersion, with the central supermassive black hole mass. Because we are interested in matching local () with global () physics in galaxies, the specifics of any putative pseudo-bulge are of lesser interest to us at the moment. This is not to say that the study of the formation and evolution of bulges of all forms isn’t fascinating in its own right!