Spitzer Space Telescope spectral observations of AGB stars in the Fornax dwarf spheroidal galaxy
Abstract
We have observed five carbon-rich AGB stars in the Fornax dwarf spheroidal (dSph) galaxy, using the Infrared Spectrometer on board the Spitzer Space Telescope. The stars were selected from a near-infrared survey of Fornax and include the three reddest stars, with presumably the highest mass-loss rates, in that galaxy. Such carbon stars probably belong to the intermediate-age population (2–8 Gyr old and metallicity of ) of Fornax. The primary aim of this paper is to investigate mass-loss rate, as a function of luminosity and metallicity, by comparing AGB stars in several galaxies with different metallicities. The spectra of three stars are fitted with a radiative transfer model. We find that mass-loss rates of these three stars are 4–7 yr-1. The other two stars have mass-loss rates below yr-1. We find no evidence that these rates depend on metallicity, although we do suggest that the gas-to-dust ratio could be higher than at solar metallicity, in the range 240 to 800. The C2H2 bands are stronger at lower metallicity because of the higher C/O ratio. In contrast, the SiC fraction is reduced at low metallicity, due to low silicon abundance. The total mass-loss rate from all known carbon-rich AGB stars into the interstellar medium of this galaxy is of the order of yr-1. This is much lower than that of the dwarf irregular galaxy WLM, which has a similar visual luminosity and metallicity. The difference is attributed to the younger stellar population of WLM. The suppressed gas-return rate to the ISM accentuates the difference between the relatively gas-rich dwarf irregular and the gas-poor dwarf spheroidal galaxies. Our study will be useful to constrain gas and dust recycling processes in low metallicity galaxies.
keywords:
stars: AGB and post-AGB – stars: atmospheres – stars:mass-loss stars: carbon –1 Introduction
Stars with low and intermediate initial mass (from 1 to 8 ) loose their atmospheres towards the end of their lives (1–10 Gyr after their birth). This mass loss is intense; approximately 50–80 % of the stellar mass is lost during the Asymptotic Giant Branch (AGB) phase. Understanding this process and the composition of the gas lost from AGB stars is important for understanding both stellar and galactic evolution. First, the stellar wind removes material from AGB stars, reducing their mass and influencing their evolution. Secondly, AGB stars are among the primary sources of metal-enriched gas and dust grains in the interstellar medium of galaxies (Maeder, 1992). In particular, carbon-rich dust grains are formed solely in carbon-rich AGB stars (Dwek, 1998). Theoretical work has suggested that AGB mass-loss rates depend on metallicity (Bowen & Willson, 1991; Willson , 2006), because the stellar wind is triggered by radiation pressure on dust grains and the dust is made up of astronomical metals, such as oxygen, carbon, silicon, iron and aluminium. Therefore a study of extra-galactic AGB stars is vital, both because it allows us to study mass loss at low metallicity, and because the distances to the parent galaxies are known, so that stellar parameters can be derived with some precision. A high sensitivity mid-infrared instrument is required for such a mass-loss study; at present this is provided uniquely by the Spitzer Space Telescope (Werner et al., 2004).
The Fornax dSph galaxy is the second (after Sagittarius) most luminous dSph galaxy known in the Local Group. The metallicity of red giants has been measured to be as low as [Fe/H]111Here we use the chemical abundance ratio of any element , [/H] = log (/H)-log(/H)☉ where log (H)=12 is the abundance of hydrogen by number of atoms. The metallicity of the galaxy is represented by iron abundance.= and with a mean value of (Tolstoy et al., 2001). This value is lower than that found in the LMC (; median value of red giants in the bar; Cole et al., 2005) and the SMC ( or ; Smith & Lambert, 1989; van den Bergh, 1999). The metallicity of AGB stars has not yet been determined in these galaxies, except for one AGB star in the SMC, which has been estimated at (de Laverny et al., 2006). This is consistent, within the error, with the values quoted above for red giants. Thus, the Fornax dSph is an ideal target to explore the lower metallicity range. Fornax has globular clusters; their ages range from 7 to 14 Gyrs (Strader et al. , 2003). Battaglia et al. (2006) found three distinct periods of star forming activity in the galaxy. The dominant population, to which the AGB stars are most likely to belong, is 2 to 8 Gyr old. There may have experienced star-forming activity until a few times years ago, but this young population is small. Fornax is gas poor at the present time; Young (1999) reported a non-detection of HI gas, although Bouchard et al. (2006) have detected more distant gas possibly associated with Fornax.
The distance modulus of the Fornax dSph is quoted as: =20.76 mag (Demers et al., 1990), =20.700.12 mag (Saviane et al., 2000) and =20.740.11 mag (Gullieuszik et al., 2007). These values are consistent and we adopt 20.76 mag in this paper. The Fornax dSph galaxy is elliptical in shape and the major axis is longer than the minor axis by a factor of at least two (Irwin & Hatzidimitriou, 1995). The thickness of the galaxy is negligible at its distance. The interstellar reddening towards Fornax is (Demers et al., 2002), and its effect is negligible in the infrared.
Demers & Kunkel (1979) found red giants in the Fornax dSph galaxy and Aaronson & Mould (1980) established that some of these are (AGB) carbon stars. Azzopardi (1999) claim to have detected 104 carbon rich stars in this galaxy. Because of its low metallicity, relatively close distance, and reasonable number of AGB stars, the Fornax dSph is an ideal galaxy to study the influence of metallicity on the evolution of AGB stars.
As follow-up to our Spitzer spectroscopic survey of AGB stars in the LMC (Zijlstra et al., 2006; Matsuura et al., 2006) and the SMC (Lagadec et al., 2007a), we have undertaken spectral observations of carbon stars in Fornax, using the Infrared Spectrograph (IRS) (Houck et al., 2004) on the Spitzer Space Telescope. This study aims to investigate the spectra of the AGB stars and to ascertain the influence of metallicity on AGB mass-loss rates and on the composition of molecules and dust grains, down to a metallicity of one tenth of the solar value.
2 Targets
Our target selection is based on a monitoring program with the Infrared Survey Facility (IRSF; Glass & Nagata, 2000; Menzies et al., 2002) at Sutherland in South Africa (Menzies et al. in preparation). Table 1 lists the five targets together with their coordinates and cross-identifications. Photometric measurements of the targets from the literature are summarised in Table 2. The variability of these stars will be discussed elsewhere (Menzies et al. in preparation), but all of them show large amplitude periodic changes, and are most likely Mira variables. This variability will result in spectral changes if the stars are indeed Miras, (e.g. Hron et al., 1998; Busso et al., 2007).
Fig. 1 shows an infrared colour-magnitude diagram of our targets, where they are compared with LMC stars. Our sample is located on the sequence of LMC AGB stars, although the Fornax stars tend to have fainter magnitudes than do LMC stars with similar colours.
Our three red carbon-rich stars (Fornax 13-23, 12-4, and 3-129) are redder in than anything described in a recent near-infrared survey of Fornax (Gullieuszik et al., 2007) and probably have the thickest shells of any AGB stars in that galaxy.

The Fornax dSph galaxy is roughly elliptical in shape, although the ellipticity varies slightly depending on the distance from the galaxy centre. All of our targets are located within an ellipse of 0.4 deg semi-major axis and ellipticity of 0.3 (see Battaglia et al. (2006) their Fig. 1; Fig. 2 in our work). A colour-magnitude diagram of Fornax (Battaglia et al., 2006) shows the ‘AGB bump’, which marks the beginning of the AGB phase; stars in this bump belong to an intermediate age population. Because of the typical age of AGB stars, it is most likely that our targets also belong to the intermediate age population, which has a metallicity of [Fe/H] (Battaglia et al., 2006). Contamination by young (1 Gyr) carbon stars is possible, but not likely. Such young carbon stars would have high luminosities, close to the AGB luminosity limit, which are not found for any of our sample (Fig.1). In addition, the population of such young carbon stars must be small.
Tolstoy et al. (2003) found [Fe/H] among some red giants from optical high spectral resolution observations, but the majority were between and according to the medium resolution spectroscopic survey (Tolstoy et al., 2001; Battaglia et al., 2006). The median of the ‘current’ metallicity of red giants is [Fe/H] according to spectroscopic observations of over a hundred stars (Pont et al., 2004). Furthermore, a planetary nebula, which is carbon-rich, shows [Fe/H] (Kniazev et al., 2007). We conclude that [Fe/H] is a reasonable assumption for the population we are dealing with.
Two of our targets were identified as carbon stars by Demers et al. (2002). The other three targets were not included in their sample, because they selected carbon stars with .

| Name | Coordinates (J2000) | 2MASS designation† | Other names | ref | |
|---|---|---|---|---|---|
| Fornax 13-23 | 02h38m50.6s | 34d40m32.0s | 023850563440319 | ||
| Fornax 12-4 | 02h39m12.3s | 34d32m45.0s | 023912323432450 | ||
| Fornax 3-129 | 02h39m41.6s | 34d35m56.7s | 023941603435567 | ||
| Fornax 4-25 | 02h40m10.2s | 34d33m21.9s | 024010163433218 | V20, C10, DM19 | 1,2,3 |
| Fornax 6-13 | 02h40m31.2s | 34d28m44.2s | 024031233428441 | DM22 | 1,3 |
| Name | DI1 | WEL2 | IRSF3 | 2MASS4 | ||||||
|---|---|---|---|---|---|---|---|---|---|---|
| period | ||||||||||
| Fornax 13-23 | 13.6500.4 | 3.147 | 16.1060.0939 | 14.5250.0527 | 12.8790.0287 | |||||
| Fornax 12-4 | 12.8230.3 | 3.027 | 14.7220.0334 | 13.2620.0384 | 12.1200.0242 | |||||
| Fornax 3-129 | 13.9070.4 | 3.764 | 17.663 | 15.9700.2049 | 14.1640.0695 | |||||
| Fornax 4-25 | 18.6 | 317.2 | 18.43 | 2.92 | 13.2210.2 | 1.984 | 14.0630.0256 | 13.1220.0214 | 12.5450.0285 | |
| Fornax 6-13 | 13.3780.1 | 1.896 | 14.7450.0433 | 13.6890.0456 | 13.0720.0365 |
3 Observations and data reduction
Our targets were observed with the IRS on board the Spitzer Space Telescope, using the low resolution mode. Only the short-low (SL) module was used with a spectral coverage from 5 to 15 m. This wavelength range is covered by three segments SL2, SL1 and a bonus order. The spectral resolution is in the range from 60 to 127. The program ID number is 20357.
Observations were carried out on 2006 January 27th to 30th. The exposure time per star was 1440 s (60 s24 cycles) for SL2 (5.2 to 8.7 m) and 1680 s (60 s28 cycles) for SL1 (7.4 to 14.5 m (officially), but extends up to 15.0 m). We used a nearby star, IRAS F023753443 (02h39m35.23s, 34d30m37.2s), to peak-up on.
The data were processed through the S13.2 and S14.0 version of the Spitzer Science Center’s pipeline. The reduction started from the droop products which are equivalent to the commonly used bcd data, but lack flat-field and stray-cross-light removal (the latter is only important for bright sources). Rogue pixels are first flagged using a campaign mask and then removed using the irsclean222This tool is available from the SSC web site: http://ssc.spitzer.caltech.edu tool. Different cycles (repetitions) were averaged to improve the S/N. Finally, one dimensional spectra were extracted using a variable extraction window set at 4 pixels at the middle of each order. The calibration was performed by dividing the resultant spectrum by that of the calibration star HR 6348 (extracted in the same way as the target) and multiplying by its template (Cohen et al. (2003); Sloan et al. in prep).
4 Description of the spectra
Fig. 3 shows the Spitzer/IRS spectra of the five target stars; all are carbon-rich. The target selection (long period variability) was independent of spectral classification (i.e. O-rich versus C-rich), and this suggests that high mass loss is only exhibited by carbon stars in this galaxy. Absorption features at 7.5 and 13.7 m are due to C2H2. There may be some contribution from HCN in the absorption feature at 7 m. The emission at 11.3 m is a dust excess from SiC. A dip at 6 m is part of the 5 m CO fundamental, possibly blended with C3 absorption bands. CO molecules will be present in all cool AGB stars. The identification of C3 in the Fornax stars is not certain, because the wavelength coverage of IRS is not favourable for this band, but the presence of C3 is known for some Galactic (albeit blue) carbon stars (Jørgensen et al., 2000; Yamamura et al., 1997) and therefore it is likely to be present in these extra-galactic stars. The SiC excess at 11.3 m is strong in Fornax 13-23 and Fornax 3-129 and weak in Fornax 12-4. This feature is marginally detected in Fornax 4-25 and is not obvious in Fornax 6-13. The feature at 8.5 m is caused by the band gap.
Fornax 6-13 does not show any obvious feature in its IRS spectrum. However, its near-infrared colour, , suggests that this star is carbon-rich (Cioni et al., 2001), and this is confirmed by near-infrared spectra (Groenewegen et al. in preparation). Demers et al. (2002) also spectroscopically identified Fornax 4-25 and Fornax 6-13 as carbon stars.

4.1 Band strengths
| Name | [6.4][9.3] | |||||
|---|---|---|---|---|---|---|
| m | m | mJy | mJy | mag | ||
| For 13-23 | 0.25 | 0.14 | 0.022 | 7.2 | 6.7 | 0.73 |
| For 12-4 | 0.08 | 0.04 | 0.058 | 10.8 | 8.4 | 0.55 |
| For 3-129 | 0.22 | 0.15 | 0.029 | 12.7 | 10.6 | 0.62 |
| For 4-25 | 0.15 | 0.03 | 0.019 | 2.9 | 1.4 | 0.04 |
| For 6-13 | 0.11 | 0.01 | 0.026 | 2.1 | 1.2 | 0.20 |
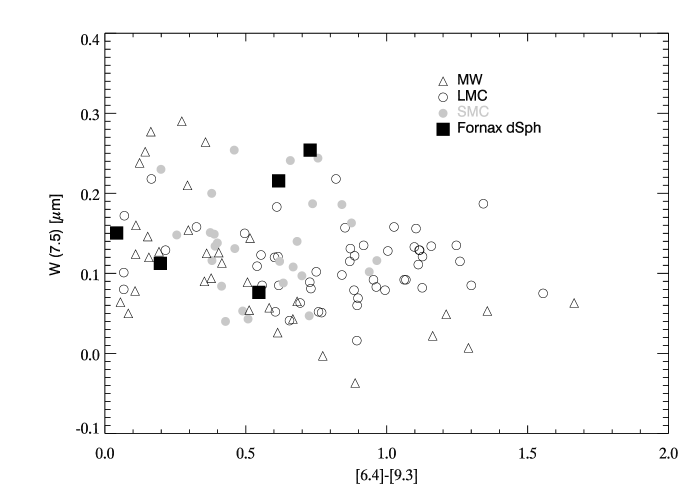
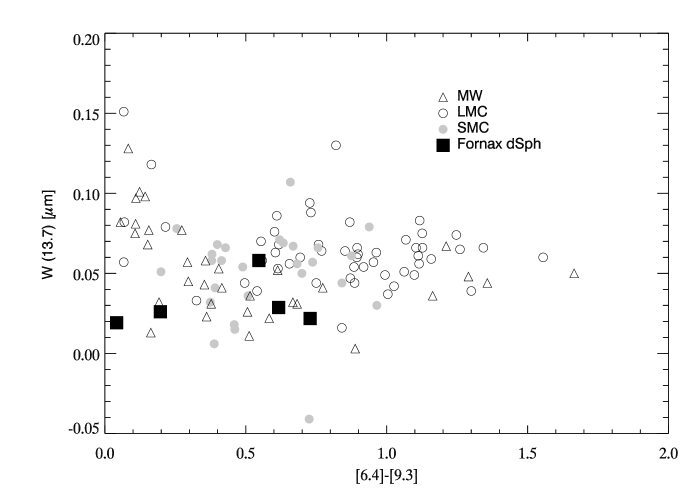
We measured the equivalent width of the molecular bands and the strength of the SiC dust emission, so as to evaluate the metallicity dependence of these features. The equivalent width of the C2H2 molecular bands and SiC are measured following the method of Zijlstra et al. (2006). Figs. 4 and 5 show 7.5 and 13.7 m C2H2 equivalent widths as a function of infrared colour [6.4][9.3]. The [6.4] and [9.3] values are calculated from the Spitzer/IRS spectra, and the definition of these magnitudes is also given by Zijlstra et al. (2006); the bands being selected so as to avoid major molecular features. [6.4][9.3] is a measure of the stellar temperature for blue stars, but of circumstellar excess for red stars. Samples in our Galaxy (Milky Way), the LMC and the SMC are also plotted in the figures (Sloan et al., 2003, 2006; Zijlstra et al., 2006; Lagadec et al., 2007a). As seen in the spectra and Table 3, Fornax 13-23 and 3-129 have a large equivalent width at 7.5 m (W(7.5)=0.2–0.25 m) with respect to the infrared colour [6.4][9.3]. Here W is the acronym of ‘equivalent Width’. These band strengths are some of the largest found in the range [6.4][9.3], within the samples from various galaxies. A high value of W(7.5), with respect to infrared colour, is found for stars in Fornax and the SMC, while a low W(7.5) is found in our Galaxy. The equivalent width of 13.7 m is more affected by spike noise because this molecular feature is weak, and the quality of data in 14.5–15.0 m region is poorer. Nevertheless, Fig. 5 shows that stars in our Galaxy cover the lowest range of 13.7 m equivalent width, W(13.7) in the range [6.4][9.3].
Fig. 6 shows the ratio of SiC excess with respect to the pseudo-continuum (Zijlstra et al., 2006); larger ratios indicate larger SiC excess. A careful positioning of the ‘continuum’ would be required to measure the SiC band strength precisely (Thompson et al., 2006), but we argue that this ratio represents a good estimate of the approximate SiC strength. The ratio is plotted against the infrared colour [6.4][9.3] in Fig. 6. A large SiC excess is found for relatively blue (IR-colour [6.4][9.3]) Galactic stars. Stars in the SMC and Fornax have the lowest SiC excess ratio among any of the samples. Two stars in Fornax show a SiC to continuum ratio of 0.15 at [6.4][9.3], much less than found for Galactic stars with similar colour.

5 Mass-loss rate
Using flux calibrated Spitzer spectra together with infrared photometric data, we derive mass-loss rates for the carbon-rich AGB stars.


| Name | ||||||
|---|---|---|---|---|---|---|
| For 13-23 | 4.92 | 7389 | 4.00 | 4.2 | 20 | 2.2 |
| For 12-4 | 5.54 | 13012 | 2.45 | 4.5 | 25 | 2.4 |
| For 3-129 | 4.97 | 7748 | 8.50 | 6.9 | 16 | |
| For 6-13 | † | 5721† | 1 | 1.3 |
5.1 Modelling the spectral energy distribution
Spectral energy distributions (SEDs) are modeled using the radiative transfer code DUSTY (Ivezić & Elitzur, 1997). The quality of these SED fits with the observations are illustrated in Fig. 7.
A spherical geometry is assumed for the circumstellar envelope, and the circumstellar shells are filled with material from the radiatively driven wind, which is moving at a constant velocity. The photospheric spectrum of the central star is calculated with a hydrostatic model including molecular opacities (Loidl et al., 2001; Groenewegen et al., 2007). An effective temperature of 2800 K is adopted. We also tried a 2650 K spectrum which often worked well for stars in the LMC and SMC (Groenewegen et al., 2007), but this lower temperature did not result in a good fit for the Fornax spectra. This may be a consequence of the difference between the samples from the various galaxies; the LMC and SMC stars have redder colours (Fig. 1). As details of carbon to oxygen ratios are unknown, a C/O ratio of 1.1 is assumed in the hydrostatic model. Although this is typical of values found for Galactic carbon stars, at lower metallicity the C/O ratio may well be higher (Matsuura et al., 2002, 2005). The assumed C/O ratio affects most strongly the depth of molecular bands, and we minimize its impact by concentrating on a relatively featureless wavelength range of the spectra for this particular exercise. Furthermore, the elemental abundances (except for carbon) used by DUSTY modelling are the solar values (Anders & Grevesse, 1989), which are also inappropriate for stars in Fornax. In spite of these limitations, we prefer the hydrostatic model spectra over simple blackbodies (BBs). We compared SED fits using blackbody curves the star and hydrostatic model spectra as a heating input of DUSTY. The simple blackbody requires a lower optical depth to reproduce the SED. For example, Fornax 13-23 and Fornax 3-129 are fitted with 3.0, and 8.25 with BB input, respectively. However, the models with BB input have difficult in fitting near-infrared spectra. The low optical depth required by the BB model is probably a consequence of the lack of molecular absorption, thus the more efficient heating of grains especially at shorter wavelength.
The temperature at the inner radius of the dust shell is assumed to be 1000 K (Groenewegen et al., 2007). Dust grains are a mixture of amorphous carbon (Hanner, 1988) and SiC (Pégourié, 1988). The fractions which give the best fit are 5 % SiC and 95 % amorphous carbon. We also attempted to fit the observed SiC bands with 3 % and 10 % SiC mixtures, but the former does not create any SiC bands at 11 m, while the latter produces SiC bands that are too strong to fit the spectra of our targets. The grain size distribution is assumed to be to 0.25 m according to a power-law distribution of the form with (Mathis et al., 1977). A gas-to-dust ratio of 200 is the default of DUSTY. Although we note that the ratio might be higher at lower metallicity (van Loon, 2000), no dependence has yet been measured. This ratio is important when the optical depth is converted to the mass-loss rate.
The outer radius of the shell is fixed at times the inner radius of the circumstellar shell. Changing the outer radius has minor effects on the SED (van Loon et al., 2003). The DUSTY model fit produces the terminal outflow velocity and mass-loss rate for a luminosity of . As we derive the luminosity by scaling the emerging spectrum from DUSTY, we recalculate the dust mass-loss rate accordingly.
The DUSTY model itself has an uncertainty of 30 % in mass-loss rate and expansion velocity, as noted in the DUSTY manual.
5.2 Results of radiative transfer code fitting
Figs. 7 and 8 shows the DUSTY model fits to the spectra and the parameters used for these fits are listed in Table 4. We use three spectra which show clear SiC excesses to fit the 11.3 m SiC excess and the general shape of the SED. We attempted to fit the other two spectra with negligible SiC excess (Fornax 4-25 and Fornax 6-13) and found that the optical depth at 0.55 m was . The Fornax 4-25 and 6-13 spectra seem to be photospheric in origin, with little circumstellar contribution to the infrared. Integrating over the photometry and the Spitzer spectra of Fornax 6-13, using spline fitting (Zijlstra et al., 2006), we obtained a luminosity of 5721 ; DUSTY fitting gave an upper limit to the mass-loss rate of yr-1. The same spline fitting is adopted for Fornax 4-25, using and Spitzer spectra, resulting in a luminosity of 5621 , but with lower accuracy than for the other targets. An upper limit to the mass-loss rate is yr-1. These photometric observations are not simultaneous with the Spitzer measurements, in contrast to the study by Groenewegen et al. (2007), increasing the uncertainty in the instantaneous luminosities.
There are some features which the DUSTY models do not fit well, in particular the 7.5 m and 13.7 m absorptions due to C2H2. A similar problem was also found in fitting some LMC and SMC AGB spectra (Groenewegen et al., 2007). The C2H2 molecular bands are included in the model for the stellar atmosphere, which is used as an input to DUSTY models, but the observed bands are stronger than predicted. As discussed later, the parameters used in the models are appropriate for Galactic stars, and the metallicity dependence of the molecular band strengths may well contribute to this problem. There could be additional effects, such as some C2H2 originating from the extended atmosphere which is lifted by the pulsation above the photosphere (e.g. Hron et al., 1998; Ohnaka et al., 2007). Circumstellar molecular absorption (e.g. Aoki et al., 1999; Matsuura et al., 2006) is also not included in DUSTY.
The mass-loss rates for the three reddest stars are of the order of . This would be only a moderate mass-loss rate for Galactic carbon stars. The comparison assumes that the gas-to-dust ratio in the Fornax dSph galaxy is the same as in our Galaxy.
The bolometric luminosities estimated from fitting a radiative transfer model are comparable to other estimates, such as those from near-infrared, , colours (Lagadec et al., 2007b). The values range between =3.9 and 4.1, which is comparable to the mean luminosities found for carbon stars in the LMC, but slightly higher than those found for SMC stars (Zijlstra et al., 2006; Buchanan et al., 2006; Lagadec et al., 2007a).
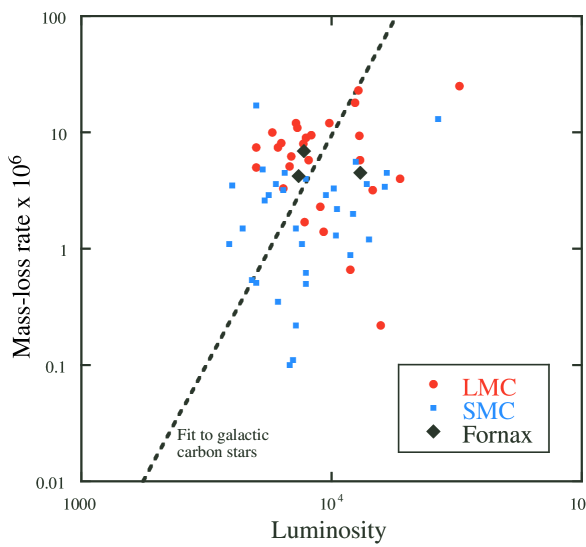
Fig. 9 shows the derived mass-loss rate as a function of luminosity and a comparison with values for LMC and SMC stars (Groenewegen et al., 2007). Little metallicity dependence of the mass-loss rate is found, at least for the dust mass-loss rate. The Fornax mass-loss rates are at the upper end of the SMC mass-loss rates at a given luminosity. However, we are unable to fit the Fornax stars with lower mass-loss rates (Fornax 4-25 & Fornax 6-13), so there is an obvious selection effect. LMC stars appear to reach a higher mass-loss rate than the SMC and Fornax stars at a given luminosity, as noted by Groenewegen et al. (2007).
The assumptions made in deriving the total mass-loss rates are the expansion velocity of the circumstellar shell and the conversion factor from dust mass-loss rate to gas mass-loss rate.
Groenewegen et al. (2007) assumed an expansion velocity of 10 km s-1 for all the stars in their study. The velocity is derived from DUSTY fitting in our work and we find that the Fornax stars have expansion velocities in the 16 to 25 km s-1 range. This gives us larger mass-loss rates for the Fornax stars by a factor of up to 2.5 over those obtained from the Groenewegen et al. (2007) assumption. Nevertheless, in the log scale of Fig. 9, this is a minor effect.
The gas-to-dust mass ratio is assumed to be 200 in both this work and by Groenewegen et al. (2007). This ratio may have a metallicity dependence, and van Loon (2000) estimates [Z/H] for carbon stars, where is the gas-to-dust ratio. If this is correct, the gas-to-dust ratio in Fornax will be about twice what it is in the SMC and the Fornax stars will have higher gas mass-loss rates than derived above. We discuss this further below (Sect. 6.2).
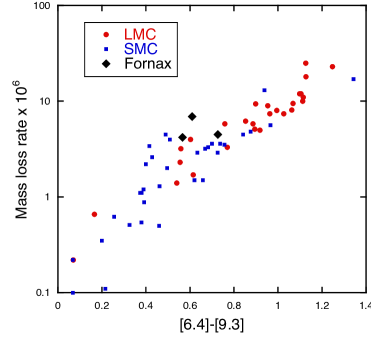
Fig. 10 shows the mass-loss rate as a function of infrared colour. The wavelength bands are defined so as to avoid major molecular or dust features, thus the colour measures the ‘continuum’ spectrum reasonably well. In Fig. 10, a correlation is found between the infrared colour and the mass-loss rate. As mentioned in Groenewegen et al. (2007), this colour gives the approximate mass-loss rate with a factor of two to five uncertainty, depending on the colour.
5.3 A comparison with IR colour method
Lagadec et al. (2007b) estimated the dust mass-loss rate of two of the sources in our sample, using the infrared colour index . Their dust mass-loss rates have been converted to gas mass-loss rates assuming a gas-to-dust ratio of 200 and are listed in Table 4; they are consistent with our estimates to within a factor of two. At least some of the difference will be due to the input stellar spectra, i.e., our work uses a hydrostatic model while Lagadec et al. (2007b) assume a blackbody. Nevertheless, the consistency shows that the infrared colour method can be used to estimate the mass-loss rates, as found for Galactic AGB stars (Whitelock et al., 1994; Le Bertre, 1997).
The mid-infrared colour also shows a correlation with mass-loss rate (Fig. 10), especially when using colours that minimize the influence of strong molecular bands. Note that unlike some colour measurements, e.g. , our values are constructed from spectra and are therefore simultaneous and not affected by variability.
6 Discussion
6.1 Luminosity of carbon stars
The carbon stars in the Fornax dSph galaxy tend to have fainter absolute magnitudes at a given colour (Fig. 1) than LMC carbon stars. Demers et al. (2002) pointed out that the mean magnitudes of carbon-rich stars at the tip of the AGB are mag and mag for the LMC and SMC, respectively, while the mean magnitude of 26 carbon stars in Fornax gives mag. The difference between the LMC and SMC samples was also discussed in Lagadec et al. (Fig. 2; 2007a). Demers et al. (2002) concluded that the low is due to the lack of younger (0.3–1 Gyr) carbon stars in Fornax. The population analysis by Battaglia et al. (2006) also supports this interpretation; the star formation rate declined during the period from a few hundred Gyr to 1 Gyr ago, so we are unlikely to find young (0.3–1 Gyr) carbon stars in Fornax. In other words, AGB stars in the Fornax dSph Galaxy are, on average, probably older than those found in the LMC and the SMC.
6.2 Metallicity dependence of mass-loss rates
The ratio of SiC to continuum is smaller in Fornax stars than in our Galaxy or in the LMC, but comparable to that in the SMC. The Fornax spectra are well fitted if the mixture of dust grains is 5 % SiC and 95 % amorphous carbon, although the error in our estimate is large. As Groenewegen et al. (2007) found, the fraction of SiC dust grains is lower in carbon stars in the LMC and SMC than those in our Galaxy (10 %; e.g. Groenewegen (1995)). Stars in the Fornax dSph galaxy follow this same trend with metallicity.
The fraction of SiC dust in the grains is probably correlated with the silicon elemental abundance in the atmospheres of carbon stars. The temperature in the helium burning shell does not become high enough for -captures on magnesium, and the abundance of 28Si can be assumed to be unchanged during the AGB phase. The abundance of silicon has been measured in two red-giants in the Fornax dSph galaxy (Shetrone et al., 2003). They find silicon abundances in metal poor stars higher than implied by a simple scaling from the metallicity as represented by [Fe/H]. These two stars have approximately 5 and 25 % of the solar silicon abundance ([Si/H] = and ), while their iron abundances are [Fe/H] = and . Thus, the metal-poor star shows a silicon abundance excess, presumably due to the detailed history of its formation (Shetrone et al., 2003).
A mass fraction of 5% SiC grains and a gas-to-dust ratio of 200 in mass, implies that 25% of the silicon atoms are in the dust, if the envelope has a solar metallicity. Here we assume the solar abundance of silicate is 7.55, on a scale of log N(H)=12. For [Si/H] = , all silicon atoms would need to be in the SiC dust grains. We expect our stars to have somewhat lower metallicity, corresponding to the peak of the stellar metallicity distribution, say [Fe/H] and the silicon abundance ([Si/H]) could be . Inverting the estimation, the gas-to-dust ratio needs to be or larger, to account for the SiC mass fraction of 5%. If we consider the uncertainty in this estimate of the SiC fraction, then the gas-to-dust ratio must be in the range 800 to 240 to provide a fraction of 10 % to 3% of the dust as SiC. This may be the first, albeit indirect, indication for a higher gas-to-dust ratio at significantly sub-solar metallicity. If it is correct, then the mass-loss rates in AGB stars at these low metallicities could be even higher than values given in Table 4. The uncertainty in the gas-to-dust ratio discussed here largely depends on the uncertainty of our estimated SiC fraction. Various parameters, but particularly the optical constants of the dust grains and the dust grain size distribution, require refinement if further progress is to be made. Furthermore, the exact compositions mixed in with the SiC dust grains (Heck et al., 2007) might change towards lower metallicity, resulting in different SiC dust masses. Although it is possible that the gas-to-dust ratio increases at lower metallicity the actual values remain very uncertain. Due to these uncertainties, we continue to assume that the gas-to-dust ratio is 200 for the remaining discussion.
The dust mass is dominated by amorphous carbon. The quantity of amorphous carbon grains is affected by two factors, viz. C/O ratio (Habing et al., 1994) and initial metallicity (Zuckerman & Dyck, 1989; van Loon, 2000; Wahlin et al., 2006). The lack of evidence for lower mass-loss rates at lower metallicity is explained with a higher C/O ratio towards low metallicity. A strong dependence of mass-loss rate on C/O ratio is reported from hydrodynamical models for carbon-rich stars (Mattsson et al., 2007). This is a consequence of the stability of the CO molecule; in carbon stars all available oxygen atoms are locked into carbon monoxide and excess carbon atoms are available to form carbon-bearing molecules and amorphous carbon dust grains. As new carbon atoms reach the surface of these AGB stars, the C/O ratio increases and the amount of carbon available to form grains also increases. The C/O abundance of the target stars in the LMC, the SMC and Fornax have not been measured directly. A number of carbon stars in the SMC have C/O ratios of 1.05 to 1.1 (de Laverny et al., 2006). That sample probably contains blue carbon stars, which have little or no circumstellar envelope. The C/O ratio increases towards the end of the AGB phase, but such stars develop a thick circumstellar envelope and hydrostatic models cannot be used for them, because the molecular lines are filled in by emission from circumstellar dust grains. C/O ratios above 2 are found in LMC and SMC PNe (Leisy & Dennefeld, 1996; Stanghellini et al., 2005). At metallicities below those of the SMC and LMC, the final C/O ratios are expected to be even higher due to low initial oxygen abundance, and an additional effect of efficient third-dredge up (Vassiliadis & Wood, 1993; Marigo et al., 2003; Izzard et al., 2004). The C/O ratios of our targets are therefore likely to significantly exceed 1.1, leading to the observed efficient amorphous dust production.
This result i.e., the lack of dependence of mass-loss rates on metallicity for carbon-rich stars, is in contrast to what is found for oxygen-rich stars, where there is an obvious metallicity dependence (Wood et al., 1992). This is because dust driven winds in oxygen-rich stars are dominated by the amount of silicate, and ultimately by the intrinsic silicon elemental abundance (Bowen & Willson, 1991; Willson , 2006). The expansion velocities of oxygen-rich shells are also smaller at low metallicities (Wood et al., 1992; Zijlstra et al., 1996; Marshall et al., 2004). In contrast, carbon stars are strongly affected by carbon production during the AGB phase; thus the different dependence of mass-loss rate on metallicity can be understood.
6.3 Metallicity dependence of molecular bands
The molecular band strengths of carbon-rich stars show a metallicity dependence (Cohen et al., 1981; van Loon et al., 1999; Matsuura et al., 2002). Recent studies using infrared spectrometers on the Very Large Telescope (Matsuura et al., 2005; van Loon et al., 2006) showed that the C2H2 equivalent widths increase towards lower metallicity, based on samples from the Galaxy, the LMC and the SMC.
The carbon-rich stars in the Fornax dSph galaxy follow the same trend of as those found in similar SMC stars. For infrared colours [6.4][9.3]0.5, the largest C2H2 equivalent widths are found for stars in the SMC and the Fornax dSph galaxy. Although Fornax has a lower metallicity than the SMC, no further metallicity dependence is seen below the SMC value.
As discussed in the previous section, a higher C/O ratio is likely in carbon-rich stars at lower metallicity. C2H2 formation relies on excess carbon atoms after all oxygen atoms are locked into carbon monoxide. Thus the higher C/O ratio results in the higher abundance of C2H2 at lower metallicity (Matsuura et al., 2005). Fig. 13 in Matsuura et al. (2005) shows that the fraction of C2H2 in the atmosphere increases drastically up to C/O , but at ratios higher than this the amount of C2H2 increases only slowly. This is because C2H2 is reactive with carbon resulting in increasingly larger carbon bearing molecules. Thus, below the SMC metallicity, little metallicity dependence of the C2H2 equivalent width is found, because this molecular abundance becomes insensitive to the C/O ratio.
C2H2 is thought to be a parent molecule in the formation of PAHs, as indicated by chemical models (Allamandola et al., 1989). It is still unknown whether PAHs are formed during the AGB phase or afterwards. They may already form in the atmospheres or inner circumstellar envelopes of carbon-rich AGB stars, where the gas density is reasonably high and chemical reactions occur easily (Frenklach & Feigelson, 1989). The non-detection of PAHs from AGB stars might be due to a lack of UV radiation, which is probably required to excite PAHs. PAHs might be photon-processed during post-AGB evolution (Sloan et al., 2007). Alternatively, PAHs may be formed during the post-AGB or proto-planetary nebula phase, where PAHs are commonly found. The chemistry in this phase is dominated by strong radiation from the central star (Woods et al., 2002, 2003). If PAHs are indeed formed during the AGB phase, an over-abundance of C2H2 in a low metal environment will affect the growth of these important molecules.
The overabundance of C2H2 at low metallicity will remain through the post-AGB phase, as is illustrated by the fact that the LMC post-AGB star SMP 11 has more abundant carbon-bearing molecules (Bernard-Salas et al., 2006) than comparable Galactic post-AGB stars (Cernicharo et al., 2001). Reyniers et al. (2007) suggested a lower limit of C/O = 2 for one LMC post-AGB star. This overabundance of C2H2 may also occur in an SMC post-AGB star (Kraemer et al., 2006). Thus, at sub-solar metallicity, it is likely that C2H2 molecules are abundant in carbon-rich evolved stars.
6.4 Gas supply from AGB stars to the ISM of the Fornax dSph galaxy
From near-infrared colours, Gullieuszik et al. (2007) found about 100 AGB candidates in the centre (18.518.5 arcmin-1) of the Fornax dSph galaxy. Their infrared colours suggest that at least 20 of these AGB stars are carbon-rich ( and 14 mag) (e.g. Cioni & Habing, 2003). The reddest carbon stars found by Gullieuszik et al. (2007) have mag. An estimate of mass-loss rate can be obtained from the colors of these 20 AGB stars of the order of yr-1 or less, although this number is not very precise owing to the large dispersion of the vs mass-loss rate relation found by (Le Bertre, 1997). Including our carbon stars, the total mass-loss rate from known carbon-rich stars in Fornax dSph galaxy is estimated to be about yr-1 at most, adopting a gas-to-dust ratio of 200. Three stars in our sample (Fornax 13-23, 12-4, 3-129) contribute more than two thirds of the total mass-loss rate. Studies of Galactic AGB stars showed that stars with higher mass-loss rates (above yr-1) dominate the total gas output from AGB stars (Le Bertre, 2001). Therefore the much bluer AGB stars in Fornax are assumed to contribute very little to the total mass lost from the entire AGB population.
This total mass-loss rate is smaller than the value found for Wolf Lundmark Melotte (WLM), a dwarf irregular galaxy in the Local Group with a similar metallicity range to Fornax. Jackson et al. (2007) estimated the total mass-loss rate from AGB stars as [0.7–2.4] yr-1, which is a factor of 50 larger in WLM than the Fornax dSph galaxy. The number ratio of carbon- to oxygen-rich stars is reported to be 12 in WLM (Battinelli et al., 2003); thus the mass-loss rate from carbon-rich stars is almost identical to that from the entire AGB population. The visual absolute magnitudes () of the galaxies are and for WLM and Fornax, respectively. If is a measure of the number of stars in a galaxy, WLM has a 2 to 3 times larger the number of stars than Fornax has; the number of stars in the galaxies is insufficient to explain the difference in total mass-loss rate from carbon-rich stars. The assumed gas-to-dust ratio is a factor of 6 to 13 larger in Jackson et al. (2007), but still not sufficient to explain the result. The difference might be caused by the presence of younger stars in WLM, and the absence of such stars in Fornax. In WLM, a recent increase in star formation rate is indicated starting 1–2.5 Gyr ago (Hodge & Miller , 1995). Young ( Gyr) carbon stars dominate the mass output from AGB stars (e.g. Le Bertre, 2001), and this population is missing in the Fornax dSph galaxy.
As a dwarf irregular galaxy, WLM has a much larger Hi mass than the Fornax dSph: 40% of its total mass compared to for Fornax (Mateo, 1998). A removal of gas from dSph in early phase is a consequence of this that difference (Grebel et al., 2003). However, the feedback from the young AGB stars also accentuates the difference in gaseous contents, on top of the influence of the galaxy’s initial gas content.
6.5 Period of Fornax 4-15
The absolute magnitude of Fornax 4-25 is estimated as mag, using the magnitude and colour dependent bolometric correction (Whitelock et al., 2006). The period-luminosity relation for Galactic carbon stars (Whitelock et al., 2006) gives , where is the period in days, for this luminosity. The observed period of Fornax 4-15 is (Demers & Irwin, 1987), thus this Fornax star fits on the period-luminosity relation for Galactic stars very well. No obvious metallicity dependence has been found for the AGB period-luminosity relation. This period and mass-loss rate relation for galactic star gives mass-loss rate of yr-1 at . This mass-loss rate is consistent with the upper limit ( yr-1) obtained by this work is consistent.
7 Conclusions
The 5–14 m spectra of AGB stars in the Fornax dSph galaxy confirm the prevalence of carbon-rich stars at low metallicity ([Fe/H]). Stars with show spectra dominated by C2H2 molecules, together with CO bands and SiC dust excess, while only a trace of the 7.5 m C2H2 is found in stars with . Detection of the SiC dust excess shows that these AGB stars have developed circumstellar envelopes through mass loss.
We compare our results for Fornax with carbon-rich stars in our own Galaxy, the LMC and the SMC. The Fornax dSph galaxy is the lowest metallicity galaxy for which the carbon-rich star population has been studied in the mid-infrared. The C2H2 molecular bands, with respect to the infrared colour, tend to be stronger towards lower metallicity. No reduction in the mass-loss rate is found for lower-metallicity carbon stars. The dust composition does depend on the metallicity, with a lower mass-fraction of SiC dust grains, but the amount of amorphous carbon, which constitutes the dominant fraction of dust grains, seem to be unchanged. If the fraction of SiC dust grain is correct, the gas-to-dust ratio could be as high as 400 at one tenth of the solar metallicity, but a more detailed investigation of gas mass-loss rates is required. This study of AGB mass loss in a low-metallicity environment should be broadly useful for other studies of dust and gas recycling within metal poor galaxies.
Our study reveals that the gas supply from AGB stars into the interstellar medium is not lower at lower metallicity, but the fraction of SiC dust grains does appear to be lower. The total amount of gas expelled from AGB stars is less in the Fornax dSph galaxy than in the dwarf irregular WLM, in spite of a similar total mass and metallicity. The difference is attributed to the younger stellar population in WLM.
8 acknowledgments
M.M. thanks Prof. Arimoto for discussion about populations in Fornax dSph galaxy. M.M. is a JSPS fellow.
References
- Aaronson & Mould (1980) Aaronson, M., Mould, J., 1980, ApJ 240, 804
- Allamandola et al. (1989) Allamandola L.J., Tielens G.G.M., Barker J.R., 1989, ApJS 71, 733
- Anders & Grevesse (1989) Anders, E., & Grevesse, N., 1989, Geochimica et Cosmochimica Acta 53, 197
- Aoki et al. (1999) Aoki W., Tsuji T., Ohnaka K., 1999, A&A 350, 945
- Azzopardi (1999) Azzopardi M., Muratorio G., Breysacher J., Westerlund B. E., 1999, The stellar content of Local Group galaxies, Proceedings of the 192nd IAU Symp., San Francisco, CA: Astronomical Society of the Pacific (ASP), San Francisco 1999, Edited by P. Whitelock and R. Cannon, p.144
- Battaglia et al. (2006) Battaglia G., Tolstoy E., Helmi A., et al., 2006, A&A 459, 423
- Battinelli et al. (2003) Battinelli P., Demers S., Letarte B. 2003, AJ, 125, 1298
- Bernard-Salas et al. (2006) Bernard-Salas J., Peeters E., Sloan G.C., Cami J., Guiles S., Houck J.R., 2006, ApJ 652, L29
- Bertelli et al. (1994) Bertelli G., Bressan A., Chiosi C., Fagotto F., Nasi E., 1994, A&AS 106, 275
- Bouchard et al. (2006) Bouchard A., Carignan C., Staveley-Smith L., 2006, AJ 131, 2913
- Bowen & Willson (1991) Bowen G.H. & Willson L.A., 1991, ApJ 375, L53
- Busso et al. (2007) Busso M., Guandalini R., Persi P., Corcione L., Ferrari-Toniolo, M., 2007, AJ 133, 2310
- Buchanan et al. (2006) Buchanan C.L., Kastner J.H., Forrest W.J., Hrivnak B.J., Sahai R., Egan M., Frank A., Barnbaum C., 2006, AJ 132, 1890
- Cernicharo et al. (2001) Cernicharo J., Heras A.M., Pardo J.R., Tielens A.G.G.M., Guélin M., Dartois E., Neri R., Waters L.B.F.M., 2001, ApJ, 546, L127
- Cioni et al. (2001) Cioni M.-R.L., Marquette J.-B., Loup C., Azzopardi M., Habing H.J., Lasserre T., Lesquoy E., 2001, A&A 377, 945
- Cioni & Habing (2003) Cioni M.-R.L., Habing H.J., 2003 A&A 402, 133
- Cohen et al. (1981) Cohen J.G, Persson S.E., Elias J.H., Frogel J.A., 1981, ApJ 249, 481
- Cohen et al. (2003) Cohen M., Wheaton Wm.A., Megeath S. T., 2003, AJ 126, 1090
- Cole et al. (2005) Cole A.A.; Tolstoy E., Gallagher J.S. III, Smecker-Hane T.A., 2005 AJ, 129, 1465
- de Laverny et al. (2006) de Laverny P., Abia C., Domínguez I., Plez B., Straniero O., Wahlin R., Eriksson K., Jorgensen U.G., 2006, A&A 446, 1107
- Demers & Irwin (1987) Demers S., Irwin M.J., 1987, MNRAS 226, 943
- Demers & Kunkel (1979) Demers S., Kunkel W.E., 1979, PASP 91, 761
- Demers et al. (1990) Demers S., Grondin L., Kunkel W.E., 1990, PASP 102, 632
- Demers et al. (2002) Demers, S., Dallaire, M., Battinelli, P., 2002, AJ 123, 3428
- Dwek (1998) Dwek E., 1998, ApJ 501, 643
- Frenklach & Feigelson (1989) Frenklach M., Feigelson E.D., 1989, ApJ 341, 372
- Frogel et al. (1982) Frogel, J.A., Blanco, V.M., Cohen, J.G., McCarthy, M.F., 1982, ApJ 252, 133
- Glass & Nagata (2000) Glass I.S., Nagata T., 2000, MNSSA 59, 110
- Grebel et al. (2003) Grebel E.K., Gallagher J.S., III Harbeck D., 2003, AJ 125, 1926
- Groenewegen (1995) Groenewegen M.A.T., 1995, A&A 293, 463
- Groenewegen (1998) Groenewegen M.A.T., Whitelock P.A., Smith C.H., Kerschbaum F., 1998, MNRAS 293, 18
- Groenewegen et al. (2007) Groenewegen M.A.T., Wood P.R., Sloan G.C., et al., 2007 MNRAS, 376, 313
- Gullieuszik et al. (2007) Gullieuszik M., Held E.V., Rizzi L., Saviane I., Momany Y., Ortolani S., 2007, A&A, 467, 1025
- Habing et al. (1994) Habing H.J., Tignon J., Tielens A.G.G.M., 1994, A&A 286, 523
- Hanner (1988) Hanner, M.S. 1988, NASA Conf. Pub. 3004, 22
- Heck et al. (2007) Heck P.R., Marhas K.K., Hoppe P., Gallino R., Baur H., Wieler R., 2007, ApJ 656, 1208
- Hodge & Miller (1995) Hodge P., Miller B.W., 1995, ApJ 451, 176
- Houck et al. (2004) Houck J.R., Roellig T.L., van Cleve J., et al., 2004, ApJS 154, 18
- Hron et al. (1998) Hron J., Loidl R., Höfner S., Jorgensen U.G, Aringer B., Kerschbaum F., 1998, A&A 335, L69
- Irwin & Hatzidimitriou (1995) Irwin M., Hatzidimitriou D., 1995, MNRAS 277, 1354,
- Ivezić & Elitzur (1995) Ivezić Z., Elitzur M., 1995, ApJ 445, 415
- Ivezić & Elitzur (1997) Ivezić Z., Elitzur M., 1997, MNRAS 287, 799
- Izzard et al. (2004) Izzard R.G., Tout C.A., Karakas A.I., Pols, O.R., 2004, MNRAS 350, 407
- Jackson et al. (2007) Jackson D.C., Skillman E.D., Gehrz R.D., Polomski E., Woodward C.E., 2007, ApJ 656, 818
- Jørgensen et al. (2000) Jørgensen U.G., Hron J., Loidl R., 2000, A&A 356, 253
- Kniazev et al. (2007) Kniazev A.Y., Grebel E.K., Pustilnik S.A., Pramskij A.G., 2007, A&A 468, 121
- Kraemer et al. (2006) Kraemer K.E., Sloan G.C., Bernard-Salas J., Price S.D., Egan M.P., Wood P.R., 2006, ApJ 652, L25
- Lagadec et al. (2007a) Lagadec E., Zijlstra A.A., Sloan G.C., et al. 2007a, MNRAS 376, 1270
- Lagadec et al. (2007b) Lagadec E., Zijlstra A.A., Matsuura M., et al. 2007b, submitted to MNRAS
- Lattanzio & Forestini (1999) Lattanzio, J. & Forestini, M. 1999, in IAU Symp. 191, Asymptotic Giant Branch Stars, ed. T. Le Bertre, A. Lèbre, & C. Waelkens (ASP), p. 31
- Le Bertre (1997) Le Bertre T., 1997, A&A 324, 1059
- Le Bertre (2001) Le Bertre T., Matsuura M., Winters J.M., Murakami H., Yamamura I., Freund M., Tanaka M., 2001, A&A 376, 997
- Leisy & Dennefeld (1996) Leisy, P., & Dennefeld, M., 1996, A&AS 116, 95
- Loidl et al. (2001) Loidl R., Lançon A., Jorgensen U.G, 2001, A&A 371, 1065
- Maeder (1992) Maeder, A. 1992, A&A, 264, 105
- Marigo et al. (2003) Marigo P., Girardi L., Chiosi C., 2003, A&A 403, 225
- Marshall et al. (2004) Marshall J.R., van Loon J.Th., Matsuura M., Wood P.R., Zijlstra A.A., Whitelock P.A. 2004, MNRAS 355, 1348
- Mateo (1998) Mateo M.L., 1998, ARA&A 36, 435
- Mathis et al. (1977) Mathis J.S., Rumpl W., Nordsieck K.H., 1977, ApJ 217, 425
- Matsuura et al. (2002) Matsuura M., Zijlstra A.A., van Loon J.Th., Yamamura I., Markwick A.J., Woods P.M., Waters L.B.F.M., 2002, ApJ 580, L133
- Matsuura et al. (2005) Matsuura M., Zijlstra A.A., van Loon J.Th., et al., 2005 A&A 434, 691
- Matsuura et al. (2006) Matsuura M., Wood P.R., Sloan G.C. et al., 2006, MNRAS 371, 415
- Mattsson et al. (2007) Mattsson L., Wahlin R., Höfner S., 2007 Proceedings of IAU Symp 241, ed. A. Vazdekis et al. (astro-ph/07052809)
- Menzies et al. (2002) Menzies J., Feast M.,Tanabé T., Whitelock P., Nakada Y., 2002, MNRAS 335, 923
- Menzies et al. (2007) Menzies in preparation
- Ohnaka et al. (2007) Ohnaka K., Driebe T., Weigelt G., Wittkowski M., 2007, A&A 466, 1099
- Pégourié (1988) Pégourié, B. 1988, A&A, 194, 335
- Pont et al. (2004) Pont F., Zinn R., Gallart C., Hardy E., Winnick R., 2004, AJ 127, 840
- Reyniers et al. (2007) Reyniers M., Abia C., van Winckel H., Lloyd Evans T., Decin L., Eriksson K., Pollard K.R., 2007, A&A 461, 641
- Saviane et al. (2000) Saviane, I., Held, E.V., Bertelli, G., 2000, A&A 355, 56
- Shetrone et al. (2003) Shetrone M., Venn K.A., Tolstoy E., Primas F., Hill V., Kaufer A., 2003, AJ 125, 684
- Skrutskie et al. (2006) Skrutskie M.F., Cutri R.M., Stiening R., et al., 2006, AJ 131, 1163
- Smith & Lambert (1989) Smith V.V., Lambert D.L., 1989, ApJ 345, L75
- Sloan et al. (2003) Sloan G.C., Kraemer K.E., Price S.D., Shipman R.F., 2003, ApJS 147, 379
- Sloan et al. (2006) Sloan G.C., Kraemer K.E., Matsuura M., et al. 2006, ApJ 645, 1118
- Sloan et al. (2007) Sloan G.C., Jura M., Duley, W.W., et al., 2007, ApJ 664, 1144
- Stanghellini et al. (2005) Stanghellini L., Shaw R.A., Gilmore D., 2005, ApJ, 622, 294
- Strader et al. (2003) Strader J., Brodie J.P., Forbes D.A., Beasley M.A., Huchra J.P., 2003, AJ 125, 1291
- Thompson et al. (2006) Thompson G.D., Corman A.B. Speck A.K., Dijkstra C., 2006, ApJ 652, 1654
- Tolstoy et al. (2001) Tolstoy E., Irwin M.J., Cole A.A., Pasquini L., Gilmozzi R., Gallagher J.S., 2001, MNRAS 327, 918
- Tolstoy et al. (2003) Tolstoy E., Venn K.A., Shetrone M., Primas F., Hill V., Kaufer A., Szeifert T., 2003, AJ 125, 707
- van den Bergh (1999) van den Bergh S., 1999, ‘ The Galaxies of the Local Group’, Cambridge Astrophysics Series 35
- Van der Bliek (2000) van der Bliek N.S., Manfroid J., Bouchet P., 1996, A&A 119, 547
- van Loon et al. (1999) van Loon J.Th., Zijlstra A.A., & Groenewegen M.A.T., 1999, A&A, 346, 805
- van Loon (2000) van Loon J.Th., 2000 A&A 354, 125
- van Loon et al. (2003) van Loon J.Th., Marshall J.R., Matsuura M., Zijlstra A.A., 2003, MNRAS 341, 1205
- van Loon et al. (2006) van Loon J.Th., Marshall J.R., Cohen M., Matsuura M., Wood P.R., Yamamura I., Zijlstra A.A., 2006, A&A 447, 971
- Vassiliadis & Wood (1993) Vassiliadis, E. & Wood, P.R. 1993, ApJ, 413, 641
- Wahlin et al. (2006) Wahlin R., Eriksson K., Gustafsson B., Hinkle K.H., Lambert D.L., Ryde N., Westerlund B., 2006, Memorie della Societa Astronomica Italiana, v.77, p.955
- Werner et al. (2004) Werner M.W. et al., 2004, ApJS 154, 1
- Westerlund et al. (1987) Westerlund, B. E., Edvardsson, B., Lundgren, K., 1987, A&A 178, 41
- Whitelock et al. (1994) Whitelock P., Menzies J., Feast M., Marang F., Carter B., Roberts G., Catchpole R., Chapman, J., 1994, MNRAS 267, 711
- Whitelock et al. (2006) Whitelock P.A., Feast M.W., Marang F., Groenewegen M.A.T., 2006, MNRAS 369, 751
- Willson (2006) Willson L.A., 2006, Planetary nebulae beyond the Milky Way, Proceedings of the ESO workshop held in Garching, Germany, 19-21 May 2004, Edited by Letizia Stanghellini, J. R. Walsh, and N.G. Douglas, Berlin, Springer, 2006, p.99
- Wood et al. (1992) Wood P.R., Whiteoak J.B., Hughes S.M.G., Bessell M.S., Gardner F.F., Hyland A.R., 1992, ApJ 397, 552
- Wood et al. (2007) Wood P.R., Groenewegen M.A.T., Sloan G.C., Blommaert J.A.D.L., Cioni M.-R.L., Feast M.W., Habing H.J., Sony S., Lagadec E., AGB Vienna
- Woods et al. (2002) Woods P.M., Millar T.J., Zijlstra A.A., Herbst E., 2002, ApJ Letters, 574, L167
- Woods et al. (2003) Woods P.M., Millar T.J., Herbst E., Zijlstra A.A., 2003, A&A 402, 189
- Yamamura et al. (1997) Yamamura I., de Jong T., Justtanont K., Cami J., Waters, L.B.F.M., 1997, Ap&SS 255, 351
- Young (1999) Young L.M., 1999, AJ 117, 1758
- Zijlstra et al. (1996) Zijlstra A.A., Loup C., Waters L.B.F.M., Whitelock P.A., van Loon J.Th., Guglielmo F. 1996, MNRAS 279, 32
- Zijlstra et al. (2006) Zijlstra A.A., Matsuura M., Wood P.R., et al., 2006, MNRAS 370, 1961
- Zuckerman & Dyck (1989) Zuckerman B., Dyck H.M., 1989, A&A 209, 119