Temperature fluctuations of interstellar dust grains
Abstract
The temperatures of interstellar dust grains are analyzed using stochastic simulations, taking into account the grain composition and size and the discreteness of the photon flux. Grains of radii smaller than about 0.02 m are found to exhibit large temperature fluctuations with narrow spikes following the absorption of UV photons. The temperatures of such grains may rise by a few 10 K for very short times, but they do not rise above 80 K even for irradiation field intensities of photon dominated regions. The distribution of grain temperatures is calculated for a broad range of grain sizes and for different intensities of the interstellar radiation field, relevant to diffuse clouds and to photon dominated regions. The dependence of the average grain temperature on its size is shown for different irradiation intensities. It is found that the average temperatures of grains with radii smaller than about 0.02 m are reduced due to the fluctuations. The average temperatures of grains of radii larger than about 0.35 m are also slightly reduced due to their more efficient emission of infrared radiation, particularly when exposed to high irradiation intensities. The average temperatures of silicate and carbonaceous grains are found to depend on the radiation field intensity according to , where the exponent depends on the grain size and composition. This fitting formula is expected to be useful in simulations of interstellar processes, and can replace commonly used approximations which do not account for the grain temperature fluctuations and for the detailed properties of interstellar dust particles. The implications of the results on molecular hydrogen formation are also discussed. It is concluded that grain-temperature fluctuations tend to reduce the formation rate of molecular hydrogen, and cannot account for the observations of H2 in photon-dominated regions, even in the presence of chemisorption sites.
keywords:
ISM: dust, extinction1 Introduction
Interstellar dust grains, which consist of silicates and carbonaceous materials, account for about 1% of the mass of interstellar clouds. The grains play an important role in processes in the interstellar medium (ISM), such as the absorption of UV radiation, emission of infrared radiation and heating of the surrounding gas through the photoelectric effect, which leads to the emission of energetic electrons. Catalytic processes on grain surfaces give rise to the formation of molecular hydrogen (Gould & Salpeter, 1963; Hollenbach & Salpeter, 1971; Hollenbach, Werner & Salpeter, 1971) and other molecules (Hasegawa, Herbst & Leung, 1992). Dust grains also take part in the dynamics of interstellar clouds through their role in coupling the magnetic field to the gas in regions of low fractional ionization and through their transferring of radiation pressure into the gas (Draine, 2003). Many of these processes depend directly or indirectly on various properties of the grains, such as their temperature and charge. These, in turn, depend on both the macro-conditions, namely the radiation flux and the gas environment, and the microphysics of the grains namely their composition and structure. Thus, the evolution of interstellar clouds involves a complex network of physical and chemical processes and feedback mechanisms. Large scale simulations are required in order to combine all the known processes and to draw the macro-physical picture (van Hoof, 2004; Le Petit et al., 2006). An important ingredient of interstellar processes is the temperature of dust grains and its dependence on the interstellar conditions. Processes such as infrared emission from the grains and gas-grain heating directly affect the grain temperatures. Other processes such as the formation of H2 and other molecules on grain surfaces are highly sensitive to the grain temperatures.
In this paper we calculate the temperatures of interstellar dust grains and their dependence on the radiation field and on the compositions and sizes of the grains. To this end we perform simulations of stochastic heating and radiative cooling, taking into account the discrete nature of the UV photons. We find that grains of radii smaller than 0.2 m exhibit large temperature fluctuations. Such small grains exhibit skewed temperature distributions, where most of the time they are colder than large grains exposed to similar radiation intensity, but occasionally they experience a sharp temperature spike.
The paper is organized as follows. In section 2, we briefly review the physical properties of the radiation field in different interstellar environments. Previous studies of interstellar grain temperatures are reviewed in section 3. The methods used in our stochastic simulations are described in section 4. The results are presented in section 5, followed by a discussion in section 6 and a summary in section 7.
2 The Interstellar Radiation Field
The interstellar radiation field is defined as the average radiation field between stars. There is a widely accepted approximation for the typical spectrum of the radiation field, proposed by Mathis, Mezger & Panagia (1983). Within this approximation, the energy density (eV cm-3 m-1) of the ambient radiation vs. the wavelength is given by
| (1) |
where is the enhancement of the starlight component relative to the solar neighborhood (Habing, 1968; Mathis, Mezger & Panagia, 1983) and (cm s-1) is the speed of light. The term accounts for the UV component of the solar neighborhood. Its explicit form is given in Mezger, Mathis & Panagia (1983). The parameters are , , , K, K and K, while K is the temperature of the cosmic background radiation. The function is the Planck distribution for black-body radiation at temperature (K) given by
| (2) |
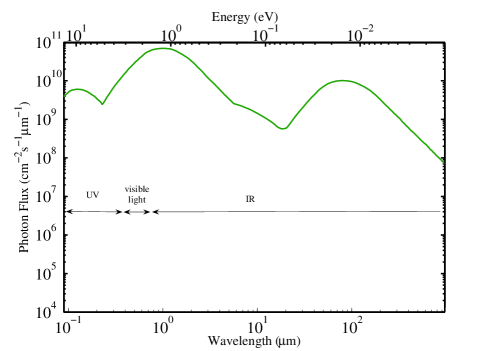
where (eV s) is the Planck constant. The photon flux (photons cm-2 s-1 m-1), obtained from Eq. (2) for , is shown in Fig. 1, for the relevant range of wavelengths m (or photon energies in the range eV). Photons that are more energetic than eV are suppressed inside the cloud because they ionize hydrogen atoms on the edge of the cloud and cannot penetrate further.
3 Dust-grain temperatures
Information on the properties of interstellar dust grains is obtained from spectroscopic observations of the extinction, scattering and emission of electromagnetic radiation by these grains. Such observations show that the grains consist of silicate and carbonaceous materials. Silicate grains consist of (MgxFe1-x)2SiO4, where . Carbonaceous grains include crystalline graphitic carbon, amorphous carbon and polycyclic aromatic hydrocarbons (PAHs). In cold molecular clouds the grains are coated by ice mantles. However, here we focus on bare silicate and carbon grains, relevant to diffuse clouds and photon-dominated regions.
The size distribution of interstellar dust grains follows an approximate power law of the form , where is the grain radius, (cm-3) is the density of grains smaller than and . Such distribution, between suitable cutoffs , was shown to reproduce the observed extinction curve (Mathis, Rumpl & Nordsieck, 1977). Later work by Draine & Lee (1984) provided further evidence for the model. However a more recent study by Weingartner & Draine (2001) has shown that a range of different size distributions exist compatible with observations of different regions in the Milky Way, the LMC and the SMC galaxies.
The temperatures of interstellar dust grains depend on the heating and cooling processes due to the interaction of these grains with the radiation fields and the surrounding gas. These processes include the absorption and emission of electromagnetic radiation, gas-grain collisions, heating by cosmic rays and surface reactions. In most interstellar environments, the grain heating and cooling processes are dominated by absorption and emission of radiation. Gas-grain collisions strongly affect grain temperatures only in dense regions where the rate of such collisions is high (Spitzer, 1978). Chemical reactions affect the grain temperatures in very cold dense regions in the cores of molecular clouds.
Dust grain temperatures have been studied for many years. DeHulst (1949) estimated the temperature of dielectric particles to be K. Detailed calculations of the temperatures of grains of different compositions in different radiation fields were done by Greenberg (1971). Later, a graphite-silicate model was proposed by Mathis, Rumpl & Nordsieck (1977).
The temperature fluctuations of small grains were analyzed by Draine & Lee (1984) and by Dwek (1986), using statistical methods. These focused mainly on the infrared emission from such grains. Li & Draine (2001) evaluated the temperatures of dust grains as a function of their sizes and the ambient radiation field, using the balance between the absorbed and emitted radiation:
| (3) |
Here, is the absorption cross-section for a photon of wavelength (cm) by a grain of radius where is the absorption coefficient. The energy density vs. wavelength, (eV cm-3 m-1), is given by Eq. (1). Thus, (eV cm-2 s-1 m-1) is the energy flux density at wavelength . Eq. (3) describes the balance between absorption (left-hand side) and emission (right-hand side) for large grains that maintain a nearly constant temperature (K). While most of the energy absorbed by grains is in the UV range, the emitted radiation is in the infrared range. From Eq. (3) one can extract the grain temperature vs. the grain size and the radiation field intensity, given by . Note that the temperatures of such large grains do not depend on the heat capacity of the grain.
4 The Stochastic Simulations
Here we present stochastic simulations of grain heating and cooling, taking into account the grain composition and size and the discrete nature of the UV photons. In the simulations we follow the temporal evolution of the temperature of a single grain. The spectrum of absorbed photons is divided into two domains: (a) the absorption of an energetic UV photon is taken as a discrete, stochastic process. (b) The contribution of the less energetic photons is considered as a continuous flux of energy. The emission of infrared radiation by the grains, is also described as a continuous process.
The time-dependent temperature of a single grain is evaluated as follows. Starting from a given initial temperature, the grain temperature is updated taking into account both the discrete and the continuous processes. The continuous variation of is calculated by integrating the absorbed and emitted radiation, taking into account the heat capacity of the grain. To evaluate the stochastic contribution we specify the times in which UV photons are absorbed by the grain. These times are drawn from a suitable Poisson distribution, which accounts for the flux of energetic photons and the wavelength-dependent cross section of the grain. For each absorption event, the wavelength of the photon is drawn from a suitable distrituion obtained from and . The grain temperature is then updated according to the energy of the photon and the temperature-dependent heat capacity of the grain.
4.1 Physical Properties of Dust Grains
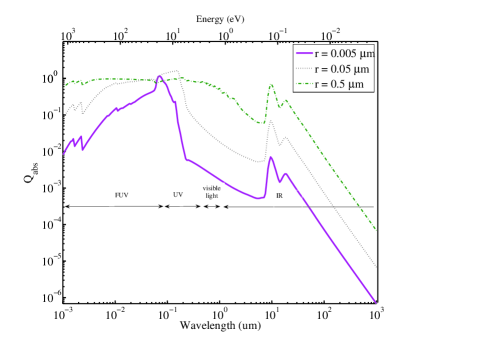
For simplicity, we assume that the grains are spherical and denote the grain radius by . Two grain compositions are studied: carbon (or graphite) grains with mass density of (gram cm-3) and silicate grains with mass density of (gram cm-3). In the analysis we use the physical properties of such spherical, single-component grains given by Laor & Draine (1993). The photon absorption coefficient as function of the wavelength for graphite grains is shown in Fig. 2. This absorption coefficient depends on the grain size. It is also weakly dependent on the temperature, however this dependence is neglected in our analysis. The values of used here are for grain temperature of 25 K (Laor & Draine 1993).
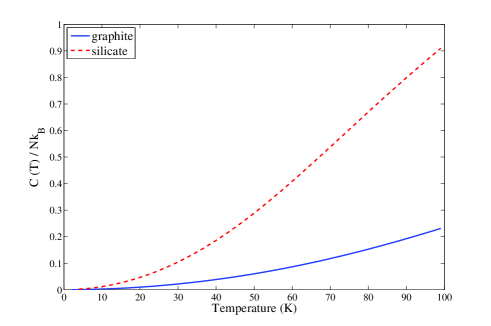
The heat capacities of silicate and graphite grains are shown in Fig. 3. The heat capacity of a graphite grain at temperature can be expressed by (Draine & Li, 2001)
| (4) |
where is the number of carbon atoms in the grain and , where
| (5) |
Similarly, the heat capacity of a silicate grain is given by (Draine & Li, 2001)
| (6) |
where is the number of atoms in the grain.
4.2 The Photon Flux
In order to simulate the time dependent temperature of a grain exposed to a given radiation field, we first divide the relevant spectrum of the radiation field into two domains: the hard, energetic photons, taken discretely, and the soft photons, taken as a continuous flux. For the discrete part we evaluate the average time between absorptions of hard photons. The actual absorption times are then obtained, using a poisson distribution, with an average , for the times between absorption events. The wavelength of each absorbed photon is drawn from a suitable distribution, which accounts for the interstellar radiation field and the absorption coefficient .
The threshold between the domains of hard and soft photons depends on the grain radius . The criterion for hard photons is that these photons are sufficiently energetic to cause a significant change in the grain temperature upon absorption. In practice, is determined such that photons with raise the temperature of a grain of radius from to . More specifically we use K and K. These values provide a good description of the stochastic features while maintaining a reasonable running time of the simulation even for large grains.
4.3 Stochastic Heating of Grains
The stochastic heating of a grain of radius exposed to radiation field is simulated as follows. First, we evaluate the average time, , between successive absorptions of energetic photons. This time is given by (Draine & Anderson, 1985)
| (7) |
where (m) is the lower cutoff of the spectrum, which corresponds to ionization threshold of atomic hydrogen. The times, , between photon absorption events are drawn from the distribution . The next step is to obtain the wavelength (and thus the energy) of the absorbed photon. This wavelength is drawn from the distribution
| (8) |
The temperature T of a grain immediately after the absorption of a UV photon of energy is calculated using the relation
| (9) |
where is the heat capacity of the grain and is the instantaneous grain temperature before the absorption of the photon. To avoid an accumulation of numerical errors, the temperature is calculated analytically. To this end, the heat capacity is fitted by a polynomial function, which is then integrated, giving rise to an expression of in terms of and .
4.4 Continuous Heating and Radiative Cooling of Grains
The time dependence of the grain temperature between absorptions of UV photons is determined by the balance between the absorption of soft photons and the emitted radiation. The time derivative of the grain temperature is thus given by
| (10) |
where
| (11) |
is the radiation absorbed by a grain of radius within the frequency range of soft photons. To obtain the time-dependent grain temperature , Eq. (10) is integrated using a standard Runge Kutta stepper during the period between succesive absorption events of hard photons.
5 Results
5.1 Grain Temperature vs. Time
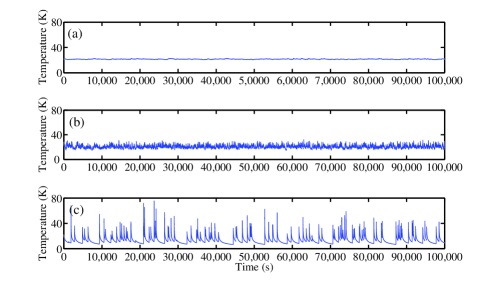
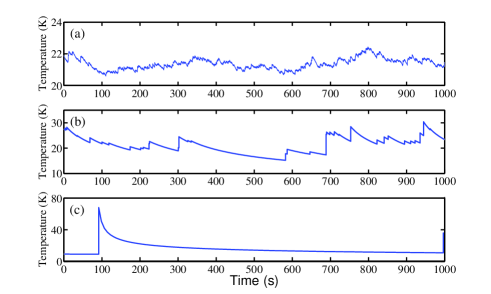
In Fig. 4 we present the grain temperature vs. time for carbon grains with radii of (a) 0.05, (b) 0.016 and (c) 0.005 m for radiation intensity of . Clearly, for the largest grain size the temperature fluctuations are negligible while for the smallest grain they are intense. The temperature of the small grains is low most of the time (10-15K). However, following the absorption of a UV photon, the grain temperature may rise up to nearly 80K followed by fast cooling, giving rise to narrow temperature spikes. This is due to the fact that the emitted radiation intensity sharply increases as a function of the grain temperature. As a result, the fluctuations tend to reduce the average temperature of the small grains. In Fig. 5 we present the time dependent grain temperatures with a higher temporal resolution. The dependence of the rate of UV photon absorptions on the grain size is clearly observed.
5.2 Grain-Temperature Distributions
Due to the wide variations in the temperatures of small grains, one should calculate not only the average temperature but the entire probability density function . This density function is obtained directly from by calculating what fraction of time the grain has spent in each range of temperatures.
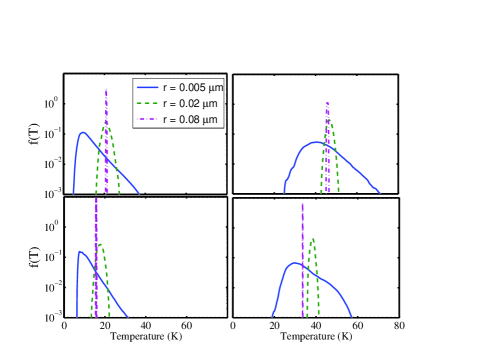
In Fig. 6 we present the distribution of grain temperatures for carbon grains [Figs. 6(a) and 6(b)] and for silicate grains [Figs. 6(c) and 6(d)]. The results are shown for three grain radii, 5 (solid line), 20 (dashed line) and 80 nm (dashed-dotted line) and two radiation field intensities: [Figs. 6(a) and 6(c)] and [Figs. 6(b) and 6(d)]. The large grains exhibit very narrow temperature distributions. This is due to the fact that the large grains absorb a high flux of UV photons and that the effect of each photon on their temperature is small. As the radiation field increases the peak shifts to higher temperatures. The small grains exhibit broad temperature distributions. These distributions are skewed, where most of the weight is concentrated at the low temperature side with only a narrow tail at the high temperature side. The typical temperature of the small grains is lower by about K compared to the large grains.
5.3 Average Grain Temperatures
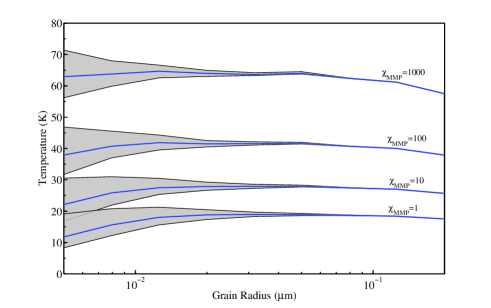
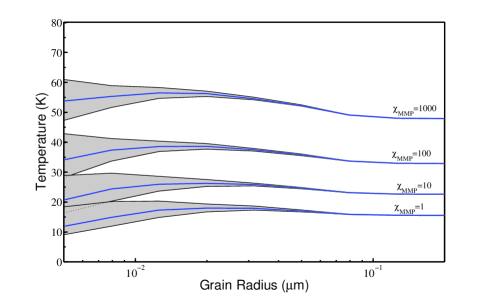
In Figs. 7 and 8 we present the average grain temperatures (solid lines) vs. grain radius for carbon and silicate grains, respectively, for radiation intensities of , 10, 100 and 1000. The gray areas represent the range of variation of the grain temperature. The upper (lower) bounds, () of these areas represent the upper (lower) semi-standard deviations with respect to , computed from the probability density function , taking into account only the range (. More specifically,
| (12) |
and
| (13) |
It is found that for all radiation fields, grains of radii larger than m do not exhibit significant temperature fluctuations. For grains of radii , the temperature fluctuations are enhanced as is reduced. The threshold value of the diameter below which fluctuations are significant is clearly independent of the radiation field. This is due to the fact that the fluctuation level is determined by the temperature rise that is caused by a single UV photon, which is reduced as the grain mass is increased. For small grains, the temperature spikes caused by UV photons are very narrow and exhibit little overlap even for high radiation fields. For high radiation fields the average temperature, (solid line) is at about the middle of the gray area. For small grains, the average temperature is near the lower edge of the gray area. This is due to the fact that the small grains spend most of the time at low temperatures.
The results for the temperature distributions (Fig. 6) and for the average grain temperatures (Figs. 7 and 8), for , are in agreement with Li & Draine (2001) and with Cuppen, Morata & Herbst (2006) in the corresponding range of grain sizes, up to variations of the order of 1K. The results presented here extend the analysis of grain temperatures to higher radiation fields. These results can thus be used in modeling of both diffuse clouds and photon-dominated regions.
The highest average temperatures are obtained for grains of intermediate size, with radii in the range of 20-35 nm. Smaller and larger grains exhibit lower average temperatures. This can be understood as follows. Small grains radiate much more efficiently during the short times they spend at high temperatures and thus tend to have lower average temperatures. Also, very small grains absorb UV radiation less efficiently than large grains, in both graphite (Fig. 2) and silicate grains. Large grains radiate much more efficiently in the relevant range of infrared radiation. The average temperatures of grains of different sizes as a function of the radiation field intensity are shown in Figs. 9 and 10 . These curves are fitted by the function
| (14) |
where and depend on the grain size. The values of and for grains of three different sizes, which consist of silicates and carbon are shown in Tables 1 and 2.
| Grain Radius (m) | ||
|---|---|---|
| 0.005 | 14.5 | 0.23 |
| 0.05 | 21.0 | 0.18 |
| 0.5 | 16.4 | 0.16 |
| Grain Radius (m) | ||
|---|---|---|
| 0.005 | 12.6 | 0.21 |
| 0.05 | 16.8 | 0.16 |
| 0.5 | 15.2 | 0.16 |
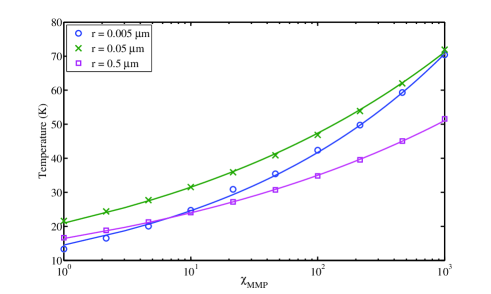
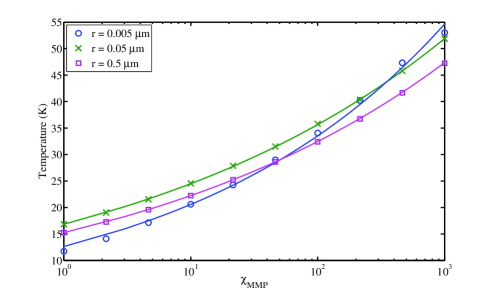
To interpret the resulting values of , consider first a macroscopic object which absorbs and emits radiation like a black body. For such object . Its temperature does not exhibit fluctuations. Since the intensity of the radiation emitted from such object is proportional to , one obtains that . Unlike a black body, for large interstellar grains, in the infrared regime, . According to Wien’s law, for an object at temperature , the highest radiation flux is emitted at wavelength , where (cm K) is the Wien’s constant. As a result, the emitted radiation is proportional to , while the incoming radiation is proportional to . Thus, , namely . This analysis agrees very well with the results shown in Tables 1 and 2 for silicate and carbon grains of radii m. For very small grains, stochastic fluctuations reduce the average temperature in the limit of low radiation intensity. As a result, larger values of are obtained.
6 Discussion
The results presented above are expected to be useful in simulations of processes taking place in interstellar clouds. In particular, the average grain temperatures vs. grain size and radiation intensity can be used as input data for such simulations. Also, the grain-temperature distribution, combined with the grain size distribution can be used to evaluate the infrared radiation spectrum emitted from dust grains in an interstellar cloud.
The commonly used approach to the evaluation of grain temperatures are based on the balance between the absorbed and emitted radiation, given by Eq. (3). Using Eq. (3) as an implicit equation, the grain temperature can be extracted numerically. In this case one can take into account the dependence of the absorption and emission properties on the grain size, through the function .
In this approach the stochastic heating which leads to temperature fluctuations of small grains is ignored. Note that due to the broad distribution of grain sizes, most of the surface area of interstellar dust is in small grains. Thus small grains dominate the radiation emitted from grains. In order to obtain an explicit formula for the grain temperature, the function is often replaced by a crude approximation, in which it is constant in the UV range, and decays as in the infrared range [see Eq. (2) in Hollenbach, Takahashi & Tielens (1991)]. This approximation ingnores the specific features of the silicate and carbon materials as well as the dependence of on the grain size. For large grains, the assumption of in the UV range is valid. However, in Fig. 2 it appears that in the range of wavelengths in which most of the radiation from grains takes place ( m) the functional dependence is rather than as assumed in Hollenbach, Takahashi & Tielens (1991)]. This feature directly affects the dependence of the average grain temperature on the radiation field intensity (see Sec. 5.3 above). For small grains, the assumption of constant is not valid. More specifically, for small grains strongly depends on and on the grain size (Fig. 2).
Our analysis takes into account both the specific features of the silicate and carbon materials, including the detailed dependence of the absorption and emission on the wavelength and on the grain size. In addition, the effect of stochastic heating is taken into account. This approach provides a more precise evaluation of interestellar dust temperatures under a broad range of conditions. It shows the dependence of the average grain temperature on both the grain composition and size and on the radiation field intensity.
Experimental studies show that molecular hydrogen formation on amorphous silicate and carbon grains is efficient only in a narrow temperature window in the range between 10-20 K Pirronello et al. (1997); Katz et al. (1999); Perets et al. (2007). This range coincides with the typical grain temperatures in diffuse clouds. Therefore, such grains are efficient catalysts for H2 formation in diffuse clouds, as long as they are sufficiently large. The efficiency of molecular hydrogen formation on small grains is reduced under conditions in which the number of adsorbed H atoms on the grain is of order 1 or lower (Tielens & Hagen, 1982; Charnley et al., 1997; Caselli et al., 1998). Under these conditions, the rate equations fail and stochastic methods based on the master equation are needed in order to evaluate the reaction rates (Biham et al., 2001; Green et al., 2001; Charnley, 2001). Since the grain size distribution is dominated by small grains, their effect on the rate of molecular hydrogen formation is important.
The experimental results cannot explain the high abundance of H2 in photon-dominated regions where the grain temperatures may reach 50 K Habart et al. (2004). This led to the possibility that temperature fluctuations of small grains may enhance the formation rate of molecular hydrogen and possibly resolve the discrepancy between the laboratory experiments and astrophysical observations.
The effect of grain temperature fluctuations on the formation rate of molecular hydrogen on small dust grains in diffuse clouds was studied recently (Cuppen, Morata & Herbst, 2006). It was found that for radiation intensity characterized by , molecular hydrogen formation is efficient only on very rough grains which exhibit higher energy barriers for H desorption than those measured experimentally Katz et al. (1999); Perets et al. (2007). However, deeper in the cloud, where the radiation intensity is reduced by extinction, molecular hydrogen formation is efficient also using the experimentally measured grain parameters.
To understand the effect of stochastic heating on hydrogen recombination, consider a small grain exposed to UV radiation. During the time between the temperature spikes the grain is colder than a large grain exposed to a similar radiation field. If the time between spikes is long enough for the grain to adsorb several H atoms, these atoms may quickly recombine during the next spike. In this case, stochastic heating may enhance H2 formation on small grains. However, even for the rate of UV photon absorption on a grain is much higher than the adsorption rate of H atoms. As a result, small grains rarely accumulate more than one H atom between temperature spikes. Thus, stochastic heating alone does not enhance the rate of H2 formation.
It was suggested that chemisorption sites on grain surfaces may also enhance the formation of H2 in photon-dominated regions (Cazaux & Tielens, 2002, 2004). However, experiments on H2 formation on graphite indicate that in order to enter the chemisorption sites the H atoms may need to pass through an energy barrier (Zecho et al., 2002; Zecho, Guttler & Kuppers, 2004). In addition, molecular hydrogen formation from chemisorption sites is markedly different than the Langmuir-Hinshelwood mechanism observed in physisorption sites. In particular, H2 molecules are formed only upon desorption of the H atoms from the surface, which occurs only at high surface temperatures of K (Zecho et al., 2002; Zecho, Guttler & Kuppers, 2004; Perets & Biham, 2006). These temperatures are much higher than the maximal grain temperatures of stochastically-heated small grains in photon-dominated regions (Fig. 6). Therefore, it seems that even the combination of stochastic heating and chemisorption does not account for the formation of H2 in photon-dominated regions.
7 Summary
The temperatures of interstellar dust grains and their dependence on the grain size and composition and on the radiation field intensity have been studied using stochastic simulations. It was found that grains of radii smaller than 0.02 m exhibit temperature fluctuations which become more intense as the grain size decreases. The temperature distribution of small grains is a skewed function, dominated by the low temperature side with a narrow tail in the high temperature side. The fluctuations give rise to a reduction in the average grain temperature. The average temperatures of grains of radii larger than 0.035 m are also slightly reduced due to their more efficient emission of infrared radiation. The average grain temperatures vs. radiation intensity were fitted according to , where and depend on the grain size and composition. These results are more accurate and general than the commonly used formulae for interstellar dust temperatures, which do not take into account the detailed features of the absorption ane emission and the effects of stochastic heating.
References
- Biham et al. [2001] Biham O., Furman I., Pirronello, V., Vidali G., 2001, ApJ. 553, 595
- Cazaux & Tielens [2002] Cazaux S., Tielens A.G.G.M., 2002, ApJ, 575, L29
- Cazaux & Tielens [2004] Cazaux S., Tielens A.G.G.M., 2004, ApJ, 604, 222
- Caselli et al. [1998] Caselli, P., Hasegawa, T.I., Herbst, E., 1998, ApJ, 495, 309
- Charnley [2001] Charnley, S.B., 2001, ApJ, 562, L99
- Charnley et al. [1997] Charnley, S.B., Tielens, A.G.G.M., Rodgers, S.D., 1997, ApJ, 482, L203
- Cuppen, Morata & Herbst [2006] Cuppen H.M., Morata O., Herbst E, 2006, MNRAS, 367, 1757
- Draine & Anderson [1985] Draine B.T., Anderson N., 1985, ApJ, 292, 494
- Draine & Lee [1984] Draine B.T., Lee H.M., 1984, ApJ, 285, 89
- Draine & Li [2001] Draine B.T., Li A., 2001, ApJ, 551, 807
- Draine [2003] Draine B.T., 2003, Annu. Rev. Astron. Astrophys., 41, 241
- Dwek [1986] Dwek E., 1986, ApJ 302, 363
- Greenberg [1971] Greenberg J. M., 1971, A&A 12, 240
- Gould & Salpeter [1963] Gould R.J., Salpeter E.E., 1963, ApJ, 138, 393
- Green et al. [2001] Green N.J.B., Toniazzo T., Pilling M.J. Ruffle, D.P. Bell, N., Hartquist T.W., 2001, A&A 375, 1111
- Habart et al. [2004] Habart E., Boulanger F., Verstraete L, Walmsley C.M., Pineau des Forets G., 2004, A&A, 414, 531
- Habing [1968] Habing H.J., 1968, Bull. Astron. Inst. Netherlands, 19, 421
- Hasegawa, Herbst & Leung [1992] Hasegawa T.I., Herbst E., Leung C.M., 1992, ApJS, 82, 167
- Hollenbach & Salpeter [1971] Hollenbach D., Salpeter E.E., 1971, ApJ 163, 155
- Hollenbach, Werner & Salpeter [1971] Hollenbach D., Werner M.W., Salpeter E.E., 1971, ApJ 163, 165
- Hollenbach, Takahashi & Tielens [1991] Hollenbach D., Takahashi, T., Tielens, A.G.G.M, 1991, ApJ 377, 192
- Katz et al. [1999] Katz N., Furman I., Biham O., Pirronello V., Vidali G., 1999, ApJ, 522, 305
- Laor & Draine [1993] Laor A., Draine B.T., 1993, ApJ, 402, 441
- Le Petit et al. [2006] Le Petit F., Nehme C., Le Bourlot J., Roueff E., 2006, ApJS, 164, 506
- Li & Draine [2001] Li, A., Draine B.T., 2001, ApJ, 551, 807
- Mathis, Mezger & Panagia [1983] Mathis J.S., Mezger P.G., Panagia N., 1983, A&A, 128, 212
- Mathis, Rumpl & Nordsieck [1977] Mathis J.S., Rumpl W., Nordsieck K.H., 1977, ApJ, 217, 425
- Mezger, Mathis & Panagia [1983] Mezger P.G., Mathis J.S., Panagia N., 1982, A&A, 105, 372
- Perets & Biham [2006] Perets H.B., Biham O., 2006, MNRAS, 365, 801
- Perets et al. [2007] Perets H.B., Lederhendler A., Biham O., Vidali G., Li L., Swords, S., Congiu E., Roser J., Manicó G., Brucato J.R., Pirronello V., 2007, ApJL, 661, L163
- Pirronello et al. [1997] Pirronello V., Biham O., Liu C., Shen L., Vidali G., 1997, ApJ 483, L131
- Spitzer [1978] Spitzer L., 1978, Physical Processes in the Interstellar Medium, Wiley, New York
- Tielens & Hagen [1982] Tielens A.G.G.M., Hagen W. 1982, A&A, 114, 245
- van de Hulst [1949] van de Hulst H.C., Rech. Astr. Obs. Utrecht, 11, 2
- van Hoof [2004] van Hoof P.A.M., Weingartner J.C., Martin P.G., Volk K., Ferland G.J., 2004, MNRAS, 350, 1330
- Weingartner [2001] Weingartner J.C., Draine B.T., 2001, ApJ, 548, 296
- Zecho et al. [2002] Zecho T., Guttler A., Sha X., Lemoine D., Jackson B., Kuppers J., 2002, Chem. Phys. Lett., 366, 188
- Zecho, Guttler & Kuppers [2004] Zecho T., Guttler A., Kuppers J., 2004, Carbon, 42, 6098