Single Atoms on an Optical Nanofiber
Abstract
We show that single-atoms can be trapped on the surface of a subwavelength-diameter silica-fiber, an optical nanofiber, without any external field, and that single photons spontaneously emitted from the atoms can be readily detected through the single guided-mode of the nanofiber. A key point of the work is our finding that atom trapping sites are created on the nanofiber surface by irradiating the atom cloud around the nanofiber with a violet laser radiation.
pacs:
42.50.-p,32.80.Pj,42.62.Fi,32.80.QkIn recent years significant progress has been achieved in manipulating single atoms. Many kinds of single-atom-localizing and trapping schemes have been demonstrated so far using various external fields. Examples would be magneto-optical traps with high magnetic field gradient one ; two ; three , ion traps four ; five , far-off-resonance optical traps six ; seven or high-finesse optical cavities eight ; nine . However, in order to further extend these technologies, development of a simpler atom-trapping method without external fields will prove promising. Also in this context a major problem arises of how to detect the small number of atoms. Quite often, these experiments rely on complicated design of high numerical aperture optics or high-finesse optical cavities that may add to the technical difficulties. Hence development of a more realistic detection system will also accelerate the technological advancements.
Here we show that single atoms can be trapped on a subwavelength-diameter silica-fiber, an optical nanofiber ten ; eleven , and that single photons spontaneously emitted from the atoms can be readily guided into a single-mode optical fiber. Experiments are performed by overlapping cold Cs-atoms in a magneto-optical trap (MOT) with an optical nanofiber and observing fluorescence photons through the nanofiber after switching off the MOT laser beams. A key point of the work is our finding that atom trapping sites are created on the nanofiber surface by irradiating the atom cloud around the nanofiber with a violet laser radiation.
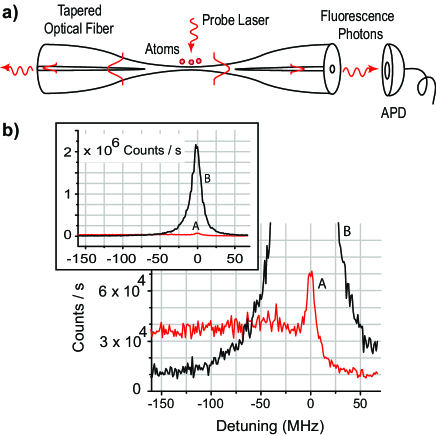
Figure 1(a) shows the conceptual diagram of the work. The nanofiber is located at the waist of a tapered optical fiber which is produced by heating and pulling commercial single-mode optical fibers. The fibers are adiabatically tapered so that the single mode propagation condition can be maintained for the whole fiber length. Note that atoms around the nanofiber emit an appreciable fraction of the fluorescence photons into the guided mode, since the mode distribution around the nanofiber is strongly confined to the guided mode eleven ; twelve . In the present experiments, we use nanofibers eleven with a diameter of 400 nm and a length of 2 mm. A MOT equipped with a resistively heated alkali dispenser source is used to produce cold Cs-atoms. The MOT position is controlled to overlap with the nanofiber eleven . Atom number density in MOT and MOT size are controlled by adjusting the dispenser current. The maximum number density around the nanofiber is 7 109 cm-3 with a MOT diameter of 2 mm and the temperature of atoms is around 100 K. The MOT laser beams are switched off for 10 s periodically at an interval of 200 s. During the switched-off periods, atoms around the nanofiber are excited by a probe laser beam irradiated perpendicular to the nanofiber in a standing-wave configuration with a polarization perpendicular to the fiber. Fluorescence photons are observed at one end of the fiber using an avalanche photodiode and a single-photon counting system, and the photon counts are accumulated for many cycles.
Figure 1(b) shows the excitation spectra measured for a closed cycle transition, 6S1/2 F = 4 6P3/2 F’ = 5, by scanning the probe laser frequency around the atomic resonance. The MOT is set to the maximum density condition and the probe laser diameter is set to 2 mm to irradiate the whole atom cloud. Intensity of the probe laser is set to 3.3 mW/cm2. The trace A denotes the observed spectrum without the effect of violet laser. As reported previously, the observed line shape is quite different from the usual atomic line shape eleven ; thirteen ; fourteen . The spectrum consists of a sharp peak near the resonance and a long tail on the red detuned side. These observations are attributed to the van der Waals (vdW) interaction between the Cs-atom and the nanofiber surface which would be dominant for distances closer than from the surface. The observed spectrum is well understood through a process in which atoms close to the nanofiber fall into a deep vdW potential. During the experiments, we have found that the excitation spectrum changes drastically when we have irradiated the nanofiber with violet laser radiation of wavelength 407 nm. The conditions are the following: The nanofiber region is irradiated with the violet laser in the presence of the MOT for several minutes. Irradiating power is 5 mW with a beam diameter of 2 mm (the irradiating intensity is 150 mW/cm2). After switching off the violet laser the fluorescence excitation spectrum is measured. The observed spectrum is denoted by trace B in Fig. 1(b) and the inset. As seen readily, the spectrum is very different from the trace A. The spectrum becomes very much squeezed towards the atomic resonance, and the peak fluorescence count increases almost 30 times. The width of the spectrum is 15 MHz FWHM. We should note that the irradiation in the absence of the MOT has no effect on the spectrum. We have found that once the nanofiber is irradiated, the observed effect lasts for several days. The observations suggest that the violet laser irradiation has modified the nanofiber surface in such a way that most of the atoms are kept from falling into the vdW potential, and dwell near the surface at some specific distance.
In order to clarify the single-atom characteristics around the nanofiber, we perform Hanbury-Brown and Twiss (HBT) experiments by reducing the atom number. The fluorescence light through fiber are split into two using a 3 dB fiber coupler, and are detected by two separate avalanche photodiodes. The photon correlations between the two channels are measured using a time-correlated single-photon-counter with a time resolution of 1 ns. In the measurements, the dispenser current is decreased to reduce both atom number and MOT size. The minimum MOT size is 80 m in diameter with an atom density of cm-3 for dispenser current ID = 3.8 A. The probe laser is tuned close to the atomic resonance, and is line focused down to 100 m using a cylindrical lens to spatially restrict the observation region to the atom cloud. The focused probe laser intensity is 60 mW/cm2. Average atom number in the observation region is estimated to be much less than one for ID = 3.8 A, assuming an observation volume around the nanofiber of 200 nm in thickness eleven and 100 m in length. Fluorescence photon count is counts/s under this condition.
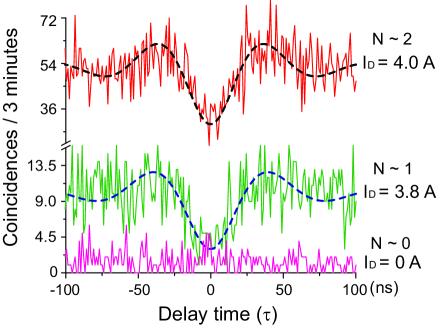
Figure 2 displays the observed coincidences for different delay time between the two channels. Each curve is obtained after an integration time of 3 minutes which requires a measurement time of 1 hour. The coincidences for ID = 0 A correspond to the background for the uncorrelated scattered light from the nanofiber. The coincidences for ID = 3.8 A and 4 A show the correlations for the fluorescence photons. Both curves show clear antibunching of fluorescence photons at zero time-delay and Rabi oscillation behaviors in the wings. The curves are fitted using a formula for photon coincidences from N-atoms eighteen , , where is the correlation function for a single atom and is calculated assuming spontaneous emission time of 30 ns and Rabi frequency of 13 MHz. Observed and fitted curves are in good agreement. Thus, observed coincidences for ID = 3.8 A and 4 A are ascribed to photon correlations from one atom and two atoms, respectively. Note that the antibunching is observable for atoms only after the violet laser irradiation. We should note that the assumed Rabi frequency is 1.3 times smaller in value than that simply estimated for the F = 4 5 transition.
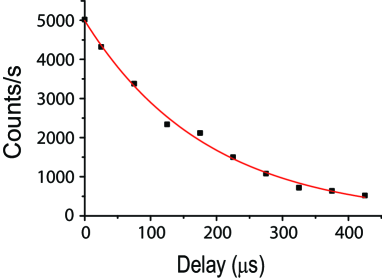
Next, the temporal behavior of the fluorescence signals is measured under the single-atom condition. Measurements are performed by extending the switched-off (on) periods to 1 ms (20 ms). Signals are measured for a gate time of 50 s in the switched-off periods, at various delay time after switching off the MOT beams. The signals are accumulated for many cycles. The results are exhibited in Fig. 3. The temporal behavior shows an exponential decay with a lifetime of 180 s. This lifetime corresponds to the atom dwelling time in the observation volume. If atoms are free around the nanofiber, the dwelling time may be determined by the transit time across the observation volume. Assuming a mean velocity of atoms as 10 cm/s and an atom transit-length of 1 m, one can estimate the transit time to be 10 s, which is about twenty-times shorter than the observed lifetime. It means that atoms around the nanofiber are not completely free; atoms are localized in the close vicinity of the nanofiber surface.
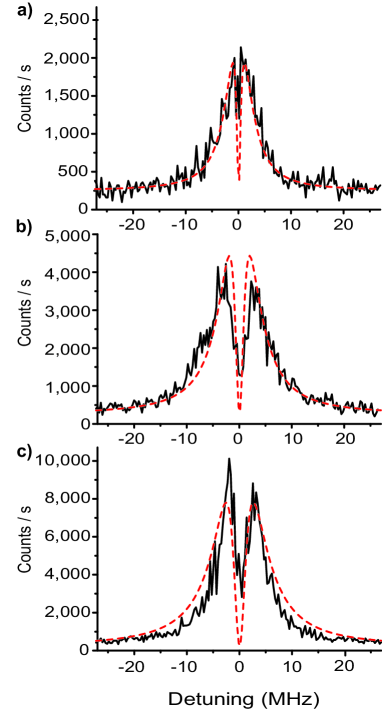
We measure the excitation spectra under the single atom condition to further clarify the behaviors of atoms. Observed results for three different probe laser intensities are displayed in Figs. 4(a-c) by solid curves. Measurements are performed by using the similar procedures as those for Fig. 1(b). Peculiar features are readily seen. For the lowest laser intensity, the spectrum exhibits almost a Lorentzian shape with 8 MHz FWHM, slightly broader than the spontaneous-emission lifetime broadening, but a sharp, small dip is seen at the peak. With increasing laser intensity, the signal becomes stronger and the sharp dip becomes more apparent, but the dip width is narrower than the lifetime broadening. Such spectral characteristics with a sharp dip cannot be explained by simply overlapping two Lorentzian profiles. Such characteristics can be explained by incorporating a quantum interference effect. The observed spectral characteristics may be explained with a V-type three-level scheme discussed in Refs. ninteen ; twenty . The scheme consists of two upper levels closely spaced within the radiative broadening and one lower ground level, and the upper levels spontaneously decay to the lower level with the same rate. By solving density matrix equations under stationary condition, the excitation spectrum can be calculated for various probe laser intensities (Rabi frequencies). Calculated spectra for three Rabi frequencies are overlaid on the observed ones in Figs. 4(a-c) with dashed lines. Spacing between the upper levels is assumed to be 1.5 MHz. The sharp dips are reproduced, and the relative spectral intensities are also well reproduced. Regarding the Rabi frequencies, we have used 1.4 times smaller values than those for the F = 4 5 two-level transition to keep the total decay rate of the upper state equal to the value for the F = 5 level.
Observed spectra clearly reveal that the upper atomic state of the transition is split into two levels. The observed splitting may be understood as a consequence of the localization of atoms into a tiny potential in the close vicinity of the nanofiber surface; that is, the atom is trapped in the potential and, moreover, the atomic motion is quantized resulting in the two motional sub-levels for the excited electronic state. We suspect that two sub-levels are also created for the ground electronic state, because the depths for the center dip can be better reproduced by introducing two sub-levels for the ground state.
The spectral measurements clarify the discrepancy found in the HBT-experiments that the fitted Rabi frequencies are much smaller than the two level values, because the localized atom is not a simple two-level atom, and the two-level estimation is not appropriate anymore. Regarding the spectrum B in Fig. 1(b), we have not observed any sharp spectral dip. It may be understood to be due to some inhomogeneous broadening for many localized atoms in many localizing sites which might have washed out the quantum interference effects. Number of localized atoms in the spectrum B may be estimated to be 200 by comparing the integrated intensities for the spectrum B and that for one single-atom.
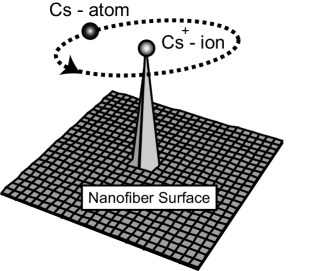
We have not yet identified the mechanism of the atom trapping definitively, but we speculate that the following scenario may be occurring. Regarding the effect of the violet laser irradiation, it is not due to the light induced atom desorption (LIAD) well known for alkalis sixteen . If it were due to the LIAD process, the effect would also appear in the absence of the MOT. By irradiating the MOT atoms with a 407 nm laser, the atoms are photo-ionized seventeen from the excited electronic state 6P3/2. Generated Cs-ions then stick to the cusps of some prominences on the nanofiber surface, and the stuck charges form atom-trapping orbits around them due to the mutual balance between the induced-dipole force, the centrifugal force, and the vdW force, as schematically illustrated in Fig. 5. Since the observed resonances are close to the free atomic resonance and the width of the trace B in Fig. 1 (b) is 15 MHz, height of the prominences may distribute from 50 to 100 nm assuming the vdW shift. Similar atom trapping with orbiting trajectory is discussed in Ref. orbiting . Based on their results and assuming an inverse proportionality of the orbiting frequency to the orbit radius, one can expect an orbit radius to be around 30 nm for the observed splitting of 1.5 MHz.
In conclusion, we have found that single-atom localizing sites are created on a nanofiber surface by irradiating the MOT atoms around the fiber with a violet laser radiation so that single atoms are trapped without any external field, and that single photons spontaneously emitted from the atoms are readily guided into a single-mode optical fiber. The present finding may be extended to various surfaces and various atomic and molecular species.
We are thankful to Fam Le Kien, Shinichi Watanabe, Makoto Morinaga, Mark Sadgrove, and Manoj Das for useful discussions and technical assistance. This work was carried out under the 21st Century COE program on “Innovation in Coherent Optical Science”.
References
- (1) Z. Hu and H. J. Kimble, Opt. Lett. 19, 1888 (1994).
- (2) F. Ruschewitz et al., Europhys. Lett. 34, 651 (1996).
- (3) D. Haubrich et al., Europhys. Lett. 34, 663 (1996).
- (4) W. Neuhauser et al., Phys. Rev. A 22, 1137 (1980).
- (5) D. J. Wineland and W. M. Itano, Phys. Lett. A 82, 75 (1981).
- (6) D. Frese et al., Phys. Rev. Lett. 85, 3777 (2000).
- (7) B. Darquié et al., Science 309, 454 (2005).
- (8) J. Ye, D. W. Vernooy, and H. J. Kimble, Phys. Rev. Lett. 83, 4987 (1999).
- (9) P. W. H. Pinkse et al., Nature 404, 365 (2000).
- (10) L. Tong et al., Nature 426, 816 (2003).
- (11) K. P. Nayak et al., Opt. Express 15, 5431 (2007); quant-ph/0610136 (2006).
- (12) F. L. Kien et al., Phys. Rev. A 72, 032509 (2005).
- (13) F. L. Kien and K. Hakuta, Phys. Rev. A 75, 013423 (2007).
- (14) F. L. Kien, S. Dutta Gupta, and K. Hakuta, Phys. Rev. A 75, 032508 (2007).
- (15) V. Gomer et al., Appl. Phys. B 67, 689 (1998).
- (16) S. E. Harris, Phys. Rev. Lett. 62, 1033 (1989).
- (17) P. Zhou and S. Swain, Phys. Rev. Lett. 78, 832 (1997).
- (18) A. Hatakeyama, M. Wilde, and K. Fukutani, e-J. Surf. Sci. Nanotech. 4, 63 (2006).
- (19) O. Marago et al., Phys. Rev. A 57, R4110 (1998).
- (20) V. I. Balykin et al., Phys. Rev. A 70, 011401(R) (2004).