X-Ray Observations of LSI+61303 with Swift
Abstract
The TeV emitting high-mass X-ray binary system LSI+61303 was observed with the Swift satellite from early September 2006 to early January 2007. Many of these observations were contemporaneous with TeV observations. The data consist of observations on 24 separate days with durations ranging between 700s and 4700s, and partially cover 4.5 orbital periods of the binary system. We present here an analysis of the 0.2 to 10keV X-ray data from the Swift-XRT instrument. Contemporaneous optical data from UVOT are also available.
1 Introduction
LS I +61 303 is a high mass X-ray binary system at a distance of , composed of a B0 Ve star with a circumstellar disc and a compact object. The observed radio through optical emission is modulated with a period () believed to be associated with the orbital period of the binary system [6, 2]. Periastron takes place at phase 0.23 and the eccentricity is (although see [7] for a recent re-evaluation of the orbital elements).
The detection of an extended and apparently precessing jet-like radio-emitting structure led to the possible identification of LS I +61 303 as a microquasar, with the emission generated through particle acceleration in a relativistic accretion-driven jet [10]. More detailed AU-scale observations [4] strongly support a counter-model, where the radio emission arises from particles shock-accelerated in the interaction of a pulsar wind with the circumstellar material. The absence of any features in the X-ray spectrum (e.g. thermal components due to an accretion disc) also support the pulsar wind model. However, Romero et al. [11] argue that the relative wind strengths are such that it is not possible to produce the simple elongated shape observed in the VLBA images, and that the gamma-ray lightcurve is more easily explained as the result of variable accretion onto a compact object.
At higher energies, LS I +61 303 was associated with the COS-B source 2CG 135+01 [13], and the EGRET source 2EG J0241+6119 [8]. More recently, LS I +61 303 has been discovered to be a strong source (peak flux of the steady flux from the Crab Nebula) of very high energy gamma-rays ()[1, 9]; one of only three known galactic sources of variable TeV emission. The particle acceleration and photon generation mechanisms which produce the TeV emission are not yet clear, and detailed contemporaneous multiwavelength observations will likely be required to resolve the situation.
Previous X-ray observations of this source have been made with ROSAT, ASCA, BeppoSAX, RXTE, XMM, INTEGRAL and Chandra (see [3] for a summary), revealing complex behaviour with significant variation of flux and photon spectral index on both short () and longer (monthly) timescales. The detection of a TeV signal from LS I +61 303 by the VERITAS telescope array in fall 2006 led us to propose target of opportunity observations with the Swift satellite. The resulting dataset, combined with some earlier Swift observations, provides the most well-sampled long-term X-ray/optical/TeV monitoring which has been performed on this source. In this paper we focus on some initial results obtained with the Swift X-ray Telescope. A complementary paper discusses the relationship between these observations and the TeV emission [12]. We also note that an analysis reaching similar results and conclusions has recently been presented by Esposito et al [5].
2 Observations and Data Analysis
The Swift satellite carries three instruments: the Burst Alert Telescope (BAT) operates between 15-150 keV and is used primarily as a gamma-ray burst trigger; the X-ray Telescope (XRT) is an imaging instrument operating from 0.2-10 keV with a single photon point spread function of 18 arcsec (half-power diameter) and a spectral resolution of 140 eV at 5.9 keV (at launch); UVOT, the UV/Optical telescope carries optical filters to cover the range 170-650 nm. The primary mission of the satellite is to investigate gamma-ray bursts and their afterglows; however, between gamma-ray burst observations Swift is an excellent tool which can provide observations of other astrophysical X-ray sources, particularly when fast response and/or frequent slews are required.
The XRT observations were made in photon counting mode on 24 separate days with exposures ranging between 700s and 4700s, covering a period from early September 2006 to late December 2006 and corresponding to a total exposure of 56 ksecs. The period following the ToO trigger (from November 21st to December 24th) is particularly well-sampled, with observations approximately once every two days.
The XRT data were processed using the most recently available standard Swift tools: xrt software version 2.0.1, ftools version 6.2, and XSPEC version 12.3.1. The ancillary response files were generated with the xrtpipeline task xrtmkarf. The spectral analysis presented in this paper used XRT data extracted from the 0.3-10 keV energy band, thus avoiding instrument response uncertainties present below 0.3 keV.
3 Results and Discussion
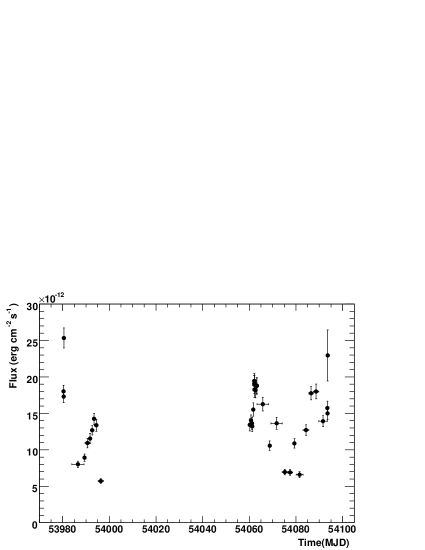
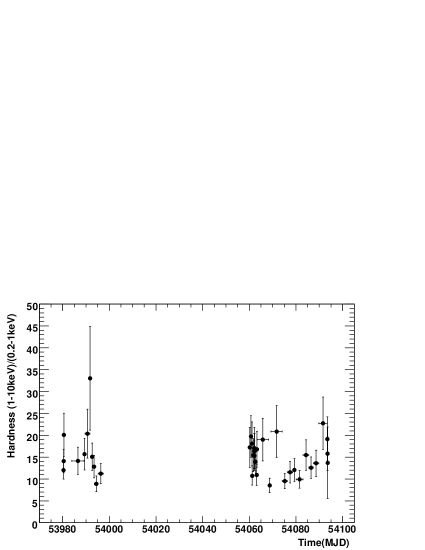
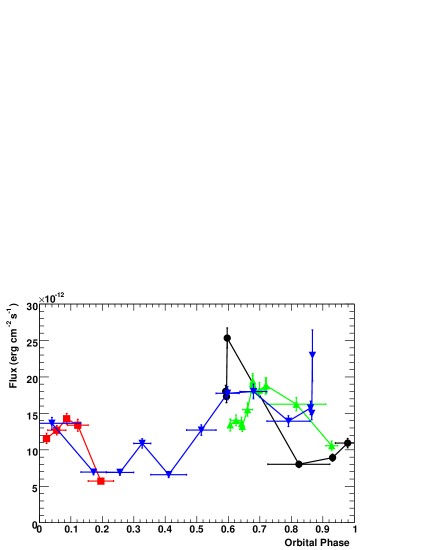
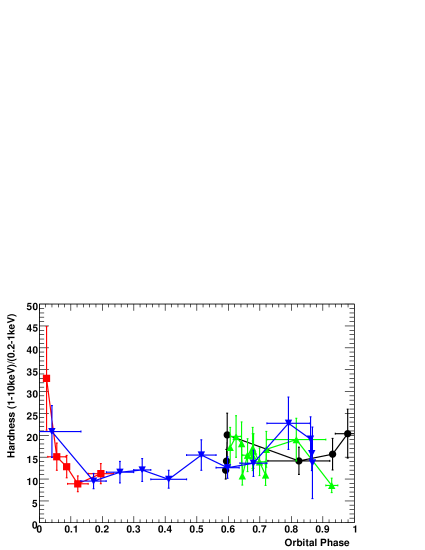
Figure 1 shows the lightcurve and hardness ratio as a function of time for the XRT observations. The XRT count rate to flux conversion factor used, obtained using the mean spectral fit parameters for these data, was . The systematic error associated with any spectral variations is not included in the error bars. Figure 2 shows the lightcurve and hardness ratio as a function of orbital phase for these same observations, using the orbital elements from [2]. Points indicated by the same symbol and colour correspond to measurements taken during the same orbital cycle. Note that the lines between points are drawn only to help illustrate this - the short timescale variability is such that this simple interpolation can not be used to estimate the emission level between observations.
The lightcurve shows clear variability in the flux of a factor of 4 - 5. While there are elevated states around orbital phases 0.6 - 0.8 and 0.0 - 0.1, it is evident that the emission level does not follow precisely the same pattern each orbital cycle. The variation in the hardness ratio is not statistically significant: /d.o.f.=45/36 for a constant fit, corresponding to a chance probability of 13%.
The source spectrum for the complete dataset is shown in Figure 3. It is well fit by a simple power law plus photoelectric absorption model (/d.o.f.=377/370), with no indication of spectral lines or a thermal black-body component. The differential flux at 1 keV is , the photon index is and the neutral Hydrogen column density is . Further analysis will examine spectral variations as a function of time and phase, and explore the possibility of correlations between the spectral parameters.

While there is no doubt that LS I +61 303 is a strongly variable X-ray source, previous evidence for a consistent orbital modulation of the X-ray flux is unconvincing, largely due to the sparseness of the data. Our observations reaffirm that the system is a strongly variable X-ray source. Preliminary analysis reveals no clear evidence for variability in the hardness ratio or correlation between the hardness ratio and flux.
Chernyakova et al. [3] have claimed evidence for a systematic variation of the X-ray spectrum across the orbit, with higher X-ray flux producing a harder spectrum, as well as for significant variation in the column density, . They explain this variation as due to the erratic acceleration and cooling of electrons in the shocks formed between the pulsar wind and an inhomogeneous “clumpy wind” from the Be star. Detailed, time resolved, spectral analysis of our dataset will provide additional constraints to this, and other, models for non-thermal emission from LS I +61 303.
4 Acknowledgements
This work is supported at Pennsylvania State University by NASA contract NAS 5-00136.
References
- [1] J. Albert et al. Variable Very-High-Energy Gamma-Ray Emission from the Microquasar LS I +61 303. Science, 312:1771–1773, June 2006.
- [2] J. Casares et al. Orbital parameters of the microquasar LS I +61 303. MNRAS, 360:1105–1109, July 2005.
- [3] M. Chernyakova, A. Neronov, and R. Walter. INTEGRAL and XMM-Newton observations of LSI +61 303. MNRAS, 372:1585–1592, November 2006.
- [4] V. Dhawan, A. Mioduszewski, and M. Rupen. LS I +61 303 is a Be-Pulsar binary, not a Microquasar. In VI Microquasar Workshop: Microquasars and Beyond, 2006.
- [5] P. Esposito et al. Swift/XRT monitoring of five orbital cycles of LSI +61 303. ArXiv e-prints, 708, August 2007.
- [6] P. C. Gregory. Bayesian Analysis of Radio Observations of the Be X-Ray Binary LS I +61 303. ApJ, 575:427–434, August 2002.
- [7] E. D. Grundstrom et al. Joint H and X-Ray Observations of Massive X-Ray Binaries. II. The Be X-Ray Binary and Microquasar LS I +61 303. ApJ, 656:437–443, February 2007.
- [8] D.A. Kniffen et al. EGRET Observations of the Gamma-Ray Source 2CG 135+01. ApJ, 486:126–+, September 1997.
- [9] G. Maier et al. Observation of the Binary System LS I +61 303 in Very High Energy Gamma-Rays with VERITAS. In 30th ICRC, Merida, 2007.
- [10] M. Massi et al. Hints for a fast precessing relativistic radio jet in LS I +61 303. A&A, 414:L1–L4, January 2004.
- [11] G. E. Romero, A. T. Okazaki, M. Orellana, and S. P. Owocki. Accretion vs colliding wind models for the gamma-ray binary LS I +61 303: an assessment. ArXiv e-prints, 706, June 2007.
- [12] A. Smith et al. TeV and X-ray Monitoring of LS I +61 303 with VERITAS, Swift, and RXTE. In 30th ICRC, Merida, 2007.
- [13] B. N. Swanenburg et al. Second COS B catalog of high-energy gamma-ray sources. ApJ Lett, 243:L69–L73, January 1981.