Discovery of Gas Accretion Onto Stars in 13 Myr old h and Persei
Abstract
We report the discovery of accretion disks associated with 13 Myr-old intermediate/low-mass stars in h and Persei. Optical spectroscopy of 5000 stars in these clusters and a surrounding halo population reveal 32 A-K stars with Hα emission. Matching these stars with 2MASS and optical photometry yields 25 stars with the highest probability of cluster membership and EW(Hα) 5 Å. Sixteen of these sources have EW(Hα) 10Å. The population of accreting sources is strongly spectral type dependent: Hα emission characteristic of accretion, especially strong accretion (EW(Hα) 10Å), is much more prevalent around stars later than G0. Strong Hα emission from accretion is typically associated with redder Ks-[8] colors. The existence of accreting pre-main sequence stars in h and Persei implies that circumstellar gas in some systems, especially those with primaries later than G5 spectral type, can last longer than 10-15 Myr.
1 Introduction
Young stars are born with massive, 0.01-0.1M⋆ (stellar mass), disks of gas and dust. The disk viscously spreads, transporting angular momentum away from the star and mass onto the star. Accretion onto the host star is identified from strong Hα emission; typical mass accretion rates onto the star are 10-8 M⊙ yr-1 for 1 Myr-old stars (Hartmann et al., 1998). After 5 Myr, fewer sources show strong Hα emission indicative of accretion, and accretion rates are typically much lower ( 10-9 M⊙ yr-1) than at earlier ages. By 10 Myr, few sources show signs of active accretion (Sicilia-Aguilar et al., 2005).
The timescale for accretion to cease and for nebular gas in circumstellar disks to disperse has important implications for planet formation. Massive planets may form in gas-poor/free conditions (Currie and Hansen 2007; Konacki and Wolszczan 2003). However, gas giant planet formation requires that circumstellar gas lasts longer than the time for a 10-15 M⊕ protoplanetary core to capture a large gaseous envelope ( 106-107 years; Ikoma et al. 2000; Papaloizou and Nelson 2005). Though the formation timescale is much shorter, the disk instability model (e.g. Boss 2005) for Jovian planet formation also requires a massive gas disk. Circumstellar gas is also necessary for planetary migration (see Goldreich and Tremaine 1980; Ward 1997), which may explain close-in giant planets (’hot Jupiters’), and circularization of the orbits of terrestrial planets. A spread in the time for accretion to cease and for gas to disperse may then lead to diverse planetary systems.
While previous studies show that few stars accrete gas after 10 Myr (Sicilia-Aguilar et al., 2005), the bulk properties of the longest-lived accreting systems are not well constrained due to small number statistics. There are 5 known actively accreting stars with ages 10 Myr, including PDS 66, AK Sco, and St 34 (Mamajek et al. 2002; Reipurth et al. 1996; White and Hillenbrand 2005). Well-known 10-20 Myr old clusters such as NGC 7160 (Sicilia-Aguilar et al. 2005) and Sco-Cen (Chen et al., 2005) have 200 known members. Because accretion at ages 10 Myr is rare ( 2%; Sicilia-Aguilar et al. 2005), a larger ( 1000-2000 sources) ensemble of 10-20 Myr sources spanning a wide range of spectral types is required to investigate the oldest accretion disks.
The double cluster, h and Persei – 13 1 Myr old, d=2.34 kpc (Bragg and Kenyon, 2005; Slesnick et al., 2002; Keller et al., 2001) – provides an excellent opportunity to study the properties of a statistically significant sample of the longest-lived accretion disks. With 5000 members in the cluster and surrounding halo population (Currie et al., 2007a), robust constraints on gas accretion are possible even if the fraction of accreting sources is 1-2%.
In this Letter, we report the discovery of 25 sources in h and Persei with evidence for active gas accretion. In §2 we identify these accreting sources by measuring Hα equivalent widths and use quantitative spectral types to select actively accreting h and Per members from a sample of 5000 optical spectra. Analysis of our sample in §3 reveals that the population of accretors is almost solely comprised of stars with spectral types later than G5. We compare the strength of accretion signatures to dust emission in §4, finding a weak correlation between the Hα equivalent width and IR excess. We conclude with a brief summary and discuss future observations to investigate circumstellar gas accretion in young stars in more detail. These results show that circumstellar gas in at least stars later than G0 lasts 10-15 Myr.
2 Hectospec Observations/Hydra Archival Data of h and Persei and Sample Identification
We obtained Hectospec (Fabricant et al., 2005) spectra of 4536 sources with V 16-19, J 14.25-16.25, and J-H 0-1.5 in Persei and the halo population surrounding both clusters on the 6.5m MMT telescope at Whipple Observatory during September and November 2006. Each source was observed in three 10-minute exposures using the 270 mm-1 grating. This configuration yields spectra at 4000-9000 Å with 3 Å resolution. The data were processed using the standard Hectospec reduction pipeline (Fabricant et al., 2005) and typically had S/N 30-50 at 5000 Å.
We acquired additional spectra of 710 sources near h and Per with the Hydra multifiber spectrograph (Barden et al., 1993) on the WIYN 3.5 m telescope at the Kitt Peak National Observatory. Hydra spectra were obtained during two observing runs in November 2000 and October 2001 and include stars with V 14-17 and J 12-14.5 (S/N 10-30 typically). We used the 400 g mm-1 setting blazed at 42o, with a resolution of 7 Å and a coverage of 3600-6700 Å. The standard IRAF task dohydra was used to reduce the spectra.
To select candidate emission line stars, we measured spectral indices (I(); see Balog and Kenyon 2002) with the IRAF sbands111IRAF is distributed by the National Optical Astronomy Observatory, which is operated by the Association of Universities for Research in Astronomy, Inc. under contract to the National Science Foundation. routine. Because classical T Tauri stars have strong Hα emission and often have strong Ca II emission, we derived indices for Hα, Hβ, Hγ, Hδ, and several Ca II features. For the H I features, bandpasses with widths of 30 Å ( Hα) and 20 Å (Hβ, Hγ, and Hδ) yield good results. For Ca II, we centered bandpasses at 3933 Å (20 Å width) and at 8498, 8542, and 8662 Å (20 Å) for the IR triplet lines. To identify sources with Hα emission, we compared the spectral index of Hα to Hβ, which was less likely to be in emission and typically had high signal-to-noise.
The Hα and Hβ spectral indices for most stars lie in a narrow band on I(Hβ) vs. I(Hα) from (-0.2,0) to (0.7,0.4). Accreting sources have anomolously small Hα index for a given Hβ index (Figure 1a; see also Balog and Kenyon 2002 and Bragg and Kenyon 2002). Candidate accreting sources are those lying outside the main distribution of sources on I(Hβ) vs. I(Hα), below the line I(Hα)=0.5 I(Hβ)-0.15 (Figure 1a). After removing background M giants, Be stars, and low signal-to-noise stars, 32 sources with clear Hα emission and moderate to high signal-to-noise spectra remain.
While each source clearly shows Hα emission, sources with weaker emission may not be accreting (White and Basri, 2003). Chromospheric activity can produce very small Hα equivalent widths (EW (Hα) 3-5 Å). Accreting T Tauri stars typically EW(Hα) 10-20 Å, though low rates of accretion ( 10-8 M⊙yr-1) can produce EW(Hα) 3-10 Å for stars earlier than K5 (White and Basri, 2003; Barrado y Navascues and Martin, 2005). We consider sources with EW(Hα) 5Å as potential accreting stars. To distinguish more clearly between accreting sources and chromospherically active sources, we remeasured EW(Hα) using the IRAF routine splot, smoothing any low signal-to-noise spectra and fitting the line profile to a gaussian. Typically, splot derived only slighly smaller EW(Hα) than sbands ( a few Å). Sources with EW(Hα) 10Å are ’strong’ accretors. Consistent with observations of T Tauri stars in Taurus-Auriga and other clouds (e.g. Kenyon and Hartmann 1995), no sources show evidence of CaII emission.
To derive quantitative spectral types for these 32 sources, we used spectral indices for , , , the G band (4305 Å), and Mg I (5175 Å). We fit piecewise linear relationships between each spectral index and spectral type from the Jacoby et al. (1984) standards, derived spectral types for each index, and adopted the median as the spectral type. For the 3 sources with Hβ in emission, we derived a spectral type from the 4 other indices without signs of accretion. The resulting spectral type distribution ranged from A7 to M0 with typical uncertainties of 1-2 subclasses. We compared our results to those using the quantitative spectral typing method of Hernandez et al. (2004) and found the agreement to be excellent.
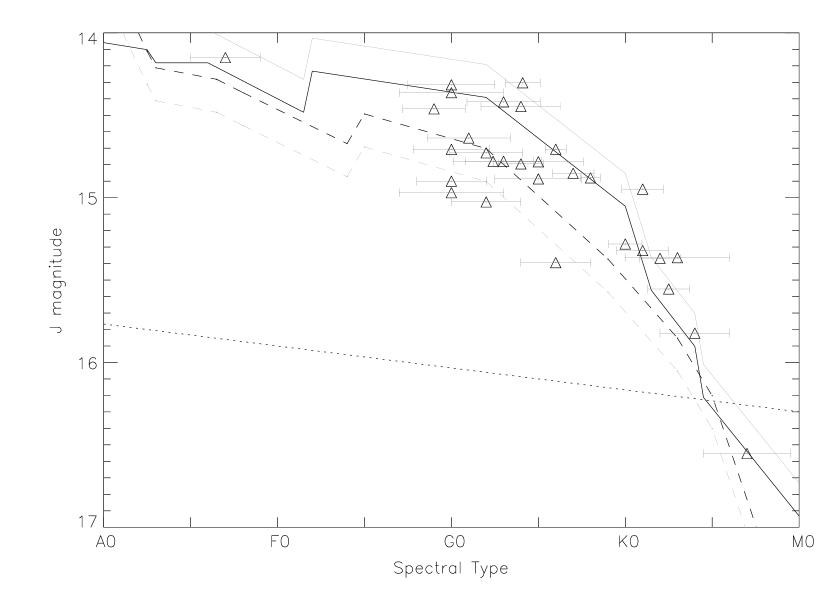
To identify stars likely associated with the clusters, we used optical photometry (Keller et al. 2001) and 2MASS/IRAC photometry from Currie et al. (2007a). We exploited the well-constrained age and reddening of the double cluster and derived the expected 2MASS J magnitude of members at each spectral type. Sources within 0.2 mags of a band defined by the 12 and 14 Myr stellar isochrones (from Siess et al. 2000) were identified as members (see Currie et al. 2007a). Figure 1 shows the 30 sources consistent with membership: the other two sources were a late K star and a M0 star that are too cool to fall within the isochrone. Although these two sources may lie at the cluster distance and have slightly different ages (e.g. 10 or 15 Myr) or extinctions, the clusters appear to have a small age spread (Meynet et al., 1993; Keller et al., 2001; Slesnick et al., 2002; Bragg and Kenyon, 2005). Thus, the 30 sources shown in Figure 1b are the most likely cluster members. Table 1 lists their properties.
Young T Tauri stars show a strong correlation between EW(Hα) and IR excess from disks (Kenyon and Hartmann, 1995). Stars in 1 Myr-old Taurus-Auriga with L band (3.8) excess (K-L 0.4) typically have stronger Hα emission (EW(Hα) 10Å) than those lacking excess. Excess sources have a range of EW(Hα), which implies a range of accretion rates. To search for a similar trend in our sample, we use the Ks-[8] color derived from the 2MASS/IRAC data (Currie et al., 2007a) as an indicator of excess emission instead of Ks-[3.6]. Eighteen of 30 sources with Hα emission are detected at [8] with errors 0.2 mags. Typically, sources without 8 photometry are fainter in Ks ( 14.25-14.75) than those with 8 detections (Ks 13.5-14).
3 Results: Evidence for Accretion at 13 Myr
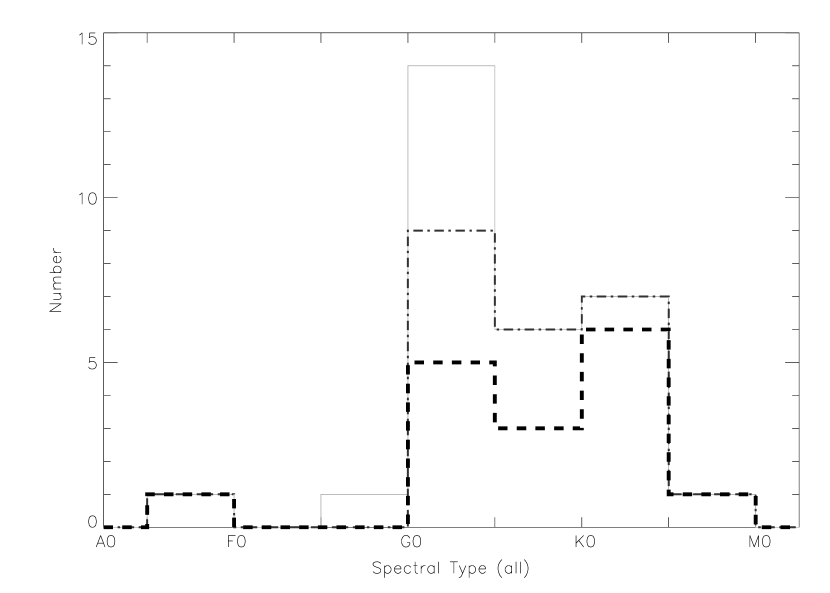
Most of the Hα emission stars in h and Per have G0 or later spectral types (Figure 2). Overall, 25/30 sources have EW5 Å and thus are likely accreting circumstellar gas. All fourteen sources later than G5 have EW 5 Å. By contrast, 5/16 sources G5 and earlier have EW(Hα) 5Å . The distribution of sources with EW(Hα) 10Å is even more strongly biased towards later spectral types. Seven out of eight sources later than K0 have EW(Hα) 10Å while only 6/16 of the sources G5 and earlier have EW(Hα) 10Å. Four of five sources with EW(Hα) 20Å are later than K0, and the sources with the strongest Hα emission (EW 47 Å and 59 Å) are a K7 and K4 star. The atlas of both emission line and non-emission line stars will appear in the full spectroscopy survey paper (T. Currie et al. 2008, in progress).
The spectral type distribution of accreting sources is comprised almost exclusively of sources later than G0. Because we do not have a complete sample of non-accreting sources at a given spectral type, we cannot accurately measure the frequency of accretors as a function of spectral type/mass. Nevertheless, we can estimate the fraction of accreting sources in our sample by deriving how many of the 5145 (4536 from Hectospec, 609 from Hydra) sources with near-IR photometry lie along the h and Per isochrone in J/J-H. We follow Currie et al. (2007a) and identify as cluster members 2040 sources within a band that extends 0.3 mags fainter and 0.75 mags brighter (the binary locus) than the 13 Myr isochrone, where the vast majority of non members lie below the isochrone. We estimate the spectral types of sources from their J-H colors and divide the sample into two populations, earlier than F8 and later than F8, and compute the frequency of accreting sources in each population.
The frequency of accreting sources is low and is consistent with a spectral-type dependence. Overall, 1.2% (25/2040) of sources consistent with cluster membership are likely accreting. Through F8, 1/1042 (0.1%) sources with spectra show evidence of accretion. The frequency is 2.4% (24/998) for later sources. Spectral types for the non-accreting sources will provide better constraints on the frequency of long-lived accretion disks. The low fraction of accreting stars in h and Per is broadly consistent with results from other studies. Sicilia-Aguilar et al. (2005) and Sicilia-Aguilar et al. (2006) identified accretion in 40% of stars in the 4 Myr-old Tr 37 Cepheus OB2 subgroup and only one of 55 stars ( 2%) in the other Cep OB2 subgroup, NGC 7160 ( 11.8 Myr old). An accretion disk fraction of 1.2% from our sample is consistent with a decline of accretion disk frequency with age.
To check these results, we consider possible selection biases. If the emission-line stars have significant optical veiling, their spectral types appear earlier than fainter (J 16) non-accreting stars with similar masses. We then overestimate their relative frequency. However, stars with large veiling have near-IR excesses, H–Ks 0.5 and Ks–[3.6] 0.4-0.5 (Kenyon and Hartmann, 1995). With H–Ks 0.4-0.5 and Ks–[3.6] 0.3-0.4 (Currie et al., 2007a), emission-line stars in h & Per have little or no near-IR excess and probably have negligible veiling. If photometric errors move faint cluster stars outside the isochrone, we underestimate the number of non-accreting stars. Including all stars with J-H 0.48 (F8; 2303 total) in the cluster sample yields a strict lower limit to the accretion frequency, 1.1% 0.2%, which is still much larger than the frequency for earlier type stars. Finally, we consider the possibility that the H emission flux associated with late-type stars is undetectable around 1 mag brighter cluster stars with earlier spectral types. With EW(H) 5–10 Å for the late-type stars, early-type stars with similar H fluxes should have EW(H) = 2–5 Å, easily detectable on our spectra. Thus, we conclude that possible selection effects do not produce a false trend of increasing accretion frequency among lower mass stars.
Our sample shows a 2-3 correlation between accretion and infrared excess. The majority of stars have negligible Ks-[8] excess (Figure 3), but some sources have Ks-[8] 0.4, the nominal cutoff for IR excess in Currie et al. (2007a) and Kenyon and Hartmann (1995). One source, the K7 star, has Ks-[8] 1 and is clearly redder than a stellar photosphere. Sources with larger Hα (20Å) have redder Ks-[8] colors than those with small/marginal Hα emission. The Spearman rank correlation coefficient between Ks-[8] and Hα emission is rs=0.60; this distribution has a low probability of being drawn from a random sample (pd = 0.9%). The distribution is less correlated for sources with chromospheric Hα emission (rs=0.35, pd 22%). We thus find a 2-3 correlation between IR excess and EW(Hα) for sources with Hα emission. However, some debris disks in h and Per (Currie et al., 2007b, c) have strong excesses at [8] and/or [24] without accretion. Therefore, while accretion may imply IR excess, IR excess need not imply accretion.
4 Summary & Discussion
We have discovered a population of stars with accretion disks in h and Persei. Of the 30 Hα emitters that are likely h and Per cluster/halo members, 25 have EW(Hα) consistent with circumstellar gas accretion. The spectral types of accreting sources are almost all later than G0. About 1.2% of our sample shows evidence for accretion, consistent with the low fraction of accretors at 10 Myr found by Sicilia-Aguilar et al. (2005). We find that Hα emission sources with larger EW(Hα) have redder Ks-[8] excess.
While current survey points to a spectral type dependence on the accretion disk lifetime, a full survey of h and Persei sources can provide stronger constraints on the properties of long-lived disks. Our sample is drawn heavily from Persei and the surrounding halo population. Analyzing spectra of the slightly more massive/dense member of the Double Cluster, h Persei, will test whether the frequency of accreting stars is the same or depends on properties such as the mass and density of the cluster. A complete Hectospec survey of 15,000 sources in the h and Per field is underway and will better characterize the population of accreting pre-main sequence stars.
References
- Barden et al. (1993) Barden, S., et al., 1993, PASP, 37, Fiber Optics in Astronomy II, ed. P. M. Gray (San Francisco: ASP), 185
- Barrado y Navascues and Martin (2005) Barrado y Navascues, D., Martin, E., 2005, RMxAC, 24, 179
- Balog and Kenyon (2002) Balog, Z., Kenyon, S., 2002, AJ, 124, 2083
- Boss (2005) Boss, A., 2005, ApJ, 629, 535
- Bragg and Kenyon (2002) Bragg, A., Kenyon, S., 2002, AJ, 124, 3289
- Bragg and Kenyon (2005) Bragg, A. & Kenyon, S., 2005, AJ, 130, 134
- Chen et al. (2005) Chen, C., et al., 2005, ApJ, 623, 493
- Currie and Hansen (2007) Currie, T., Hansen, B., 2007, ApJ, 666,1232
- Currie et al. (2007a) Currie, T., et al., 2007(a),ApJ, 659, 599
- Currie et al. (2007b) Currie, T., et al., 2007(b), ApJL, 663, 105
- Currie et al. (2007c) Currie, T., et al., 2007(c), ApJ accepted, arXiv:0709.2510
- Fabricant et al. (2005) Fabricant, D., et al., 2005, PASP, 117, 1411
- Goldreich and Tremaine (1980) Goldreich, P., Tremaine, S., 1980, ApJ, 241, 425
- Hartmann et al. (1998) Hartmann, L., et al., 1998, ApJ, 495, 385
- Hernandez et al. (2004) Hernandez, J., et al., 2004,AJ, 127, 1682
- Ikoma et al. (2000) Ikoma, M., et al., 2000,ApJ, 537, 1013
- Jacoby et al. (1984) Jacoby, G., et al., 1984, ApJS, 56, 257
- Keller et al. (2001) Keller, S.C., et al., 2001,AJ, 122, 248
- Kenyon and Hartmann (1995) Kenyon, S., Hartmann, L., 1995, ApJS, 101, 117
- Konacki and Wolszczan (2003) Konacki, M., Wolszczan, A., 2003, ApJ, 589, 495
- Mamajek, Meyer, and Liebert (2002) Mamajek, E., Meyer, M., Liebert, J., 2002, AJ, 124, 1670
- Meynet et al. (1993) Meynet, G., Mermilliod, J-C., Maeder,A., 1993, A&AS, 98, 477
- Papaloizou and Nelson (2005) Papaloizou, J., Nelson, R., 2005, A&A, 433, 247
- Reipurth, Pedrosa, and Lago (1996) Reipurth, B., Pedrosa, A., and Lago, M., 1996, A&AS, 120, 229
- Siess et al. (2000) Siess, L., et al., 2000,A&A, 358, 593
- Sicilia-Aguilar et al. (2005) Sicilia-Aguilar, A., et al., 2005, AJ
- Sicilia-Aguilar et al. (2006) Sicilia-Aguilar, A., et al., 2006, AJ
- Slesnick et al. (2002) Slesnick, C., et al., 2002,ApJ, 576, 880
- Ward (1997) Ward, W., 1997, Icarus, 126, 261
- White and Basri (2003) White, R., Basri, G., 2003, ApJ, 582, 1109
- White and Hillenbrand (2005) White, R., Hillenbrand, L., 2005, ApJ, 621, 65
| ST | (ST, subclasses) | EqW(Hα) | Accreting? | J | Ks-[3.6] | Ks-[8] | |||
|---|---|---|---|---|---|---|---|---|---|
| 2:22:21.62 | 57:04:00.5 | G4 | 1.0 | 13.7 | y | 14.303 | 13.612 | 0.292 | … |
| 2:22:39.53 | 57:15:42.9 | G0 | 2.5 | 4.5 | n | 14.315 | 13.538 | 0.271 | 0.223 |
| 2:17:36.96 | 57:01:10.6 | G0 | 3.0 | 1.8 | n | 14.363 | 13.697 | … | -0.247 |
| 2:17:55.15 | 56:56:03.1 | G3 | 2.1 | 6.46 | y | 14.419 | 13.613 | 0.258 | 0.096 |
| 2:21:46.44 | 57:02:44.2 | G4 | 2.3 | 5.75 | y | 14.446 | 13.697 | 0.349 | 0.405 |
Note. — Properties of sources with Hα emission (first five entries). Sources with EW(Hα), 5Å are identified as accreting sources. All but the final entry are from Hectospec. Uncertainties in EW(Hα) were 1-2 ÅȦll photometric measurements listed are 5 detections. Sources were typically brighter than the 10 limit in J (15.7) and Ks (14.8) (see Currie et al. 2007a).