2 CESR, 9 Av du colonel Roche, BP 44346, 31028 Toulouse Cedex 4, France
3 Max-Planck-Institut für extraterrestriche Physik, Giessenbachstraße, 85748 Garching, Germany
Calibration of the galaxy cluster – relation with XMM-Newton
The quantity , the product of the X-ray temperature and gas mass , has recently been proposed as a robust low-scatter mass indicator for galaxy clusters. Using precise measurements from XMM-Newton data of a sample of 10 relaxed nearby clusters, spanning a range of – M⊙ keV, we investigate the – relation. The – data exhibit a power law relation with slope , close to the self-similar value (3/5) and independent of the mass range considered. However, the normalisation is below the prediction from numerical simulations including cooling and galaxy feedback. We discuss two effects that could contribute to the normalisation offset: an underestimate of the true mass due to the HE assumption used in X-ray mass estimates, and an underestimate of the hot gas mass fraction in the simulations. A comparison of the functional form and scatter of the relations between various observables and the mass suggest that may indeed be a better mass proxy than or .
Key Words.:
Cosmology: observations, Cosmology: dark matter, Galaxies: cluster: general, (Galaxies) Intergalactic medium, X-rays: galaxies: clusters1 Introduction
All theoretical approaches characterise galaxy clusters in terms of their mass. Models of structure formation predict the space density, distribution and physical properties of clusters as a function of mass and redshift (e.g. Bertschinger 1998). However, the mass is not easily measured. X-ray estimates from the hydrostatic equilibrium (HE) equation are valid only for reasonably relaxed clusters and require temperature profiles of high statistical quality; furthermore, the available precision rapidly degrades with redshift. Based on the regularity of the cluster population, other X-ray observables such as luminosity, temperature , or gas mass , have been used as proxies for the mass, e.g. to constrain cosmological parameters using cluster surveys (Voit 2005). Studies of cluster formation physics must also rely on mass proxies when considering unbiased (i.e., covering a variety of dynamical states) or distant cluster samples (e.g. Maughan 2007). The identification of the best mass proxy, and knowledge of its exact relation to the mass, are therefore important.
The most commonly used mass proxy, , is expected to be closely related to the mass via the virial theorem. Significant progress on the calibration of the local – relation for relaxed clusters has recently been made, with excellent agreement now achieved between various observations (Arnaud et al. 2005; Vikhlinin et al. 2006), and comparison between observations and numerical models including cooling and galaxy feedback showing agreement to the level (e.g. Nagai et al. 2007b; Arnaud et al. 2005). Kravtsov et al. (2006) recently proposed a new mass proxy, , where is the gas mass within , the radius corresponding to a density contrast of . is related to the thermal energy of the gas and is the X-ray analogue of the integrated SZ Comptonisation parameter, . The numerical simulations of Kravtsov et al. showed that, as compared to or , is a better mass proxy, in the sense that the intrinsic scatter was lower than for any other mass indicator, regardless of cluster dynamical state (similar to previous results for the – relation, e.g., da Silva et al. 2004; Motl et al. 2005; Nagai 2006). Furthermore, its evolution appears to be close to the standard self-similar expectation.
In this Letter, we present the – relation derived from precise XMM-Newton data and compare it to the – and – relations. The – relation is discussed with respect to previous Chandra results and theoretical expectations (Nagai et al. 2007b). Other relations between observables, such as the variation of the gas mass fraction with mass, are also investigated in order to shed new light on the scatter and slope of the various mass-proxy relations.
| Cluster | ||||||
|---|---|---|---|---|---|---|
| A 1983 | ||||||
| MKW9 | ||||||
| A 2717 | ||||||
| A 1991 | ||||||
| A 2597 | ||||||
| A 1068 | ||||||
| A 1413 | ||||||
| A 478 | ||||||
| PKS 0745-191 | ||||||
| A 2204 |
2 The data
2.1 The sample
The sample comprises ten nearby morphologically relaxed clusters in the temperature range . We have previously used XMM-Newton data to study the structural and scaling properties of the total mass (Pointecouteau et al. 2005; Arnaud et al. 2005) and of the entropy (Pratt et al. 2006); the , and values derived in these papers are used in the present Letter (Table 1). The observations and data reduction steps are fully described in Pointecouteau et al. (2005). values were derived from NFW model fits to mass profiles measured down to , except for the two lowest mass clusters (), thus the estimates involve some data extrapolation. However, as discussed in Arnaud et al. (2005), the estimates rely solely on the physically and observationally-motivated assumption that the best fitting NFW model remains valid between and , and not on a less reliable extrapolation of density and temperature profiles. The temperature was derived from a single-temperature fit to the integrated spectrum in the – aperture, the inner radius defined to exclude the cooling core region and the outer radius chosen to ensure a sufficiently precise estimate over the whole mass range. This aperture corresponds to –, while an aperture of – is used for the definition of in numerical simulations and in the Chandra analysis (Nagai et al. 2007b). For typical decreasing temperature profiles, these values are expected to be slightly smaller by – 111The difference is for A1413 (Arnaud et al. 2005), a cluster for which the temperature profiles measured up to both with XMM-Newton and Chandra are in excellent agreement (Pratt & Arnaud 2002; Vikhlinin et al. 2005). In the simulations of Nagai et al. (2007a), the – temperature is higher than that in –. A smaller difference is expected for the aperture used here..
| Relation | ||||
|---|---|---|---|---|
| – | ||||
| – | ||||
| – | ||||
| – | ||||
| – | - | |||
| – | 0.044 |


The integrated gas mass depends sensitively on the gas density at large radius. To compute , we re-derived the gas density profile from the emissivity corrected surface brightness profiles using the deprojection and PSF-deconvolution technique recently developed by Croston et al. (2006). This derivation is free of any assumption on profile shape, such as power law behaviour at large radius, a feature common to all analytical fitting models used thus far (e.g. Pratt & Arnaud 2002; Pointecouteau et al. 2005; Vikhlinin et al. 2006). Furthermore, the statistical errors are readily estimated from a built-in Monte-Carlo procedure (see Croston et al. 2006, for details). For the present sample, there is excellent agreement between the deprojected density profiles and the analytical model profiles derived in our previous work (Pointecouteau et al. 2005; Pratt et al. 2006). The significant differences are in the very central regions of some clusters (e.g. Croston et al. 2006, Fig 12) and for A2597 at large radii, where the deprojected profile is slightly steeper than the model profile. The gas mass estimated with the two methods differs by less than , except for A2597 ( difference). For all clusters, except for A1983 and MKW9, the surface brightness profiles extend at least up to , or very close to it, so that extrapolation uncertainty is not an issue. For A1983 and MKW9, the estimated from extrapolation in the – plane are (A1983) and (MKW9) larger than the gas mass measured at ; as shown below, these points do not however have a significant effect on the results.
The resulting , and values are listed in Table 1. Errors on include both statistical errors and errors due to uncertainties in , which are summed quadratically, with the latter dominating the error budget.
2.2 Scaling relations
For each observable set we fitted a power law relation of the form , where is the Hubble constant normalised to its present value and is fixed to the expected scaling with . The fit was performed using linear regression in the – plane, taking into account the errors on both variables (FITEXY; Press et al. 1992). The pivot point is chosen so that the normalisation and slope are nearly independent parameters. For the – relation for instance, the covariance in and normalised to the product of their standard errors is 0.042. The resulting values are given in Table 2, and the various correlations are plotted in Fig. 1 and Fig. 2. Table 2 also shows the raw and intrinsic scatter about the best fitting relations in the – plane. The raw scatter was estimated using the vertical distances to the regression line, weighted by the error. The intrinsic scatter was computed from the quadratic difference between the raw scatter and the scatter expected from the statistical errors.
The regression method is strictly valid only if the intrinsic scatter is negligible as compared to the statistical scatter; in fact they are of the same order (Table 2). We verified that the results are unchanged using the variation of the method discussed in Pratt et al. (2006). Finally, the – relation is robust to exclusion of A1983 and MKW9, for which data extrapolations were required (see above): the differences are at the and levels for the slope and normalisation, respectively.
3 Discussion and conclusions
3.1 Comparison with theoretical predictions
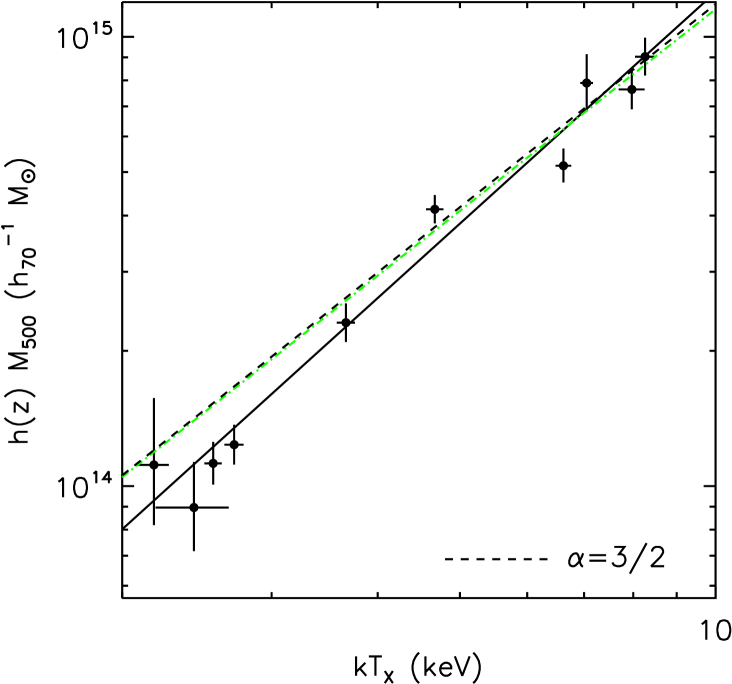
The slope of the observed relation:
| (1) |
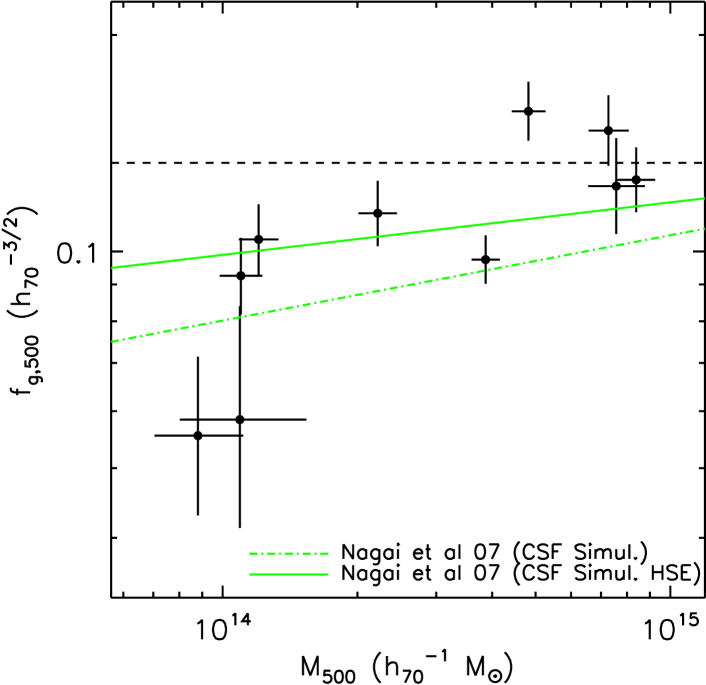
is slightly smaller than the standard self-similar value (), at the significance level, consistent with the – and – relations (Table 2 and Fig. 2 top panel). The – relation is shallower than expected, reflecting the increase in gas mass fraction with mass (Fig. 2 bottom-middle panel), while the – is steeper. At a given mass the gas mass is smaller and the temperature is higher, leading to a partial cancellation in the product (see also below).
The observed normalisation is smaller over the whole range than that derived from numerical simulations including cooling and galaxy feedback (Nagai et al. 2007b), while the observed slope is consistent with the predicted slope, , within the error (Fig. 1). Better agreement is obtained with the simulated – relation, where is the mass estimated from mock X–ray observations and the HE equation. Although the predicted slope, , is slightly higher, the difference in normalisation drops to () at . As discussed by Nagai et al. (2007b), the offset in normalization, also observed with Chandra data, may arise from an underestimate of the true mass by the HE equation, perhaps due to residual non-thermal pressure support. These numerical simulations also predict a hot gas mass fraction systematically smaller than observed (Fig. 2 bottom-middle panel). The difference is smaller for simulated using and again could be due, in part, to biases in X–ray mass estimates. Nevertheless, there may also be an underestimate of in the simulations, possibly due in part to over-condensation of hot gas into the cold dense phase (Nagai et al. 2007b). This would contribute to the offset, by shifting the – relation to the left in the – plane. Finally, as the normalization depends on , the difference in the exact definition of (see Sec. 2.1) could contribute by to the offset.
3.2 Comparison with Chandra results
Our – relation is very similar to that derived by Nagai et al. (2007b) from the Chandra data presented in Vikhlinin et al. (2006, see our Fig. 1). The slope is consistent with our value, , and the normalisation at , , is higher than our value, , at only the level. Even better agreement is obtained with the best fitting relation quoted by Maughan (2007, dashed line in Fig. 1), derived from the same data excluding the lowest mass cluster (A. Vikhlinin, priv. communication). Here the slope () is closer to the self-similar value, as we have found, and the difference in normalisation is less than over the whole mass range.
3.3 Comparison of mass proxies for relaxed clusters
For relaxed clusters, Kravtsov et al. (2006) found similar scatter in the – and – relations ( and 0.047 respectively), but two times less scatter in the – relation (0.022). We can compare with the present data, the statistical quality allowing us to estimate the intrinsic scatter for the first time. The scatter (Table 2) is the same for the – and – relations () and slightly larger for the – relation (). The latter may reflect that the – relation is not actually a power law: the gas mass fraction appears constant at , with a progressive drop at lower mass (Fig. 2 bottom-middle panel).
In fact the behaviour of appears to be the primary factor driving the scatter in the – relation. The – relation is extremely tight (Fig. 2 and Table 2), being well fitted by a power law with no measurable scatter, in spite of the precision of the data. Since , the scatter in the – relation simply reflects the scatter in the – relation (cf. top and bottom left panels of Fig. 2). This scatter could arise from true scatter in and/or scatter in the X–ray mass to true mass ratio, e.g., due to variations in the magnitude of nonthermal pressure support. Note that a low-scatter correlation between and is expected: it is straightforward to show that the logarithmic scatter in the – relation is 1/3 of the scatter in the – relation for (Table 2).
In terms of observed scatter in the relation with mass, thus does not appear to be a better proxy than , and is only slightly better than . However we caution against over-inerpretation. Firstly, the present results are for relaxed clusters only: with the current data we cannot check if the scatter is insensitive to dynamical state (Kravtsov et al. 2006; Poole et al. 2007). Secondly, the scatter estimates should be confirmed using larger cluster samples with stricter selection criteria.
However, in terms of functional dependence with mass, is clearly a better proxy than : it is better fitted by a simple power-law, and has a slope closer to the standard self-similar value (Table 2). Furthermore, although the quality of the power law fits to – and – are formally similar (), with similar () deviations from the standard slope, there is some indication that is also a better proxy than in this regard. The slope of the – relation may depend on mass range (Arnaud et al. 2005), reaching the standard value when cool clusters are excluded, but the slope of the – relation remains stable in that case ( difference).
3.4 Concluding remarks
Our results suggest that the various mass scaling relations might be better understood by considering the gas thermal energy () and mass () as its most fundamental properties. Let us suppose that the thermal energy content of the gas is the quantity most closely related to the mass (i.e. the best mass proxy is indeed ), and that its relation with mass has a quasi-standard slope. Let us further note that the gas mass fraction appears constant at high mass, with a progressive decrease below a ’break’ mass (reflecting gas loss or incomplete accretion in low mass systems due to non gravitational effects). Since varies as , one then expects a steepening of the – relation at low mass, with a standard slope at high mass.
A deeper understanding of the mass scaling relations will come from the X-ray study of larger unbiased samples of local clusters, such as REXCESS (Böhringer et al. 2007), combined with lensing data. This is necessary to ascertain the dependence of the – relation on dynamical state, and to calibrate its normalisation and slope. This step is essential because the use of as a mass proxy, as in the case of , requires a detailed understanding of non-gravitational effects, in particular of the impact of cooling and feedback on the fraction of primordial gas that remains in the gravitationally bound hot phase. Precise measurements at are needed to constrain models, on which one must rely for high z studies. Significant progress is also expected from forthcoming SZ data (e.g from the Planck Surveyor all sky survey), especially if combined with XMM-Newton or Chandra data, which will allow a full study of the – relation.
Acknowledgements.
We thank A. Kravtsov and D. Nagai for useful comments on the manuscript, and the referee for a speedy and pertinent response.References
- Arnaud et al. (2005) Arnaud, M., Pointecouteau, E. & Pratt, G.W. 2005, A&A, 441, 893
- Bertschinger (1998) Bertschinger, E. 1998, ARA&A, 36, 599
- Böhringer et al. (2007) Böhringer, H., Schuecker, P., Pratt, G. W. et al., 2007, A&A, 469, 363
- Croston et al. (2006) Croston, J.H., Arnaud, M., Pointecouteau, E. & Pratt, G.W. 2006, A&A, 459, 1007
- da Silva et al. (2004) da Silva, A.C., Kay, S.T., Liddle, A.R & Thomas, P. 2004, MNRAS, 348, 1401
- Kravtsov et al. (2006) Kravtsov, A.V., Vikhlinin, A. & Nagai, D. 2006, ApJ, 650, 128
- Maughan (2007) Maughan, B.J. 2007, ApJ, in press, astro-ph/0703504
- Motl et al. (2005) Motl, P.M., Hallman, E.J., Burns, J.O. & Norman, M.L. 2005, ApJ, 623, L63
- Nagai (2006) Nagai, D. 2006, ApJ, 650, 538
- Nagai et al. (2007a) Nagai, D., Vikhlinin, A. & Kravtsov, A. 2007a, ApJ, 655, 98
- Nagai et al. (2007b) Nagai, D., Kravtsov, A. & Vikhlinin, A. 2007b, ApJ, submitted, astro-ph/0703661
- Pointecouteau et al. (2005) Pointecouteau, E., Arnaud, M. & Pratt, G.W. 2005, A&A, 435, 1
- Pratt & Arnaud (2002) Pratt, G.W. & Arnaud, M. 2002, A&A, 394, 375
- Pratt et al. (2006) Pratt, G.W., Arnaud, M. & Pointecouteau, E. 2006, A&A, 446, 429
- Poole et al. (2007) Poole, G..P., Babul, A., McCarthy, I.G., Fardal, M.A., Bildfell, C.J., Quinn, T., Mahdavi, A., 2007, MNRAS, submitted, astro-ph/0701586
- Press et al. (1992) Press, W.H., Teukolsky, S.A., Vetterling, S.A. & Flannery B.P. 1992, Numerical Recipes in Fortran 77, Second Edition, p.660
- Vikhlinin et al. (2005) Vikhlinin, A., Markevitch, M., Murray, S, Jones, C., Forman, W., & Van Speybroeck, L. 2005, ApJ, 628, 655
- Vikhlinin et al. (2006) Vikhlinin A., Kravtsov, A., Forman, W., Jones, C., Markevitch, M., Murray, S. & Van Speybroeck, L. 2006, ApJ, 640, 691
- Voit (2005) Voit, G.M. 2005, Rev. Mod. Phys., 77, 207