Application of spectral methods for high-frequency financial data to quantifying states of market participants
Abstract
Empirical analysis of the foreign exchange market is conducted based on methods to quantify similarities among multi-dimensional time series with spectral distances introduced in [A.-H. Sato, Physica A, 382 (2007) 258–270]. As a result it is found that the similarities among currency pairs fluctuate with the rotation of the earth, and that the similarities among best quotation rates are associated with those among quotation frequencies. Furthermore it is shown that the Jensen-Shannon spectral divergence is proportional to a mean of the Kullback-Leibler spectral distance both empirically and numerically. It is confirmed that these spectral distances are connected with distributions for behavioral parameters of the market participants from numerical simulation. This concludes that spectral distances of representative quantities of financial markets are related into diversification of behavioral parameters of the market participants.
keywords:
Econophysics , Spectral distance , Agent-based modelingPACS:
89.65.Gh ,02.50.Ey1 Introduction
Developing and spreading of Information and Communication Technology (ICT) computerize our society all over the world. One can access information more easily than before 1980s, while one sometimes faces to occasions when one has to handle massive information beyond human information processing capacity.
In early 1990s financial markets started to introduce electronic trading systems due to development of ICT. This brings that information generated in the financial markets almost becomes detectable. It is even becoming possible to conduct algorithmic trading or automated trading by using real-time financial data.
The foreign exchange market is the largest financial market all over the world. Recently an increasing number of financial institutions are embracing the opportunities and benefits in automated and algorithmic trading systems. These systems have been successively studied in order to avert risks due to explosion of information and several financial institutions even experimentally or commercially utilize them [1, 2, 3]. It is predicted that more becoming common more trading can be quickly conducted. Moreover they have an advantage to human traders from a viewpoint of fairness, accuracy, speed, and cost-effectiveness. If they excess critical mass then human traders may not understand what happens in the financial markets. Therefore it is expected to become an important work to construct a system to quantify market states (states of market participants in financial markets) automatically since monitoring of financial markets of which speed is predicted to be beyond human information processing capacity is needed. From physical point of view practical methods should be considered. In order to construct such a system constructive utilization of high frequency financial data should be sophisticated.
Generally speaking massive data contain less information since one cannot understand and handle them without computers. In order to understand them some kinds of information extraction techniques are proposed [4]. By application of the random matrix theory to correlation matrices of multi-dimensional time series some studies showed that market states reveal in both eigenvectors and eigenvalues [5, 6]. It is known that the bone structure consisting of larger eigenvectors is related to clusters of financial markets. This approach is based on methods to extract network structures of correlation network [7]. In fact correlations among financial commodities are related to market structure but multiple aspects to measure states of financial markets should be discussed.
In this article we consider alternative method to quantify market states with spectral methods. Moreover the relation between spectral distance and behavioral parameters of agents is discussed through an agent-based model. Recent works show that agent-based models of financial markets are useful to understand price formation mechanism in the financial markets [8, 9].
The rest of this article is constructed as follows. In Section 2 definition of spectral distance for multi-dimensional time series is presented. In Section 3 quotation rates and quotation frequencies are introduced as representative quantities of financial markets. In Section 4 the Jensen-Shannon spectral divergence and the Kullback-Leibler spectral distance are calculated by using high-frequency financial data of the foreign exchange market. In Section 5 in order to check adequateness of proposal methods those spectral distances are calculated by an agent-based model. Section 6 is devoted into concluding remarks.
2 Definition of spectral distances for multi-dimensional time series
Consider -dimensional time series with a sampling period . The power spectrum of is estimated as periodgram estimator with the Hanning windowing function with width ,
| (1) |
The periodgram estimator is calculated as
| (2) |
where the Nyquist frequency is . By using the normalized power spectrum, which is defined as
| (3) |
the spectral entropy is calculated as its Shannon entropy;
| (4) |
Note that a direct current component is ignored in this definition. Obviously when is a white noise it takes the maximum value since the power spectrum of it is a uniform function. Contrarily when is a sinusoidal function it takes the minimum value since the power spectrum of it is a Dirac’s -function.
In fact the spectral entropy indicates randomness of time series. High/low means that is unpredictable/predictable. Suppose the situation to predict time series from historical observation. The mode for a normalized power spectrum is the frequency where the normalized power spectrum has the maximum value:
| (5) |
If the spectral entropy is low then sinusoidal signal with is an adequate model to predict the future time series. Contrarily if the spectral entropy is high then sinusoidal signal with is unworkable to predict the future time series. Therefore the spectral entropy is related into predictability of the mode on a frequency domain.
Actually according to the maximum entropy principle the best choice for the distribution is the one that maximizes Eq. (4) subject to the constraint the normalized condition
| (6) |
By using the Lagrange multiplier differentiating
| (7) |
with respect to and then equating the result to zero one obtains the uniform normalized power spectrum
| (8) |
Namely the best choice without knowledge is the uniform power spectrum, which means that time series are white noises.
By using the spectral entropy the Jensen-Shannon spectral distance [10, 11] for -dimensional time series is defined as
| (9) |
where and , one can quantify the similarity among a set of time series. The Jensen-Shannon spectral distance measures similarity of randomness among time series. As an alternative spectral distance the Kullback-Leibler spectral distance defined as
| (10) |
can be considered in analogy with relative entropy between normalized power spectra [12, 13, 11].
3 Representative quantities of financial markets
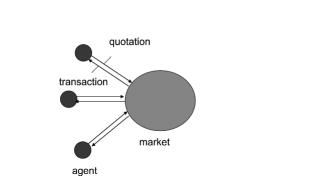
What are representative quantities of financial markets? Since there is circular causality between market participants and a broking system quotations are causes/results for broking systems/market participants, and transactions are results/causes (see. Fig. 1).
For empirical investigation the database of the foreign exchange market in the CQG datafactory is used [14]. As representative quantities of the financial market quotation rates and quotation frequencies are detectable from this database. The data contain 20 currency pairs (AUD/JPY, AUD/USD, CAD/JPY, CHF/JPY, EUR/AUD, EUR/CHF, EUR/GBP, EUR/JPY, EUR/NOK, EUR/SEK, EUR/USD, NZD/USD, USD/CAD, USD/CHF, USD/JPY, USD/NOK, USD/SEK, USD/ZAR, GBP/AUD, and GBP/JPY) which consists of 11 currencies; AUD(Australia Dollar), CAD(Canadian Dollar), CHF(Swiss Franc), EUR(Euro), GBP(United Kingdom Pound), JPY(Japanese Yen), NOK(Norwegian Krone), NZD (New Zealand Dollar), SEK(Swedish Krona), USD(United States Dollar), and ZAR(South Africa Rand).
Quotation frequencies are defined as the number of quotations per unit time,
| (11) |
where is the number of ask/bid quotations of the -th currency pair from to , and denotes the sampling period. is set as 1 [min] throughout this analysis ( [1/min]). The best ask/bid rates are defined as the minimum ask/maximum bid rates between and .
| (12) |
where denotes ask/bid rates of the -th currency pair at time .
In this article, on the basis of spectral methods quantifying dynamical structure of best quotation rates and quotation frequencies is conducted.
4 Empirical analysis of the foreign exchange market
As shown in Fig. 2 the Jensen-Shannon spectral distances for best ask rates and ask quotation rates fluctuate with rotation of the earth. The Jensen-Shannon spectral divergence for the ask quotation frequencies denoting and that for the best ask rates denoting are calculated as shown in Fig. 2.

(a)
 (b)
(b)
In order to calculate a correlation between them a cross-correlation coefficient is introduced as
| (13) |
It is estimated as for a period from 16th Oct 2006 to 20th Oct 2006. As a result it is found that best ask rates and quotation frequencies are weekly and constantly coupled with each other.
Furthermore it is confirmed that values of the Jensen-Shannon spectral distance are related to the Kullback-Leibler spectral distance matrices. A mean of the Kullback-Leibler spectral divergence, defined as
| (14) |
is always greater than (). Furthermore it is found that is proportional to with a coefficient as 0.42 from the least square method for empirical results as shown in Fig. 3 ().

5 Agent-based model
By introducing an agent-based model of a financial market in which market participants exchange financial commodities [11].
The agents have threshold dynamics like the Granovetter model [15]. Three investment attitudes are codes as 1 (buying), 0 (waiting), and -1 (selling). If the inner states of the -th agent for the -th financial commodity at time excesses buying threshold or below selling threshold then the -th agent selects the investment attitude for the -th financial commodity at time
| (15) |
where is assumed to be described within diversification of interpretation and self-feeling :
| (16) |
where denotes perception of the -th market participants. For simplicity the perception is assumed to be described as both exogenous and endogenous information;
| (17) |
where denote log returns, exogenous information, functions to show attentions, and a time span to calculate a moving average. The attentions are assumed as . Rates and quotation frequencies of the -th financial commodity at time are respectively defined as
| (18) |
Relationships between spectral distance and behavioral parameters of the market participants are investigated. It is found that diversification of parameters of agents is related to the Jensen-Shannon spectral distance for behavioral frequencies as shown in Fig. 4 (a). Furthermore it is confirmed that a mean of the Kullback-Leibler spectral distance matrices is proportional to the Jensen-Shannon spectral divergence from numerical simulation as shown in Fig. 4 (b).

(a)
 (b)
(b)
6 Conclusion
Spectral distances can be adopted to quantity to measure the market states totally. As a result it is found that the spectral distances fluctuate with rotation of the earth and that best quotation rates are weakly coupled with quotation frequencies. The Jensen-Shannon spectral distance is proportional to a mean of the Kullback-Leibler spectral distance.
It is expected that employment of both spectral methods and high-frequency financial data provides us deepen insights of financial markets with high resolution. Information extraction from massive data will become important to understand states of financial markets.
This work was partially supported by a Grant-in-Aid for Scientific Research (# 17760067) from the Japanese Ministry of Education, Culture, Sports, Science and Technology.
References
- [1] P.X. Casqueiro and A.J.L. Rodrigues, European Journal of Operational Research, 175 (2006) 1400–1412.
- [2] M.A.H Dempster and V. Leemans, Expert Systems with Applications, 30 (2006) 543–552.
- [3] F. Strozzi, J.-M. Zaldívar, J.P. Zbilut, Physica A, 376 (2007) 487–499.
- [4] A. Carbone, H.E. Stanley, Physica A, 384 (2007) 21–24.
- [5] L. Laloux, P. Cizeau, J.-P. Bouchaud, and M. Potters, Phys. Rev. Lett., 83 (1999) 1467–1470.
- [6] G. Tibély, J.-P. Onnela, J. Saramäki, K. Kaski, and J. Kertész, Physica A, 370 (2006) 145–150.
- [7] T. Aste, and T.D. Matteo, Physica A, 370 (2006) 156–161.
- [8] K. Yamada, H. Takayasu and M. Takayasu, Physica A, 382 (2007) 340–346.
- [9] D. Challet, Physica A, 382 (2007) 29–35.
- [10] J. Lin, IEEE Transaction on information theory, 37 (1991) 145–150.
- [11] A.-H. Sato, Physica A, 382 (2007) 258–270.
- [12] R. Veldhuis, and E. Klabbers, IEEE transactions on speech and audio processing, 11 (2003) 100–103.
- [13] A.-H. Sato, J. Oshiro, Journal of the Physical Society of Japan, 75 (2006) 084005.
- [14] Data is provided by CQG Inc.
- [15] M. Granovetter, The American Journal of Sociology, 83 (1978) 1420–1443.