Constraints on Circumstellar Material Around the Type Ia Supernova 2007af11affiliation: Some of the data presented herein were obtained at the W. M. Keck Observatory, which is operated as a scientific partnership among the California Institute of Technology, the University of California, and NASA. The Observatory was made possible by the generous financial support of the W. M. Keck Foundation. 22affiliation: Based in part on observations obtained with the Hobby-Eberly Telescope, which is a joint project of the University of Texas at Austin, the Pennsylvania State University, Stanford University, Ludwig-Maximilians-Universität München, and Georg-August-Universität Göttingen.
Abstract
Patat et al. recently inferred the existence of circumstellar material around a normal Type Ia supernova (SN) for the first time, finding time-variable Na I D absorption lines in the spectrum of SN 2006X. We present high-resolution spectroscopy of the bright SN Ia 2007af at three epochs and search for variability in any of the Na D absorption components. Over the time range from 4 d before to 24 d after maximum light, we find that the host-galaxy Na D lines appear to be of interstellar rather than circumstellar origin and do not vary down to the level of 18 mÅ (column density of cm-2). We limit any circumstellar absorption lines to be weaker than mÅ ( cm-2). For the case of material distributed in spherically symmetric shells of radius cm surrounding the progenitor system, we place an upper limit on the shell mass of M⊙, where is the Na ionization fraction. We also show that SN 2007af is a photometrically and spectroscopically normal SN Ia. Assuming that the variable Na D lines in SN 2006X came from circumstellar matter, we therefore conclude that either there is a preferred geometry for the detection of variable absorption components in Type Ia supernovae, or SN 2007af and SN 2006X had different types of progenitor systems.
Subject headings:
circumstellar matter — supernovae: general — supernovae: individual (SN 2006X, SN 2007af)1. INTRODUCTION
Type Ia supernovae (SNe Ia) are currently the only distance indicator that can be used effectively out to cosmological distances (e.g., Riess et al., 1998; Perlmutter et al., 1999; Leibundgut, 2004; Filippenko, 2005; Riess et al., 2007). Therefore, understanding the nature of these explosions and any potential systematics that may be present is of great importance to cosmology. However, we still do not know what the progenitor systems of SNe Ia are, and observations suggest that there may be at least two physically different progenitor classes (e.g., Mannucci et al., 2005; Scannapieco & Bildsten, 2005; Mannucci et al., 2006; Sullivan et al., 2006; Quimby et al., 2007), as well as some peculiar objects (e.g., Li et al., 2001, 2003; Hamuy et al., 2003, although see Benetti et al., 2006).
Patat et al. (2007a) have recently made a possible breakthrough in the study of SN Ia progenitors by optically detecting circumstellar material (CSM) in a SN Ia for the first time. Using high-resolution spectra of SN 2006X spanning from just before maximum light to four months later, they showed that at least four distinct components of the Na I D absorption lines varied with time until months post-explosion. Although similar behavior has been seen in Milky Way stars and is generally attributed to small interstellar clouds moving across the line of sight (e.g., Welty & Fitzpatrick, 2001), in SN 2006X the lack of time evolution in the corresponding Ca II H & K absorption features at the same velocities probably rules out that interpretation. Instead, Patat et al. conclude that the variable absorption is from circumstellar clouds in the progenitor system that were ionized by the radiation from the supernova and recombined several weeks later; because Na I has a much lower ionization potential than Ca II, the Na I line profiles can change without an accompanying effect in the Ca II lines if the ionizing radiation has an appropriate spectrum. These results appear to indicate a single-degenerate progenitor for SN 2006X with a red-giant companion.
Multiple-epoch high-resolution spectroscopy is available for only one previous SN Ia, the peculiar SN 2000cx (Patat et al., 2007b), so it is not yet known whether the time evolution seen in SN 2006X is common. Assuming that the variable absorption is related to material from the SN progenitor, if the behavior of SN 2006X is not universal then either there must be geometric effects that limit the visibility of the absorption to certain lines of sight (e.g., near the orbital plane of the progenitor system) or there are multiple progenitor systems for SNe Ia.
In this Letter, we present high-resolution spectra of the Type Ia SN 2007af obtained at , , and d relative to maximum light. We use these data to test the Patat et al. (2007a) model, searching for variability in the Na D absorption features.
2. OBSERVATIONS AND DATA REDUCTION
SN 2007af was discovered by K. Itagaki on 2007 March 1.84 (UT dates are used throughout this paper; Nakano & Itagaki, 2007). A spectrum obtained on 2007 March 4.34 showed that SN 2007af was a SN Ia at least a week before peak brightness (Salgado et al., 2007). The host galaxy of the supernova is NGC 5584, an Scd galaxy with a recession velocity of 1638 km s-1 (Koribalski et al., 2004).
2.1. High-Resolution Spectroscopy
We observed SN 2007af with the ARCES echelle spectrograph (Wang et al., 2003) on the ARC 3.5 m telescope at Apache Point Observatory (APO) on 2007 March 10. We obtained two 1440 s exposures covering the spectral range 3200–10,000 Å at a spectral resolution of and a signal-to-noise ratio (S/N) of 36 per pixel at the wavelength of the redshifted Na D lines. The data were reduced in IRAF111IRAF is distributed by the National Optical Astronomy Observatories, which are operated by the Association of Universities for Research in Astronomy, Inc., under cooperative agreement with the National Science Foundation. with the echelle package using standard procedures.
We also observed SN 2007af with the high-resolution spectrograph (HRS; Tull, 1998) on the Hobby-Eberly Telescope (HET) on 2007 March 31. The spectrograph was in its mode, with a 2″-diameter fiber and the 316 /mm grating centered at 6948 Å, providing nearly complete wavelength coverage from 5095 to 8860 Å. We obtained 4 spectra totaling 3100 s of exposure time and reached a combined S/N of 87 per pixel. The HRS data were reduced in IRAF with the echelle package.
Finally, we observed SN 2007af with the HIRES spectrograph (Vogt et al., 1994) on the Keck I telescope on 2007 April 7, over the range 3150–6000 Å. We obtained a single 900 s exposure through a slit, yielding and S/N = 47 per pixel. The HIRES data were processed with the MAKEE data reduction package.
2.2. Imaging and Low-Resolution Spectroscopy
SN 2007af was the target of extensive photometric follow-up observations with the 0.76 m Katzman Automated Imaging Telescope (KAIT; Li et al., 2000; Filippenko et al., 2001), continuing for over 4 months since its discovery. No pre-explosion images are available for subtraction of the host-galaxy light, but the supernova occurred relatively far out in the disk, away from significant contaminating features. We used the daophot package (Stetson, 1987) in IRAF to perform point-spread function photometry of SN 2007af relative to various field stars in the KAIT images, which were calibrated on five photometric nights with KAIT and the Nickel 1 m telescope at Lick Observatory.
We also obtained low-resolution spectra of SN 2007af with the Kast spectrograph (Miller & Stone 1993) on the Shane 3 m telescope at Lick on 2007 March 13, April 10, and June 14, which were reduced in IRAF following normal procedures.
3. RESULTS
3.1. Light Curve and Low-Resolution Spectra
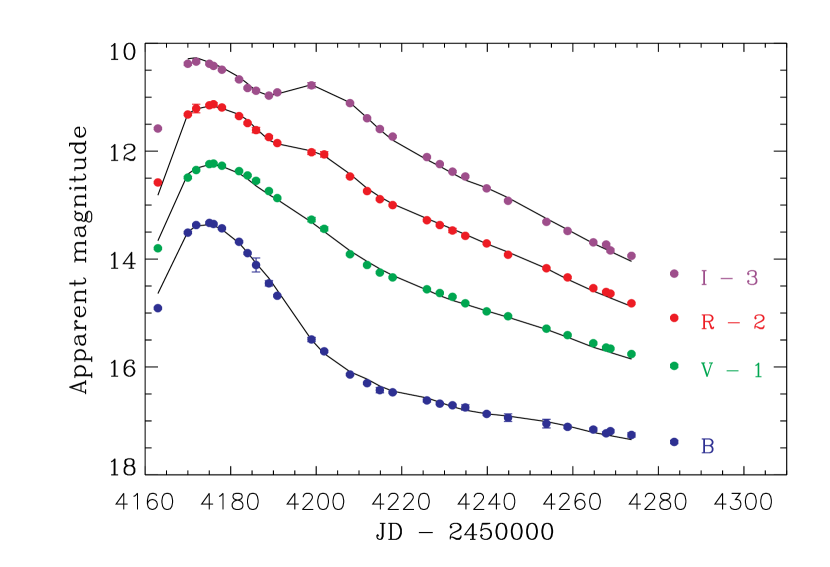
We display light curves of SN 2007af in Figure 1. We fitted the photometric data with the latest version of the multicolor light-curve shape method (MLCS2k2; Jha et al., 2007) to determine the parameters of the supernova. We find that the time of -band maximum was 2007 March 14.76 (JD = 2,454,174.26), with an uncertainty of 0.12 d. The derived line-of-sight extinction to the SN is mag, with an extinction law of (the Milky Way foreground reddening is 0.039 mag; Schlegel et al. 1998). The distance modulus to SN 2007af is mag, giving the SN an absolute magnitude of . The luminosity/light-curve-shape parameter is , and the MLCS2k2 reduced value of 0.53 indicates an excellent fit. Photometrically, SN 2007af appears normal in every respect.
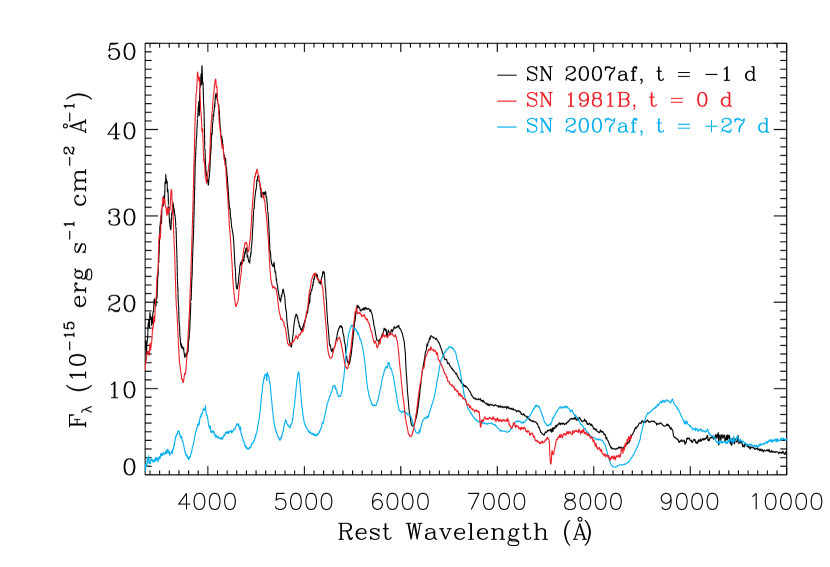
In Figure 2 we show the spectrum of SN 2007af one day before maximum light, along with a template spectrum of SN 1981B at a similar epoch. Analysis with the Superfit spectral fitting code (Howell et al., 2005) indicates that SN 2007af is a very typical SN Ia, comparable to archetypal events such as SNe 1981B and 1989B (e.g., Filippenko, 1997).
3.2. Sodium D Absorption Lines at High Resolution
We display the high-resolution spectra of SN 2007af around the host-galaxy Na D lines in Figure 3. At least two absorption components are present. In the ARC and HET spectra, the shape of the blue wing of the absorption profile (as well as the residuals from two-component fits) suggest that a third component at slightly lower velocity might be blended with the stronger absorption line, and examination of the higher-resolution Keck spectrum confirms this.
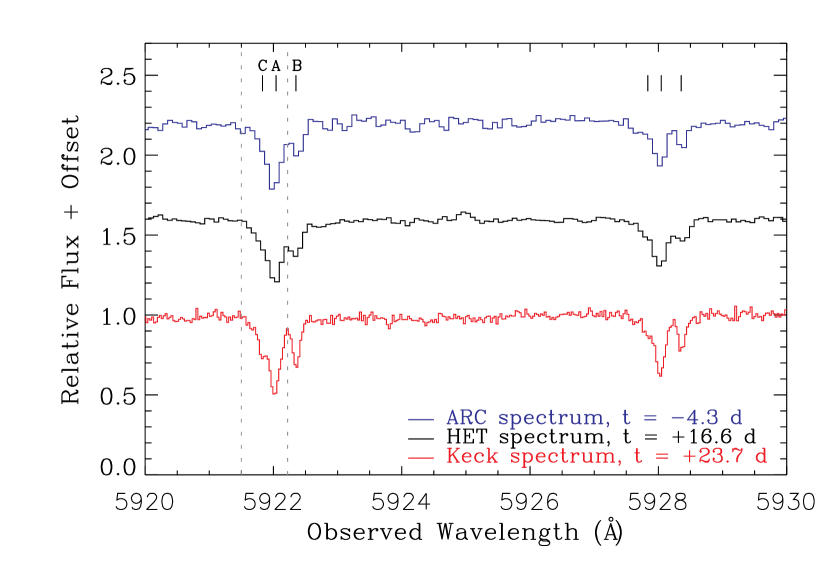
We fit the Na D1 and D2 absorption lines in each spectrum with three Gaussian components using a Levenberg-Marquardt least-squares fit algorithm.222We obtain equivalent results with Lorentzian or Voigt profiles. Each absorption component is given its own depth, width, and wavelength, but we hold the wavelength separation between the D1 and D2 lines fixed at its known value and we force the D1/D2 depth ratio to be the same for each component. Including the continuum level, there are therefore 11 fitting parameters for 123–308 spectral channels (depending on the dispersion of each spectrum). We list the fit results in Table 1.
While the equivalent widths (EWs) of components A and C appear to change somewhat across the three spectra, in fact these components are so badly blended in the ARC and HET spectra that the individual EWs are not very well determined. Instead of measuring the EWs of these components separately with the Gaussian profile fits, we directly integrate the spectra from 5921.50 Å to 5922.22 Å. The combined EWs of components A and C in the three epochs are mÅ, mÅ, and mÅ.333All Na I EWs in this paper are given for the D2 component. The D1/D2 depth ratio (and therefore the D1/D2 EW ratio) is 0.64. We therefore conclude that there is no change in these absorption lines to a 3 limit of 18 mÅ over the course of the observations. We estimate that the Na I column density for components A and C is cm-2 (assuming a Doppler parameter of km s-1; see Table 1), and the change in the column between 4 d before and 24 d after maximum light is no larger than cm-2. The strength of component B, which is reasonably well separated from the other two, does not change within the uncertainties over the course of the observations, and we estimate a Na I column density of cm-2 for this component. We place 5 upper limits on the presence of additional unresolved absorption components at other velocities of 15 mÅ, 8 mÅ, and 7 mÅ (9, 5, and cm-2) for the ARC, HET, and Keck spectra, respectively. In contrast, the time-variable features in SN 2006X reached Na I column densities of up to cm-2 (Patat et al., 2007a).
3.3. Calcium H&K Absorption Lines at High Resolution
The APO and Keck spectra extend far enough to the blue that we also detect Ca II H&K absorption lines in both the Milky Way and NGC 5584. We fit the four sets of lines simultaneously using the same technique as in §3.2. As with the Na lines, the host-galaxy absorption can be well fitted with two or possibly more components. Their velocities and relative strengths, however, differ significantly from those of the Na absorption components. The Ca absorption systems have heliocentric velocities of 1643 and 1613 km s-1, and the higher-velocity system is approximately 3 times as strong as the lower-velocity system (EWs of and mÅ in the Ca II K line, respectively). These results suggest that the various absorbing clouds along this line of sight have different abundances and/or ionization states. Although the higher-velocity component appears somewhat deeper and the lower-velocity component appears narrower in the Keck spectrum than in the APO data, we do not detect any statistically significant changes in the absorption line equivalent widths between the two epochs.
3.4. Limits on H Emission
The ARC and HET spectra cover the expected wavelength of the redshifted H line. We detect an H emission line in both spectra with a velocity of 1641 km s-1 and a full width at half-maximum (FWHM) of 16 km s-1. In the earlier, but lower S/N, ARC spectrum ( d) we measure an EW for the H emission of mÅ, and in the HET spectrum ( d) we measure an EW of mÅ. At these epochs, the supernova had -band magnitudes of and , respectively. Within the uncertainties, therefore, the H flux did not change between the two observations. While H emission could be a signature of CSM, we also find weak [N II] 6583 and [S II] 6717 features at the same velocity. The presence of these additional lines, the lack of variability in the H flux, and the close agreement between the host-galaxy velocity and the H velocity suggest instead that the emission is coming from a nearby H II region.
Assuming that the detected emission lines come from the host galaxy rather than the supernova, we place an upper limit on the H emission from the SN of 22 mÅ (5 limit for a line width of 50 km s-1) at d and 33 mÅ at d. Although the high-resolution spectra are not flux-calibrated, we can estimate the H limits in flux units by scaling the continuum flux level to the observed -band magnitudes. We calculate an upper limit to the H flux of erg cm-2 s-1 ( erg s-1). Using the model of Cumming et al. (1996), the corresponding upper limit on the mass-loss rate in the progenitor system is not very restrictive ( M⊙ yr-1). Several other nearby SNe Ia have comparable or better limits from H observations (Cumming et al., 1996; Mattila et al., 2005; Patat et al., 2007a).
4. DISCUSSION AND CONCLUSIONS
Our observations of Na absorption lines in §3.2 can be used to estimate the amount of hydrogen along the line of sight to SN 2007af. The total measured Na I column density is cm-2. The corresponding hydrogen column is cm-2 for a solar Na abundance of 12 + log(Na/H) (Asplund et al., 2005), where N(Na I)/N(Na) is the Na ionization fraction. If this material were all located in the SN progenitor system in a thin shell with a radius of cm (as suggested by Patat et al. 2007a for SN 2006X), the shell mass would be M⊙.
However, because of the lack of variations in the column density of the detected absorption lines and their close agreement with the host-galaxy velocity, the absorbing gas is more likely associated with the interstellar medium of NGC 5584. In that case, the relevant calculation for the mass of the CSM is based on the upper limits for additional absorption components. Using the 5 upper limits on the Na I column density of 9, 5, and cm-2 for the three spectroscopic epochs and the assumptions given above, we find corresponding upper limits on the shell masses of , , and M⊙, respectively. For comparison, Patat et al. (2007a) estimated a shell mass of M⊙ for SN 2006X with the same model. If the circumstellar Na ions have not yet fully recombined by the time of our observations, then the true CSM mass could be significantly higher, but for SN 2006X substantial recombination had occurred within 2 weeks of maximum light.
There are two primary ways to interpret the absence of variable absorption features in SN 2007af. First, the progenitor system may differ from the red-giant companion in a recurrent nova model that Patat et al. (2007a) proposed for SN 2006X. In particular, Wang et al. (2007) found that SN 2006X has the highest expansion velocity ever measured for a SN Ia, which raises the possibility that varying Na I D absorption features (and hence the proposed recurrent nova progenitors) could be associated with the subgroup of high velocity gradient SNe Ia (Benetti et al., 2005). If this conjecture is correct, it would suggest that the companion to the SN 2007af progenitor was either a main-sequence star, a subgiant, or another C/O white dwarf, leaving the progenitor system relatively free of circumstellar gas and dust.
Alternatively, the observational differences between the Na D lines in SNe 2007af and 2006X could be a result of the system geometry. If the mass lost by recurrent novae is concentrated in the orbital plane of the system, as appears to be the case for RS Oph (O’Brien et al., 2006; Bode et al., 2007), then lines of sight that do not pass near the orbital plane would miss most of the circumstellar material. Such a configuration would allow the progenitor systems of SNe 2006X and 2007af to be the same, as long as the viewing geometry is different.
Monitoring of the Na D lines in a larger sample of SNe Ia will clarify the geometrical constraints, including possible additional geometries for the CSM. It will also allow us to examine whether the presence or absence of variable absorption is related to any other observed properties of the objects.
References
- Asplund et al. (2005) Asplund, M., Grevesse, N., & Sauval, A. J. 2005, in ASP Conf. Ser. 336, Cosmic Abundances as Records of Stellar Evolution and Nucleosynthesis, ed. T. G. Barnes III & F. N. Bash (San Francisco, ASP), 25
- Benetti et al. (2006) Benetti, S., Cappellaro, E., Turatto, M., Taubenberger, S., Harutyunyan, A., & Valenti, S. 2006, ApJ, 653, L129
- Benetti et al. (2005) Benetti, S., et al. 2005, ApJ, 623, 1011
- Bode et al. (2007) Bode, M. F., Harman, D. J., O’Brien, T. J., Bond, H. E., Starrfield, S., Darnley, M. J., Evans, A., & Eyres, S. P. S. 2007, ApJ, in press (preprint at ArXiv e-prints, 706, arXiv:0706.2745)
- Branch et al. (1983) Branch, D., Lacy, C. H., McCall, M. L., Sutherland, P. G., Uomoto, A., Wheeler, J. C., & Wills, B. J. 1983, ApJ, 270, 123
- Cumming et al. (1996) Cumming, R. J., Lundqvist, P., Smith, L. J., Pettini, M., & King, D. L. 1996, MNRAS, 283, 1355
- Filippenko (1997) Filippenko, A. V. 1997, ARAA, 35, 309
- Filippenko (2005) —— 2005, in White Dwarfs: Cosmological and Galactic Probes, ed. E. M. Sion, S. Vennes, & H. L. Shipman (Dordrecht: Springer), 97
- Filippenko et al. (2001) Filippenko, A. V., Li, W. D., Treffers, R. R., & Modjaz, M. 2001, in ASP Conf. Ser. 246, Small Telescope Astronomy on Global Scales, ed. W. P. Chen, C. Lemme, & B. Paczyński (San Francisco: ASP), 121
- Hamuy et al. (2003) Hamuy, M., et al. 2003, Nature, 424, 651
- Howell et al. (2005) Howell, D. A., et al. 2005, ApJ, 634, 1190
- Jha et al. (2007) Jha, S., Riess, A. G., & Kirshner, R. P. 2007, ApJ, 659, 122
- Koribalski et al. (2004) Koribalski, B. S., et al. 2004, AJ, 128, 16
- Leibundgut (2004) Leibundgut, B. 2004, Ap&SS, 290, 29
- Li et al. (2000) Li, W. D., et al. 2000, in AIP Conf. Ser. 522, Cosmic Explosions, ed. S. S. Holt & W. W. Zhang (New York: AIP), 103
- Li et al. (2001) —— 2001, PASP, 113, 1178
- Li et al. (2003) —— 2003, PASP, 115, 453
- Mannucci et al. (2005) Mannucci, F., Della Valle, M., Panagia, N., Cappellaro, E., Cresci, G., Maiolino, R., Petrosian, A., & Turatto, M. 2005, A&A, 433, 807
- Mannucci et al. (2006) Mannucci, F., Della Valle, M., & Panagia, N. 2006, MNRAS, 370, 773
- Mattila et al. (2005) Mattila, S., Lundqvist, P., Sollerman, J., Kozma, C., Baron, E., Fransson, C., Leibundgut, B., & Nomoto, K. 2005, A&A, 443, 649
- Miller & Stone (1993) Miller, J. S., & Stone, R. P. S. 1993, Lick Obs. Tech. Rep. 66
- Nakano & Itagaki (2007) Nakano, S., & Itagaki, K. 2007, IAU Circ., 8817, 3
- O’Brien et al. (2006) O’Brien, T. J., et al. 2006, Nature, 442, 279
- Patat et al. (2007a) Patat, F., et al. 2007a, Science, 317, 924
- Patat et al. (2007b) Patat, F., et al. 2007b, A&A, in press (preprint at ArXiv e-prints, 708, 0708.3698)
- Perlmutter et al. (1999) Perlmutter, S., et al. 1999, ApJ, 517, 565
- Quimby et al. (2007) Quimby, R., Höflich, P., & Wheeler, J. C. 2007, ApJ, in press (preprint at ArXiv e-prints, 705, arXiv:0705.4467)
- Riess et al. (1998) Riess, A. G., et al. 1998, AJ, 116, 1009
- Riess et al. (2007) Riess, A. G., et al. 2007, ApJ, 659, 98
- Salgado et al. (2007) Salgado, F., Hamuy, M, Morrell, N., & Folatelli, G. 2007, CBET 865, 1
- Scannapieco & Bildsten (2005) Scannapieco, E., & Bildsten, L. 2005, ApJ, 629, L85
- Schlegel et al. (1998) Schlegel, D. J., Finkbeiner, D. P., & Davis, M. 1998, ApJ, 500, 525
- Stetson (1987) Stetson, P. B. 1987, PASP, 99, 191
- Sullivan et al. (2006) Sullivan, M., et al. 2006, ApJ, 648, 868
- Tull (1998) Tull, R. G. 1998, Proc. SPIE, 3355, 387
- Vogt et al. (1994) Vogt, S. S., et al. 1994, Proc. SPIE, 2198, 362
- Wang et al. (2003) Wang, S., et al. 2003, Proc. SPIE, 4841, 1145
- Wang et al. (2007) Wang, X., et al. 2007, submitted to ApJ (preprint at ArXiv e-prints, 708, arXiv:0708.0140)
- Welty & Fitzpatrick (2001) Welty, D. E., & Fitzpatrick, E. L. 2001, ApJ, 551, L175
| Component A | Component B | Component C | ||||||||
|---|---|---|---|---|---|---|---|---|---|---|
| Spectrum | VelocityaaVelocities are in the heliocentric frame. | FWHM | EW | VelocityaaVelocities are in the heliocentric frame. | FWHM | EW | VelocityaaVelocities are in the heliocentric frame. | FWHM | EW | |
| [km s-1] | [km s-1] | [mÅ] | [km s-1] | [km s-1] | [mÅ] | [km s-1] | [km s-1] | [mÅ] | ||
| ARC | bbAccording to the fit this line is unresolved, so we cannot establish an uncertainty on the line width. | 0.74 | ||||||||
| HET | 1.68 | |||||||||
| Keck | 1.33 | |||||||||