Broadband dielectric response of CaCu3Ti4O12: From dc to the electronic transition regime
Abstract
We report on phonon properties and electronic transitions in CaCu3Ti4O12, a material which reveals a colossal dielectric constant at room temperature without any ferroelectric transition. The results of far- and mid-infrared measurements are compared to those obtained by broadband dielectric and millimeter-wave spectroscopy on the same single crystal. The unusual temperature dependence of phonon eigenfrequencies, dampings and ionic plasma frequencies of low lying phonon modes are analyzed and discussed in detail. Electronic excitations below 4 eV are identified as transitions between full and empty hybridized oxygen-copper bands and between oxygen-copper and unoccupied Ti 3 bands. The unusually small band gap determined from the dc-conductivity meV) compares well with the optical results.
pacs:
63.20.-e, 78.30.-j, 77.22.ChI Introduction
After first reports of very large dielectric constants of order up to in CaCu3Ti4O12 (CCTO) in ceramic samples, Subramanian et al. (2000) single crystals, Homes et al. (2001) and thin films, Si et al. (2002) experimental evidence has been provided that these colossal values have their origin in Maxwell-Wagner like relaxation phenomena, characteristic for inhomogeneous media. Planar defects in single crystals or grain boundaries in ceramics Sinclair et al. (2002) as well as contact phenomena and surface effects Lunkenheimer et al. (2002, 2004); Krohns et al. (2007) were considered as possible sources for the unconventional dielectric response in CCTO. However, also intense search for intrinsic mechanisms still keeps going on, an example being a recent report on nanoscale Ca/Cu disorder.Zhu et al. (2007)
In addition to this unsettled dispute about the origin of colossal dielectric constants in CCTO, another interesting phenomenon was detected: The dielectric constant as measured by far-infrared (FIR) spectroscopy is as large as 80 at room temperature and increases with decreasing temperature Homes et al. (2001, 2003) contrary to what is expected for a normal anharmonic solid. This effect was investigated in some detail by Homes et al.Homes et al. (2003) and explained in terms of charge-transfer processes.
The present investigation deals with the following topics: i) The complete phononic response, which has been measured by FIR spectroscopy as function of temperature, is analyzed in full detail: eigenfrequencies, dampings, and ionic plasma frequencies are determined for all modes to study the unusual temperature dependence. Our results are compared to published results Homes et al. (2001, 2003) and to model calculations of the lattice dielectric response of CCTO from first principles.He et al. (2002, 2003); McGuinness et al. (2005) ii) Within the low frequency reflectivity spectrum, which is dominated by phonon modes, we detect an unusually large number of crossing points in the reflectivity (), which seems to be too significant to be ignored or to be explained by accidental effects. iii) Electronic excitations for energy transfers up to 4 eV are studied via the dynamic conductivity and are compared to ab-initio band structure calculations.He et al. (2002) iv) The dynamic conductivity and dielectric constant from infrared and millimeter-wave spectroscopy are directly compared to broadband dielectric results to visualize the full dielectric response of CCTO to electromagnetic fields over 15 decades in frequency and finally, v), we derive the band gap from the dc conductivity obtained from the dielectric results and find good agreement with the theoretically predicted optical band gap, which is in accord with the IR results.
II Experimental details
Single crystals were grown by the floating-zone technique using a growth furnace equipped with two 1000 W halogen lamps, with the radiation focused by gold-coated ellipsoidal mirrors.Krohns et al. (2007) Polycrystalline bars, prepared as reported in Ref. Lunkenheimer et al., 2004, cold-pressed and sintered in air for 12 h at 1000∘C, served as seed and feed rods. The rods were rotated with a speed of 30 rpm, while the feed was kept still. The growth rate was adjusted to 5 mm/h. Crystal growth was performed in oxygen (flow rate 0.2 l/min) at a pressure of 4 bar, to avoid thermal reduction of copper. High purity single crystals with a lattice constant of 0.7391 nm and free of impurity phases were obtained. CaCu3Ti4O12 belongs to a unique class of perovskite derived structures in which the TiO6 octahedra are strongly tilted to form an ideal square planar coordination for the Cu cations.Bochu et al. (1979) The tilting of the octahedra and the concomitant non-cubic site symmetry of Ti4+ strongly reduces the possibilities for off-center displacements and rules out long-range polar order of the Ti ions. Thus this class of compounds usually does not display ferroelectricity.Subramanian et al. (2000)
For the dielectric measurements silver paint contacts were applied to opposite faces of the disc like single crystals. The complex dielectric permittivity as function of temperature was measured over nine frequency decades from 1 Hz up to 1.3 GHz (for experimental details see Ref. R. Böhmer et al., 1989). Additional measurements using a quasioptic spectrometer in Mach-Zehnder configuration were performed in a frequency range from 60 to 120 GHz.Gorshunov et al. (2005) In the far- and mid-infrared range, reflectivity measurements were carried out using the Bruker Fourier-transform spectrometers IFS 113v and IFS 66v/S, which both are equipped with He bath cryostats. In most cases the reflectivity spectra were directly analyzed using a generalized oscillator model with four parameters per phonon mode.Gervais (1983); Kuzmenko To calculate the dielectric loss from the experimentally obtained reflectivity, we used a smooth extrapolation to high frequencies. The low-frequency extrapolation was based on the measured dielectric data.
III Results and Analysis
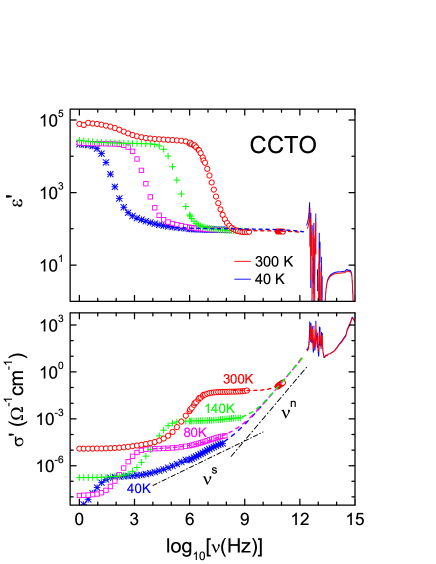
A survey of the dielectric constant and the dynamic conductivity over 15 decades in frequency is shown in Fig. 1 for temperatures between 40 K and 300 K. Fig. 1 impressively documents how, at least at room temperature, the “relaxational” dielectric response for frequencies below 10 GHz is decoupled from the ionic ( Hz - Hz) and from the electronic ( Hz) processes. The upper frame indicates that the relatively high intrinsic dielectric constant of the order of 100 detected at the higher frequencies and lower temperatures of the dielectric experimentsSubramanian et al. (2000); Homes et al. (2001); Sinclair et al. (2002); Lunkenheimer et al. (2002); Krohns et al. (2007) can be ascribed to the ionic polarizability. , defined as beyond the phonon modes and determined by the electronic polarizability only, is well below 10. The intrinsic conductivity of CCTO in the lower frame of Fig. 1, specifically at 40 K, follows a universal behavior where the dc conductivity with at low frequencies is followed by Jonscher’s universal dielectric response with (Ref. Jonscher, 1977) and by a super linear power-law with at even higher frequencies. Fits using this approach are indicated as dashed lines for and in Fig. 1. This sequence of dc, as well as sub-linear and super-linear ac conductivity regimes has been observed in a number of disordered semiconductors and transition-metal oxides.Lunkenheimer and Loidl (2003)
III.1 Phonon excitations
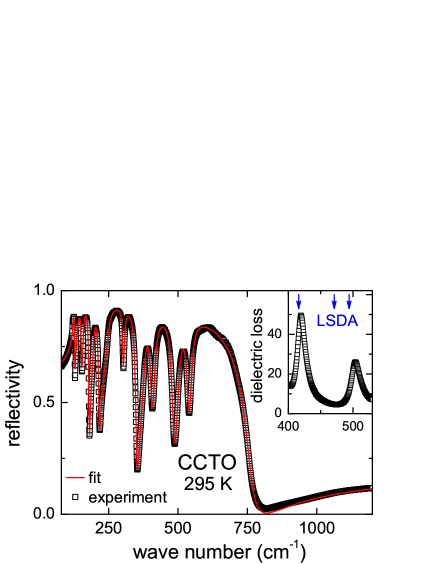
Fig. 2 shows the measured reflectivity of CCTO at 295 K including the results of a fit using ten oscillators described by four parameters each.Gervais (1983) The theoretical modeling which has been used in this work is outlined in detail in Ref. Rudolf et al., . For each phonon mode the fit parameters are the transverse optical (TO) and longitudinal optical (LO) eigenfrequencies and and the damping functions and . In addition, the electronic polarizability is taken into account by , which is treated as free parameter. This model yields an almost perfect description of all eigenmodes as observed in the reflectivity spectrum. Similar results have been obtained for a series of measurements at different temperatures down to 5 K. From fits up to 2000 cm-1 , which is due to electronic polarizability only, has been determined. obtained from these fits was found to scatter between 6 and 7, with no systematic temperature variation. Hence, for all further analysis we used an average value of 6.5 for all temperatures. A list of the LO and TO mode frequencies and dampings as well as the effective ionic plasma frequencies and the dielectric strengths are given in Tab. 1. For the definition of plasma frequency and dielectric strength see Ref. Rudolf et al., . The experimental results documented in Tab. 1 compare reasonably well with first-principle calculations of the TO eigenfrequencies of CCTO within local spin-density approximation (LSDA) by He et al.,He et al. (2003) which are shown in the second row of Tab. 1. All experimentally observed eigenfrequencies lie in a frequency range of approximately 10 cm-1 when compared to the theoretical predictions. However a mode of moderate strength, predicted to occur at 471 cm-1 (Ref. He et al., 2003) is fully missing in the reflectivity data. Indeed while the symmetry of the crystal allows for 11 IR-active modes, only ten are observed experimentally. A closer look into Fig. 2 shows that fit and experimental result almost coincide and it is hard to believe that an extra mode of considerable strength can be hidden in this reflectivity spectrum, if not two eigenfrequencies are accidentally degenerated within 5 cm-1. To check this possibility in more detail, the inset of Fig. 2 shows the dielectric loss vs. wave number in the frequency range from 400 to 530 cm-1. The arrows in the inset indicate the eigenfrequencies as theoretically predicted. While theory meets the modes close to 420 and 500 cm-1 there is not the slightest indication of an additional mode close to 471 cm-1. Due to the rather low intensity of the mode close to 500 cm-1, it seems unreliable that the missing mode is hidden underneath it. This obvious disagreement between theory and experiment remains to be settled.
| mode | (cm-1) | (cm-1) | (cm-1) | ||||
|---|---|---|---|---|---|---|---|
| 5 K | LSDAHe et al. (2003) | TO | LO | TO | LO | ||
| 1 | 125 | 119.2 | 129.8 | 11.8 | 1.3 | 478.2 | 16.1 |
| 2 | 135 | 134.5 | 152.7 | 5.2 | 2.5 | 591.1 | 19.4 |
| 3 | 158 | 158.1 | 181.1 | 4.2 | 2.4 | 630.7 | 15.9 |
| 4 | 199 | 195.1 | 216.1 | 5.2 | 4.7 | 599.3 | 9.4 |
| 5 | 261 | 250.4 | 303.9 | 11.9 | 3.4 | 914.6 | 13.3 |
| 6 | 310 | 307.7 | 352.9 | 4.5 | 4.3 | 799.9 | 6.8 |
| 7 | 385 | 382.9 | 407.7 | 8.8 | 5.5 | 608.7 | 2.5 |
| 8 | 416 | 421.3 | 487.3 | 9.1 | 12.2 | 920.6 | 4.8 |
| 9 | 471 | ||||||
| 10 | 494 | 506.9 | 542.4 | 13.2 | 10.2 | 677.9 | 1.8 |
| 11 | 547 | 551.6 | 760.3 | 10.2 | 32.2 | 1333.8 | 5.8 |
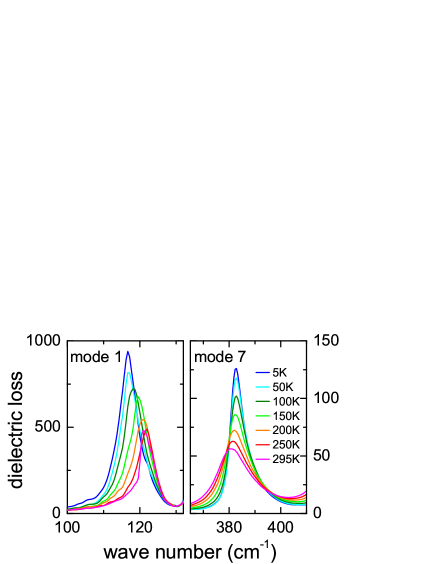
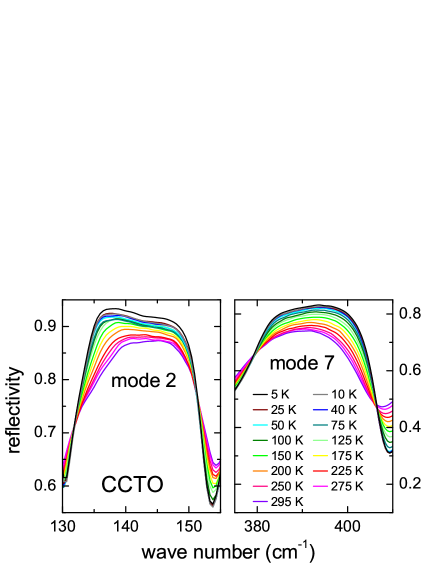
In the following we will address the different phonon modes with numbers as indicated in Tab. 1. A closer inspection of this table reveals rather unusual details. Specifically, for modes 1 and 5, is much larger compared to , contrary to what is expected in a canonical anharmonic solid. This may be at least partly related to the unconventional temperature dependence of eigenfrequencies and damping (see below). In what follows we will give a detailed description of the temperature dependence of some of the polar phonon modes in CCTO. The modes can be grouped into two fractions: the first 5 modes reveal an unusual temperature dependence which cannot be explained by normal anharmonic effects.Cowley (1963) Phonons number six up to number eleven can be classified as phonon excitations of a classical anharmonic solid. As prototypical examples, Fig. 3 shows the dielectric loss of phonon 1 and phonon 7 as function of wave number for a series of temperatures. With decreasing temperature, phonon 1 which lies close to 120 cm-1 at room temperature, broadens, shifts to lower frequencies and strongly increases in dielectric strength. On the contrary phonon 7, which appears close to 380 cm-1 at 295 K, becomes narrow and shifts to higher frequencies on lowering the temperature, a behavior reflecting anharmonicity due to phonon-phonon scattering processes. As will be shown later, in this case the dielectric strength almost remains constant which is expected in a purely ionic solid with no charge transfer processes and no ferroelectric instability.
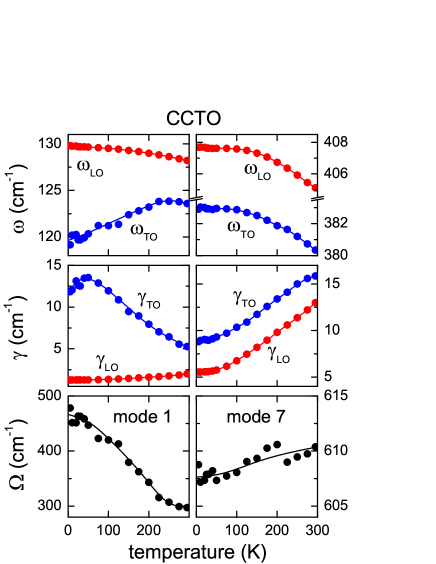
The results of a detailed 4-parameter analysis are documented in Fig. 4: LO and TO eigenfrequencies (upper frames) and dampings (middle frames), as well as the ionic plasma frequencies (lower frames) are shown for phonon 1 (left frames) and phonon 7 (right frames). For mode 1 the TO mode softens considerably and its damping is unusually large and increases on decreasing temperature. As has been documented already by Homes et al.,Homes et al. (2001, 2003) the plasma frequency increases by as much as 60% when the temperature is lowered from room temperature down to 5 K. On the other hand, mode 7 shows conventional behavior. LO and TO eigenfrequencies slightly increase and the inverse life times decrease when temperature is lowered. The plasma frequency almost remains constant at a value of (609 2) cm-1, which certainly is within the experimental uncertainties. As the ionic plasma frequency, which corresponds to the effective charges, is proportional to the difference of the squared LO and TO eigenfrequencies, it is obvious that the increase of the plasma frequency of mode 1 predominantly corresponds to the softening of the transverse optic mode (see upper left frame in Fig. 4). At present it is unclear whether this observation indicates an underlying ferroelectric instability or points towards charge transfer processes as driving forces.
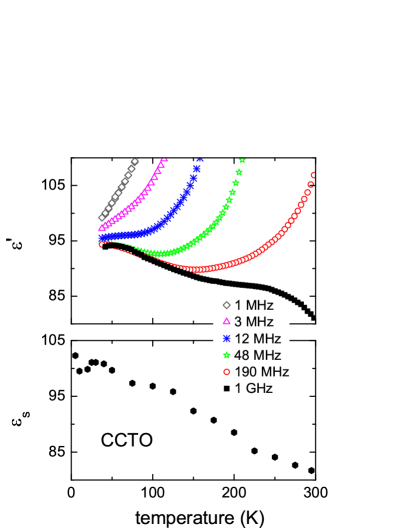
As documented in Tab. 1 for 5 K, we calculated the dielectric strength for all modes and determined these values as function of temperature. The lower frame in Fig. 5 shows the static dielectric constant , which corresponds to plus the sum over the dielectric strengths of all modes. According to this FIR result, increases from 83 at room temperature to approximately 100 at low temperatures. This has to be compared to measurements of the dielectric constant at GHz frequencies, which corresponds to the intrinsic static dielectric constant. These results are documented in the upper frame of Fig. 5. The GHz dielectric constant indeed roughly follows the FIR results, especially it shows similar temperature dependence. The strong increase of as detected at lower frequencies corresponds to Maxwell-Wagner like effects.Lunkenheimer et al. (2002, 2004); Krohns et al. (2007)
In discussing the phonon properties we would like to point towards another interesting phenomenon, whose nature and origin are unclear at present. Each pair of TO and LO modes creates a rectangular shaped band in the reflectivity: In an ideal harmonic solid one would expect that the reflectivity is close to unity between the TO and the LO modes. The decrease of with increasing temperature follows from an increasing anharmonicity. In the temperature dependent reflectivity spectra of CCTO, each band exhibits two striking crossing points. In optical spectroscopy of chemical species, a so-called isosbestic point usually defines a point on the wavelength scale, where two species have exactly the same absorption. Isosbestic points have sometimes also been identified in the dynamical conductivity of transition metal oxides and were explained in terms of spectral weight transfer driven by strong electronic correlations.Okimoto et al. (1995) Quite generally it can be stated that whenever a system can be described by a superposition of two components with dynamic quantities which only depend linearly on density, isosbestic points are expected to occur.Eckstein et al. (2007) In particular this also applies to the temperature dependence as long as the total density is constant. In our case each reflectivity band exhibits two wavelengths where the reflectivity exactly is temperature independent, i.e. . As an example Fig. 6 shows the reflectivity at around 140 and 390 cm-1. Close to each TO and LO mode we find these crossing points where indeed the reflectivity is temperature independent within experimental uncertainty. Again we would like to stress that similar observations can be made for each reflectivity band of CCTO. At present, however, it is unclear how the reflectivity of CCTO can be described by the interaction of light with two components. One could think of microscopic (electronic) phase separation. Indeed reports on nanoscale disorder of Cu and Ca sites from x-ray absorption fine structure measurementsZhu et al. (2007) and reports of the coexistence of strained and unstrained domains by scanning electron microscopy Fang and Liu (2005) provide some arguments in favor of this explanation. One also could speculate that in CCTO the CuO2 planes and the TiO6 octahedra behave like two independent components being responsible for the occurrence of isosbestic points in all absorption bands.
III.2 Electronic exitations
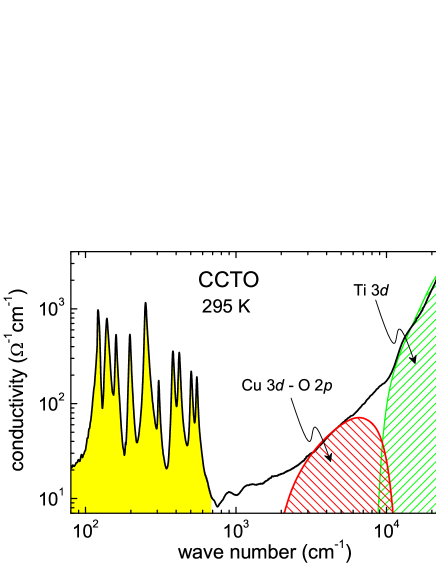
Finally we studied the low-lying electronic transitions up to 30000 cm-1, corresponding to an energy of 3.8 eV. The results are documented in Fig. 7, which shows the real part of the dynamic conductivity vs. wave number on a double-logarithmic scale. The spectral response below 700 cm-1 is dominated by the phonon response. Beyond the phonon regime the conductivity gradually increases up to 10000 cm-1 and then shows a stronger increase with a peak close to 24000 cm-1 corresponding to 3.0 eV. We would like to stress that the conductivity below 1 eV () is relatively small (note the double logarithmic scale of Fig. 7) and slightly depends on the extrapolation scheme beyond 4 eV, used for the Kramers-Kronig analysis. However, all reasonable extrapolations yield similar results with only slight differences in the tail towards the lowest frequencies. When comparing our results to first principle density-functional theory within the local spin-density approximation (LSDA) from He et al.,He et al. (2002) we identify the continuous increase of the conductivity from about 2000 cm-1 to 10000 cm-1 with transitions between the empty and filled strongly hybridized Cu 3 and O 2 orbitals. The filled bands are located just below the Fermi level while the empty states extend up to 0.7 eV with a maximum close to 0.5 eV and an onset at about 0.25 eV, which corresponds to approximately 2000 cm-1. According to theory, the dominant peak close to 24000 cm-1 ( eV), observed in Fig. 7, can be identified with transitions into predominantly -derived empty states from the Ti ions. In the LSDA calculations this Ti 3 band of mainly character extends from 1.5 to 3.5 eV with a peak maximum close to 2.8 eV. Thus, overall the dynamical conductivity at high frequencies could be determined by the superposition of two electronic transition bands located at around 0.75 eV and 3.0 eV as schematically indicated by the hatched areas in Fig. 7. It should be noted that the conductivity tail due to transitions between the hybridized copper-oxygen bands extends to rather low frequencies. In the chosen double-logarithmic plot, the band gap should be read off at a limiting vertical decrease of at low frequencies. This is not observed in the data, most likely due to the mentioned uncertainties at very low conductivity values or possible phonon tails as expected for indirect transitions. Clearly, while our results are not a proof of the bandstructure of CCTO, they at least are compatible with the LSDA calculations, especially concerning the predicted small band gap.He et al. (2002)
It can be expected, that this optical band gap also determines the dc conductivity. In Fig. 8 we show the conductivity of CCTO deduced from the dielectric experiments over 9 decades of frequency for a series of temperatures.Krohns et al. (2007) At high frequencies and low temperatures of CCTO is dominated by ac conductivity, resulting in a power-law increase towards the highest frequencies. At the highest temperatures the conductivity in the MHz to GHz range is purely of dc type and independent of frequency. Towards lower frequencies, the well-known Maxwell-Wagner relaxation leads to a step like decrease of . The dc plateaus for each temperature can easily be identified. At 40 K the dc plateau is located between 50 Hz and 10 kHz and shifts to higher frequencies with increasing temperature. It is located beyond 10 MHz for 300 K. These dc conductivity plateaus also show up in the lower frame in Fig. 1.
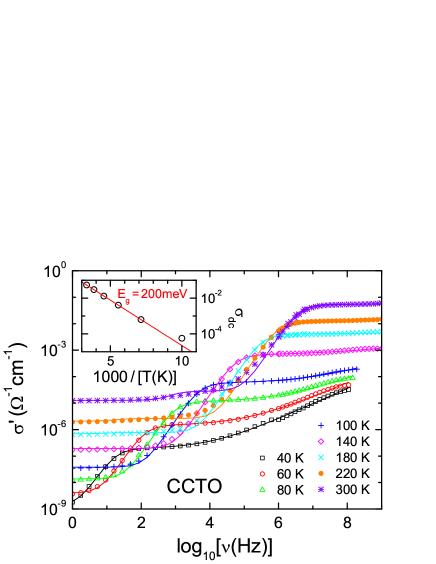
The complex frequency-temperature dependence of the conductivity can only be exactly analyzed utilizing an equivalent-circuit analysis including elements for the bulk sample and surface layers. The solid lines in Fig. 8 result from fits assuming two circuits for two types of barriers (e.g., external and internal) and one circuit including ac conductivity for the bulk sample. For details see Refs. Lunkenheimer et al., 2002, Lunkenheimer et al., 2004, and Krohns et al., 2007. The resulting dc conductivity at K is indicated in the inset of Fig. 8 in an Arrhenius type of presentation. The energy barrier derived from the Arrhenius fit is of the order of 200 meV, in good agreement with the theoretical band gap and consistent with the optical results (cf. Fig. 7). Here we assumed an intrinsic semiconductor with constant mobility and a charge-carrier density proportional to . At lower temperatures, deviations from Arrhenius behavior show up, which may be ascribed to hopping conductivity of localized charge carriers as will be discussed in a forthcoming paper. krohns07b
IV Concluding remarks
In summary, our detailed optical characterization of CCTO and the comparison with broadband dielectric spectroscopy performed on the same single crystal revealed a number of unusual properties of this material, in addition to the well-known colossal dielectric constants.
We analyzed in detail the temperature dependence of the phonon modes and determined LO and TO eigenfrequencies and dampings as well as the ionic plasma frequencies. The low lying modes (numbers 1 to 5, see Table 1) do not behave like phonons of normal anharmonic solids. The TO modes soften and the plasma frequencies strongly increase. At present it is unclear if this is due to an underlying ferroelectric instability, which however does not lead to a transition even for lowest temperatures or if this indicates significant charge-transfer processes as has been assumed by Homes et al..Homes et al. (2003) The phonon modes which are higher in frequency (numbers 6 to 11) exhibit canonical behavior; i.e. eigenfrequencies and dampings reveal a temperature dependence characteristic for an anharmonic solid, which is dominated by phonon-phonon interactions. The damping of the TO mode at 120 cm-1 shows a cusp close to the antiferromagnetic phase transition. In CCTO the Cu2+ 3 electrons constitute almost localized spins, which undergo Neel ordering close to K.Kim02 In strongly correlated electron systems often strong spin-phonon coupling is observed.Rudolf et al. In CCTO, however, only mode 1 shows an anomaly at and overall it seems that the phonons are not strongly coupled to the spin system.
The static dielectric constant arising from the phonon modes as derived from the measurements of this work increases from roughly 80 at room temperature to approximately 100 at 5 K. It nicely scales with the dielectric constants measured at 1 GHz by dielectric spectroscopy. The purely electronic polarizability leads to .
As function of temperature, each reflectivity band exhibits significant crossing points. At these “isosbestic” points the reflectivity is completely independent of temperature. The implications for eigenfrequencies, dampings, and strengths are unclear. These crossing points are too significant and too well defined to be explained by trivial effects of the temperature dependence of the phonon modes. Isosbestic points are usually explained as being due to two components with constant total density. An identification of two components in CCTO is not straightforward and these crossing points await a deeper theoretical analysis.
Finally, we summed up the effective plasma frequencies for all modes, which must correspond to the ratio of the squared effective charges and the mass of all ions in the unit cell (see, e.g., Ref. Rudolf et al., ). Experimentally we find a value of , compared to the theoretical value of 2700 cm-1 that assumes ideal ionicity for all atoms. In calculating the ionic plasma frequency of CCTO, the main contributions result from Ti4+ and O2- while Ca2+ and Cu2+ ions contribute less than 1%. The fact that the experimentally observed plasma frequency is so close to that calculated for an ideal ionic solid, demonstrates that at least the TiO6 octahedra are purely ionically bonded while the Cu-O subsystem can reveal partly covalent bonds. This seems to be in accord with the LSDA calculations. He et al. (2002, 2003)
The strong ionicity and the weak hybridization between the oxygen 2 levels and the titanium 3 statesHe et al. (2002) indicate that the underlying nature of the anomalies in CCTO are different to the origin of ferroelectricity in perovskite oxides: These model ferroelectrics require strong hybridization, charge distortion, and covalency.Cohen (1992) However also alternative routes to ferroelectricity were proposed, taking into account the strong polarizability of the O2- ionMigoni et al. (1976) and recently an attempt has been made to explain the optical response of CCTO utilizing these ideas.Bussmann-Holder and Bishop (2003)
The dynamic conductivity beyond the phonon modes is consistent with two electronic excitations as theoretically predicted from LSDA band structure calculations.He et al. (2002) They can be ascribed to transitions from the filled hybridized O 2 and Cu 3 bands to the empty O 2/Cu 3 states and to the empty Ti 3 orbitals, arsing close to 0.75 eV and 3.0 eV, respectively.
Acknowledgements.
This research was supported by the European Commission via STREP: NUOTO, NMP3-CT-2006-032644 and partly by the Collaborative Research Program, SFB 484 (Augsburg). Stimulating discussions with D. Vollhardt are gratefully acknowledged.References
- Subramanian et al. (2000) M. A. Subramanian, D. Li, N. Duan, B. A. Reisner, and A. W. Sleight, J. Solid State Chem. 151, 323 (2000); A. P. Ramirez, M. A. Subramanian, M. Gardel, G. Blumberg, D. Li, T. Vogt, and S. M. Shapiro, Solid State Commun. 115, 217 (2000); M. A. Subramanian and A. W. Sleight, Solid State Sci. 4, 347 (2002).
- Homes et al. (2001) C. C. Homes, T. Vogt, S. M. Shapiro, S. Wakimoto, and A. P. Ramirez, Science 293, 673 (2001).
- Si et al. (2002) W. Si, E. M. Cruz, P. D. Johnson, P. W. Barnes, P. Woodward, and A. P. Ramirez, Appl. Phys. Lett. 81, 2056 (2002).
- Sinclair et al. (2002) D. C. Sinclair, T. B. Adams, F. D. Morrison, and A. R. West, Appl. Phys. Lett. 80, 2153 (2002); S.-Y. Chung, I.-D. Kim, and S.-J. L. Kang, Nat. Mater. 3, 774 (2004).
- Lunkenheimer et al. (2002) P. Lunkenheimer, V. Bobnar, A. V. Pronin, A. I. Ritus, A. A. Volkov, and A. Loidl, Phys. Rev. B 66, 052105 (2002).
- Lunkenheimer et al. (2004) P. Lunkenheimer, R. Fichtl, S. G. Ebbinghaus, and A. Loidl, Phys. Rev. B 70, 172102 (2004).
- Krohns et al. (2007) S. Krohns, P. Lunkenheimer, S. G. Ebbinghaus, and A. Loidl, Appl. Phys. Lett. 91, 022910 (2007).
- Zhu et al. (2007) Y. Zhu, J. C. Zheng, L. Wu, A. I. Frenkel, J. Hanson, P. Northrup, and W. Ku, Phys. Rev. Lett. 99, 037602 (2007).
- Homes et al. (2003) C. C. Homes, T. Vogt, S. M. Shapiro, S. Wakimoto, M. A. Subramanian, and A. P. Ramirez, Phys. Rev. B 67, 092106 (2003).
- He et al. (2002) L. He, J. B. Neaton, M. H. Cohen, D. Vanderbilt, and C. C. Homes, Phys. Rev. B 65, 214112 (2002).
- He et al. (2003) L. He, J. B. Neaton, D. Vanderbilt, and M. H. Cohen, Phys. Rev. B 67, 012103 (2003).
- McGuinness et al. (2005) C. McGuinness, J. E. Downes, P. Sheridan, P.-A. Glans, K. E. Smith, W. Si, and P. D. Johnson, Phys. Rev. B 71, 195111 (2005).
- Bochu et al. (1979) B. Bochu, M. N. Deschizeaux, J. C. Joubert, A. Collomb, J. Chenavas, and M. Marezio, J. Solid State Chem. 29, 291 (1979); A. Deschanvres, B. Raveau, and F. Tollemer, Bull. Soc. Chim. Fr. 11, 4077 (1967).
- R. Böhmer et al. (1989) R. Böhmer, M. Maglione, P. Lunkenheimer, and A. Loidl, J. Appl. Phys. 65, 901 (1989); U. Schneider, P. Lunkenheimer, J. Hemberger, and A. Loidl, Ferroelectrics 242, 71 (2000).
- Gorshunov et al. (2005) B. Gorshunov, A. Volkov, I. Spektor, A. Prokhorov, A. Mukhin, M. Dressel, S. Uchida, and A. Loidl, Int. J. Infrared and Millimeter Waves 26, 1217 (2005).
- Gervais (1983) F. Gervais, in Infrared and millimeter waves, edited by K. J. Button (Academic Press, New York, 1983), vol. 8, chap. 7, p. 279.
- (17) A. Kuzmenko, Reffit, University of Geneva, URL http://optics.unige.ch/alexey/reffit.html.
- Jonscher (1977) A. K. Jonscher, Nature 267, 673 (1977).
- Lunkenheimer and Loidl (2003) P. Lunkenheimer and A. Loidl, Phys. Rev. Lett. 91, 207601 (2003); P. Lunkenheimer, T. Rudolf, J. Hemberger, A. Pimenov, S. Tachos, F. Lichtenberg, and A. Loidl, Phys. Rev. B 68, 245108 (2003).
- (20) T. Rudolf, Ch. Kant, F. Mayr, J. Hemberger, V. Tsurkan, A. Loidl, arXiv:0707.3776 (unpublished); T. Rudolf, Ch. Kant, F. Mayr, A. Loidl, arXiv:0707.0820 (unpublished).
- Cowley (1963) R. A. Cowley, Adv. Phys. 12, 421 (1963).
- Okimoto et al. (1995) Y. Okimoto, T. Katsufuji, Y. Okada, T. Arima, and Y. Tokura, Phys. Rev. B 51, 9581 (1995).
- Eckstein et al. (2007) M. Eckstein, M. Kollar, and D. Vollhardt, J. Low. Temp. Phys. 147, 279 (2007).
- Fang and Liu (2005) T.-T. Fang and C. P. Liu, Chem. Mater. 17, 5167 (2005).
- (25) S. Krohns, P. Lunkenheimer, S. G. Ebbinghaus, and A. Loidl, unpublished.
- (26) Y. J. Kim, S. Wakimoto, S. M. Shapiro, P. M. Gehring and A. P. Ramirez, Solid State Commun. 121, 625 (2002).
- Cohen (1992) R. E. Cohen, Nature 358, 136 (1992).
- Migoni et al. (1976) R. Migoni, H. Bilz, and D. Bäuerle, Phys. Rev. Lett. 37, 1155 (1976).
- Bussmann-Holder and Bishop (2003) A. Bussmann-Holder and A. R. Bishop, Phys. Rev. B 68, 155104 (2003).