Discovery of new nearby L and late-M dwarfs at low Galactic latitude from the DENIS database.
Abstract
We report new nearby L and late-M dwarfs ( pc) discovered in our search for nearby ultracool dwarfs (, later than M8.0) at low Galactic latitude () over 4,800 square degrees in the DENIS database. We used late-M (M8.0), L, and T dwarfs with accurate trigonometric parallaxes to calibrate the versus colour-luminosity relation. The resulting photometric distances have standard errors of , which we used to select candidates pc. We measured proper motions from multi-epoch images found in the public archives ALADIN, DSS, 2MASS, DENIS, with at least three distinct epochs and time baselines of 10 to 21 years. We then used a Maximum Reduced Proper Motion cutoff to select 28 candidates as ultracool dwarfs (M8.0–L8.0) and to reject one as a distant red star. No T dwarf candidates were found in this search which required an object to be detected in all three DENIS bands. Our low-resolution optical spectra confirmed that 26 of them were indeed ultracool dwarfs, with spectral types from M8.0 to L5.5. Two contaminants and one rejected by the Maximum Reduced Proper Motion cutoff were all reddened F-K main sequence stars. 20 of these 26 ultracool dwarfs are new nearby ultracool dwarf members, three L dwarfs within 15 pc with one L3.5 at only 10 pc. We determine a stellar density of dwarfs pc-3 mag-1 over based on that sample of M8–L3.5 ultracool dwarfs. Our ultracool dwarf density value is in good agreement with the Cruz et al. measurement of the ultracool dwarf density at high Galactic latitude.
keywords:
facility: SSO:2.3m – stars: low mass, brown dwarfs – stars: luminosity function, mass function – techniques: photometric – techniques: spectroscopic – solar neighbourhood.1 INTRODUCTION
Nearby stars are the brightest representatives of their class, and therefore provide observational benchmarks for stellar physics. This is particularly true for intrinsically faint objects, such as stars at the bottom of the main sequence, and brown dwarfs.
In the last decade, many nearby ultracool dwarfs have been discovered by using the DENIS (Epchtein, 1997), 2MASS (Skrutskie et al., 1997), SDSS (York et al., 2000), UKIDSS (Lawrence et al., 2007) surveys (Delfosse et al. 1999; Martín et al. 1999; Phan-Bao et al. 2001, 2003; Reylé et al. 2002; Kirkpatrick et al. 1999; Reid & Cruz 2002; Cruz et al. 2003; Burgasser et al. 2004; Deacon, Hambly & Cooke 2005; Lodieu et al. 2005, 2007; Knapp et al. 2004; Chiu et al. 2006) or the proper motion measurement (Lépine, Shara & Rich 2002).
However, most surveys for nearby ultracool dwarfs have tended to avoid the crowded regions of the Galactic plane. The first systematic search for ultracool dwarfs () was carried out by Reid (2003), he discovered one M8 and reidentified one L1.5 previously discovered by Salim et al. (2003). Hambaryan et al. (2004) reported an M9.0 dwarf 1RXS J115928.5524717 () showing strong X-ray flaring emission. Recently, Folkes et al. (2007) discovered an L-T transition object close in the Galactic plane 2MASS J112639915003550 (L9, ). Four other ultracool dwarfs at low Galactic latitudes () were also discovered: one M8 (Cruz et al. 2003); one L2 (Scholz & Meusinger 2002); one L0 and one L4.5 (Kendall et al. 2007), the latter L4.5 dwarf is actually an L1+L3.5 (Kendall et al., 2007) or L1.5+L4.5 (Burgasser et al., 2007) binary.
These discoveries of ultracool dwarfs in the Galactic plane provide additional targets with which to study the basic physical properties of stars at the bottom of the main sequence and brown dwarfs; however, many remain to be discovered.
In our previous work on an ultracool dwarf search at high Galactic latitude (), we (Phan-Bao et al., 2003) used the Maximum Reduced Proper Motion (MRPM) method to select mid-M dwarfs (, M6.0–M8.0) in the DENIS database. This allowed us to identify not only high proper motion (high-pm, yr-1) M dwarfs, but also some with low proper motion (low-pm, yr-1), such as DENIS-P J1538317103850 (M5.0, mas yr-1). Here we apply the same technique to a search for nearby dwarfs cooler than M8.0 () at low Galactic latitude () in the whole DENIS database (90 complete of the DENIS survey). This corresponds to a sky surface coverage of 4,800 square degrees or 44.9 of the Galactic plane (). In this search, we discovered 20 new ultracool dwarfs and recovered 6 previously known ones, giving a significant fraction of 77 of new ultracool dwarfs in our sample.
We present our versus colour-magnitude relation in Section 2, and review the ultracool dwarf candidate selection in Section 3. We describe the proper motion measurements in Section 4, and the MRPM filtering of the candidates in Section 5. We present our low-resolution optical spectra and further spectral analysis in Section 6. We discuss the completeness of the sample in Section 7 and give a summary in Section 8.


2 COLOUR – MAGNITUDE RELATION
We identified 47 very cool and nearby ( pc) dwarfs in the literature with trigonometric parallaxes and good photometry (e.g. errors smaller than 0.2 mag) (Table 1). For our limited present purpose the DENIS system is close enough to both the Cousins-CIT ( mag, Delfosse 1997) and 2MASS systems ( mag, Carpenter 2001). We therefore ignored the small corrections needed to transform between these photometric systems. We did, on the other hand, transform the magnitudes of (Reid et al., 2001; Burgasser et al., 2003) to , using the linear correction of Reid et al. (2001).
Figure 1 shows the resulting (, ) plot, and the corresponding order polynomial fit:
| (1) | |||||
where , , , , , valid for . The rms dispersion around that fit is 0.30 mag, corresponding to a 14% error on distances.
|
-
Abbreviations.—2M: 2MASS; T*: TVLM; S*: SDSS; D*: DENIS
Cols. (1)–(3): object name, right ascension and declination for equinox J2000 from SIMBAD; col. (4): spectral type; cols. (5)–(7), and (8)–(10): -magnitude, colours and associated standard errors; cols. (11) & (12): trigonometric parallax and its standard error; col. (13): references for columns 4–7, and 11.
References.—(1): Golimowski et al. (2004); (2): DENIS photometry; (3): van Altena, Lee & Hoffleit (1995); (4): Geballe et al. (2002); (5): Kirkpatrick et al. (2000); (6): Gizis et al. (2003); (7): 2MASS photometry; (8): Vrba et al. (2004); (9): Reid et al. (2000); (10): Dahn et al. (2002); (11): Martín et al. (1999); (12): Gizis et al. (2000); (13): Kirkpatrick, Henry & Irwin (1997); (14): Kirkpatrick et al. (1999); (15): Stephens & Leggett (2004); (16): Tinney (1996); (17): Leggett et al. (2001); (18): Fan et al. (2000); (19): Burgasser et al. (2002); (20): HIPPARCOS; (21): Close et al. (2003); (22): Reid et al. (2001); (23): Leggett, Allard & Hauschildt (1998); (24): Monet et al. (1992); (25): Burgasser et al. (2003); (26): Delfosse et al. (2001); (27): Deacon & Hambly (2001); (28): Koerner et al. (1999); (29): McCaughrean et al. (2004).
|
3 SELECTION CRITERIA
We systematically searched the DENIS database (available at the Paris Data Analysis Center, PDAC) for potential members of the solar neighbourhood, with simple and well defined criteria. We first selected all DENIS objects which matched (low Galactic latitude) and (spectral type later than nominally M8.0, Leggett 1992). We then required that the position of the candidates in the (, ) colour-colour diagram be within mag of our linear fit to the locus of ultracool dwarfs (Fig. 2). We then computed photometric distances using the (, ) relation established in Section 2 and retained the candidates with pc.
Before setting out to measure the – labour intensive – proper motions needed to use reduced proper motions as a discriminant between nearby dwarfs and distant giants (see Section 5 for further details), we eliminated the bright candidates (, pc) within the boundaries of known low Galactic latitude molecular clouds in SIMBAD. This left 29 ultracool dwarf candidates (Table 2) for which we needed to measure proper motions. Their colour inferred spectral types range from M8.0 to L8.0 (Fig. 2). Six of these 29 candidates are previously known ultracool dwarfs: 2MASS J0644143284141 (M8, Cruz et al. 2003); SSSPM J08291309 (L2, Scholz & Meusinger 2002); 2MASS J1126399500355 (L9, Folkes et al. 2007); 1RXS J115928.5524717 (M9, Fuhrmeister & Schmitt 2003; Hambaryan et al. 2004); 2MASS J1347590761005 (L0, Kendall et al. 2007); 2MASSS J1520022442242 (L1+L3.5, Kendall et al. 2007; or L1.5+L4.5, Burgasser et al. 2007). We also searched for T dwarf candidates by using the (, ) colour-colour diagram along with a linear fit to the colours of T dwarfs from Table 1, however no T dwarf candidates were found. This reflects the fact that the DENIS survey with limiting magnitudes of , , is not very sensitive for T dwarf detections. For example, a T0.5 dwarf (, and , Vrba et al. 2004) could be detected by DENIS in all three , and bands were its distance within 7 pc, e.g. Epsilon Indi B (Scholz et al., 2003). A relaxation in the request for detections in all three DENIS bands, for example requiring detections in the and bands but not the band may allow us to detect nearby T dwarfs; however we did not consider such a search in this paper.
4 PROPER MOTION MEASUREMENTS
We queried ALADIN 111http://aladin.u-strasbg.fr/java/nph-aladin.pl and the Digital Sky Survey (DSS) server222http://archive.stsci.edu/cgi-bin/dss_plate_finder for publically available scanned plates containing these candidates. Both ALADIN and the DSS archive provide access to the plates of the POSS-I (-band), SERC-R (-band), SERC-I (-band), POSS-II F (-band), and POSS-II N (-band) surveys. ALADIN additionally contains digitized images of the ESO-R survey (-band), which often extend the time baseline enough to significantly reduce the standard error of our proper motion measurements. We used SExtractor (Bertin & Arnouts, 1996) to extract coordinates of our targets from all available digitized images. We then determined proper motions through a least-square fit to the positions at the 3 to 5 available epochs with time baselines spaning from 10 to 21 years, including DENIS333http://cdsweb.u-strasbg.fr/denis.html and 2MASS444http://cdsweb.u-strasbg.fr/viz-bin/VizieR. The uncertainty on the proper motion measurement is the rms dispersion around that fit.
Table 3 and 4 present our proper motions and the associated standard errors for 26 ultracool dwarfs and 3 reddened main sequence stars, respectively (see Section 5 and 6 for further details).
|
-
Abbreviations.—D*: DENIS-P
Col. (1): abbreviated DENIS name. Cols. (2) & (3): time baseline and number of observations. Cols. (4)–(7): proper motions and associated errors. Cols. (8) & (9): -band reduced proper motion and associated error. Col. (10): maximum reduced proper motion for an M giant of the same colour. Cols. (11) & (12): photometric distance and its associated error.
|
-
Cols. (1)–(10): same as Table 3.
|


5 L AND LATE-M DWARF CANDIDATES CLASSIFIED BY MAXIMUM REDUCED PROPER MOTION
As in our search for nearby mid-M dwarfs (Phan-Bao et al., 2003), we use the MRPM method to reject giants. This method uses the reduced proper motion ( = ) versus colour diagram, where nearby ultracool dwarfs and distant giants segregate very cleanly. Concretely, we use the colour-magnitude relation of giants to compute the maximum reduced proper motion that a red giant can have at a given colour – setting its tangential velocity to the Galactic escape velocity, for which we adopt a conservative 800 km s-1 (see Phan-Bao et al. 2003 and references therein) –, and then declare any object with a reduced proper motion above that value for its colour to be a dwarf. The details of the MRPM method are given in Phan-Bao et al. (2003).
To use this method here for the cooler M8.0–L8.0 candidates, we had to extend the maximum reduced proper motion curve of giants towards redder colours (), adding cooler giants from Fluks et al. (1994) to the Thé et al. (1990) (hereafter T90); Bessell & Brett (1988) (hereafter B88) sample used in our earlier article. Table 5 presents the photometric data used in this paper and the maximum reduced proper motion computed for giants at the given colors. The following cubic least-square fit (see Fig. 3) is valid for , or dwarf spectral types between M8.0 and L8.0:
| (2) | |||||
The rms dispersion around the fit is 0.1 mag. Figure 3 shows the position of the resulting vs. () curve relative to the 29 candidates. The curve well classifies 26 candidates as late-M and L dwarfs (Table 3). The likely giants are DENIS 06491541 and DENIS 07191749 (further discussed in Section 6) that are in the ultracool dwarf part of the diagram but within 2 of the limit, and the remaining one DENIS 07191738 that is within 1.
Figure 4 presents the proper motion distribution of our sample of 26 ultracool dwarfs (Table 3). The sample consists of 22 high-pm (yr-1) objects and 4 low-pm (yr-1) ones, giving a low-pm object fraction of 15.4 consistent with one estimated for mid-M dwarfs (M5–M8) of 14.8 (see Crifo et al. 2005; Phan-Bao & Bessell 2006). The finding charts of the 26 ultracool dwarfs are given in Fig. 5, 20 of these 26 dwarfs are new, 6 are already known in the literature (see the caption of Table 6 for references).

6 Spectroscopic observations and analysis
6.1 Optical spectroscopic observations
We observed the candidates on December 17–18 2006 and on May 20-25 2007 with the Double Beam Spectrograph on the ANU (Australian National University) 2.3m telescope at Siding Spring Observatory. Both gratings 158g/mm and 316g/mm were used and they provided a wavelength coverage of 6100–10200 Å at 5 and 2 Å resolution for gratings 158g/mm and 316g/mm, respectively. Exposures of 600–1800 seconds were taken, depending on the target magnitude. The seeing was around 2.0″. The data were reduced using the FIGARO555http://www.aao.gov.au/AAO/figaro/ data reduction system. Smooth spectrum stars were observed at a range of airmass to remove the telluric lines using the technique of Bessell (1999). The EG131 (Bessell, 1999) spectrophotometric standard was used for relative flux calibration, and a NeAr arc provided the wavelength calibration. All spectra were normalized over the 7540–7580 Å interval, the denominator of the PC3 index (Martín et al., 1999) and a region with a good flat pseudo-continuum. We also observed VB 8 (M7, for spectral classification, see Martín et al. 1999), VB 10 (M8, Martín et al. 1999), LHS 2065 (M9, Martín et al. 1999), 2MASS J224316965932206 (L0, Kendall et al. 2007), 2MASS J012826645545343 (L1, Kendall et al. 2007) and 2MASS J092114102104446 (L2, Reid et al. 2006) with the same instrument setup and used them as templates.
At the resolution of the spectra, M and L dwarfs are immediately distinguished from M giants by the presence of the NaI and KI doublets, the presence of FeH bands, the appearance of strong CaH cutting into the continuum shortward of 7000 Å, and by the absence of the CaII triplet (e.g. Bessell 1991).
Figure 6 presents spectra of 26 ultracool dwarfs (Table 3), and Figure 7 shows spectra of the 3 reddened F-K main sequence stars: DENIS 06491541, DENIS 07191738, and DENIS 07191749. These three stars are probably in the background of some molecular clouds and reddened by intervening dust. Using SIMBAD, we found that DENIS 06491541 was in the background of the [KKY2004] G226.707.5 molecular cloud, while DENIS 07191738 and DENIS 07191749 were in the vicinity of the ESO 5596 planetary nebula.
6.2 Spectral type classifications and distances
To estimate the spectral types of L and late-M dwarfs, we used the PC3 index defined in Martín et al. (1999) and TiO5 defined in Reid, Hawley & Gizis (1995). The VOa index, defined in Kirkpatrick et al. (1999), saturates in the M8-L0.5 spectral type range which covers a significant number of our ultracool dwarfs, we therefore only used it as a reference when there was a large difference (e.g. greater than 2 subclasses) in the spectral type estimate between PC3 and TiO5. We used spectral type versus spectral index relations to estimate spectral types, the Cruz & Reid (2002) relation for TiO5 and the Martín et al. (1999) relation for PC3. The uncertainty in the spectral indices was calculated based on the rms dispersion of the flux around the mean in the wavelength regions that were used to calculate the spectral indices.
Table 6 (column 13) lists the average value of the two spectral types computed from PC3 and TiO5, except for three dwarfs DENIS 11265003, DENIS 17055441, and DENIS 19091937 whose spectral type estimates were based on the PC3 index only.
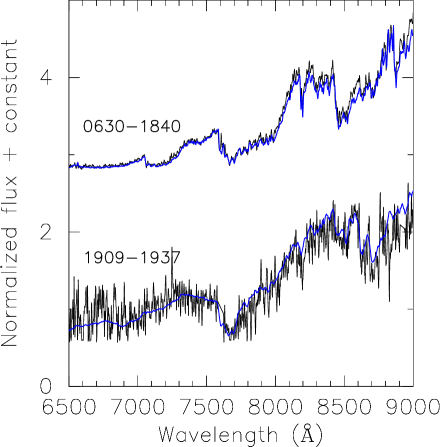
We also compared all spectra with our templates and with others from Martín et al. (1999). The Martín et al. (1999) template spectral type ranged from M8 down to L6. Spectral type estimates from the best fits are listed in Table 6 (column 15) with a typical uncertainty of 1.0 subclass. These values are in good agreement with our spectral types estimated from spectral indices. Figure 8 shows two representative cases: DENIS 06301840 and DENIS 19091937. The final spectral type is an average value of the spectral type estimated from spectral indices (column 13, Table 6) and one from the best fit of templates (column 15, Table 6) with an uncertainty of 1.0 subclass.
To estimate the absolute magnitude of the ultracool dwarfs, we used the absolute magnitude versus spectral type relation derived from 34 late-M, and L dwarfs (Table 1). The T dwarfs were excluded here since no T dwarf candidates had been found in our search. A linear least-squares fit (Fig. 9) to the data gives the following absolute magnitude-spectral type relation: SpT, where SpT is the spectral subtype, counted from 8.0 for spectral type M8.0 to 18.0 for spectral type L8.0. The standard rms is 0.30 mag, corresponding to a 14% error on distances. One should note that for the spectral type range M8–L5.5 of our 26 ultracool dwarfs, the rms is 0.27 mag which is somewhat higher than that of Dahn et al. (2002) (0.25 mag) but smaller than the 0.37 mag of Liu et al. (2006) and 0.40 mag of Knapp et al. (2004).
Table 7 lists our spectrophotometric distances and associated errors. The errors were computed from an uncertainty of 0.37 mag on corresponding to a spectral type uncertainty of 1.0 subclass and errors in the apparent -band magnitudes.
One should also note that some of the 26 ultracool dwarfs must be unresolved binaries, whose distances are underestimated by up to . Kendall et al. (2007) recently reported that DENIS 15204422 (as 2MASSJ 152002244422419, see also Burgasser et al. 2007) is an L1+L3.5 binary. According to Bouy et al. (2003), we can expect the binary fraction of our sample to be about 10.
Table 7 lists our tangential velocity computed from the proper motion and the spectrophotometric distance. Two of the dwarfs have relative high : 150 and 82 km s-1 for DENIS 12535709 and DENIS 11265003, respectively, and suggests they may be mild subdwarfs like Kapteyn’s star. A comparison of their spectra with the ultracool subdwarf spectra (Bessell, 1982; Burgasser, Cruz & Kirkpatrick, 2007) clearly excludes the possibility that they are ultracool extreme subdwarfs. In addition, all ultracool subdwarfs (, later than sdM9) known to date have (e.g. Table 7 of Burgasser et al. 2007, and references therein) meanwhile both DENIS 12535709 and DENIS 11265003 have . Folkes et al. (2007) have recently reported that DENIS 11265003 (or 2MASS J112639915003550) is a possible L-T transition object. This can explain the fact that the L dwarf has an optical spectral type of L6.0 (this paper) significantly earlier than its near-infrared spectral type of L9.0 (Folkes et al., 2007). Further observations would be useful to confirm the nature of this object as discussed in detail in their paper. Tsuji (2005) discusses complications due to dust formation in the spectra of the L-T transition objects.
6.3 Chromospheric activity
Using the IRAF666IRAF is distributed by the National Optical Astronomy Observatories, which are operated by the Association of Universities for Research in Astronomy, Inc., under cooperative agreement with the National Science Foundation. task SPLOT, we measured H equivalent widths of the 26 ultracool dwarfs (Table 7, column 9). Only the M9 dwarf DENIS 11595247 (or 1RXS J115928.5524717) shows strong H emission. This M9 dwarf has also shown strong X-ray flaring emission (Fuhrmeister & Schmitt, 2003; Hambaryan et al., 2004) demonstrating that the dwarf has chromospheric and coronal activity. We measured an upper limit for the remaining dwarfs, which have weak or no H emission or low signal-to-noise spectra. Unsurprisingly, the dissipation of chromospheric activity in almost our ultracool dwarfs is due to their predominantly cool, dense, and highly neutral atmospheres (Meyer & Meyer-Hofmeister, 1999; Mohanty et al., 2002).
6.4 A wide binary candidate M0+L0
During the SERC-I (-band, epoch = 1980.344) image examination, we discovered a bright star at the position =13h47m55.82s, =761020.2, which has a common proper motion with DENIS 13477610 (L0, RAyr-1, DEyr-1). We measured its proper motion RAyr-1, and DEyr-1, in good agreement with the proper motion of the L0 dwarf. This primary (hereafter ASIAAa) has DENIS photometry , , and , giving an -band reduced proper motion () of 11.00.2. This value is well above () the maximum reduced proper motion (Phan-Bao et al., 2003) that a red giant can have at the colour of ASIAAa () indicating it must be a dwarf. Follow-up spectroscopic observation of ASIAAa confirmed that the star is indeed an early M dwarf.
Figure 10 shows the optical spectrum at 2 Å resolution of ASIAAa observed at the CTIO 4m-telescope on July 17 2007. It is very similar to the spectrum of HD 111631 (M0) from MILES777http://www.ucm.es/info/Astrof/miles/database/database.html (A Medium resolution INT Library of Empirical Spectra). We therefore adopt a spectral type of M0 for ASIAAa, giving an -band absolute magnitude (Bessell, 1991). Comparison with the DENIS -band apparent magnitude then gives a distance of 33.36.1 pc, in good agreement with the spectrophotometric distance pc of the L0 dwarf DENIS 13477610 (hereafter ASIAAb). The presence of Balmer line emission (H and H) in ASIAAa indicates that the star is also chromospherically active. The projected angular separation between ASIAAa and ASIAAb is 16.8″or 418 AU at the distance of 24.9 pc.

7 Sample completeness, and the local ultracool dwarf density
The spectral types of almost all our ultracool dwarfs range from M8 to L3.5, excepting DENIS 11265003 (L5.5). For an L3.5 dwarf, we have , (e.g. Vrba et al. 2004), and (see Table 1). The limiting magnitudes of DENIS are , , and , giving a detection limited distance for L3.5 dwarfs of 23.5 pc. This limit for L5.5 dwarfs is about 15 pc, we therefore did not include DENIS 11265003 (L5.5) in our sample for the statistics. One should note that a relaxation of the request of detections in all three DENIS bands (e.g. only requiring detections in the and bands) might allow us to detect cooler L dwarfs as we discussed for T dwarf detection (see Section 3). However such a search is outside the scope of this paper.
The differential spectrophotometric distance distribution of that sample (Fig. 11) is well fitted by a distribution, as expected for a constant density population, out to 22 pc. The difference from the initial 30 pc selection cutoff reflects the detection limiting distance of DENIS for ultracool dwarfs and the different colour-magnitude relations used in the selection and in the final spectrophotometric distance estimate. We conservatively adopt 22 pc as the completeness limit of our sample, and use the 18 objects (Table 7) within that distance to determine the local density of ultracool dwarfs.
A sample limited by spectrophotometric distance is effectively a magnitude-limited sample with a spectral type (or colour)-dependent magnitude limit. As such, the dispersion in the spectral type-absolute magnitude relation has two distinct effects on the statistics of the stellar population (Stobie, Ishida & Peacock, 1989). First, the average luminosity of stars at a given spectral type (or colour) is increased; this is the classical Malmquist bias (Malmquist, 1936). Second, due to the dispersion of the distance estimator a magnitude-limited sample includes more stars at a given spectral type.


Here we study the sample of ultracool dwarfs M8–L3.5 over . The first component of the Malmquist bias is therefore irrelevant, since firstly we do not look for any significant luminosity resolution, and secondly the luminosity function is sufficiently flat over the M8–L3.5 spectral range (Cruz et al., 2007) that a small shift in the average luminosity will not measurably affect the resulting density. The second component of the bias, on the other hand, is significant. For a gaussian dispersion of the colour-luminosity relation it can be computed analytically (Stobie et al., 1989):
| (3) |

where is the luminosity function and is the intrinsic rms scatter in the spectral type-luminosity relation. The scatter in the versus spectral type relation is mag (Fig. 9), which corresponds to a 7 overestimate of the stellar density.
The mean surface density of our sample, objects per 100 square degrees out to 22 pc, corresponds to an uncorrected luminosity function of dwarfs mag-1 pc-3. After correcting for the Malmquist bias, this becomes dwarfs mag-1 pc-3, averaged over . Our value is in good agreement within error bars with the Cruz et al. (2007) measurement of dwarfs mag-1 pc-3, averaged over (see their Table 11 and Fig. 17) for M8–L4 ultracool dwarfs at high Galactic latitude (). This clearly demonstrates that the space density of ultracool dwarfs (M8–L3.5) in the solar neighbourhood does not depend on Galactic latitude, as expected.
8 Summary
We discovered 20 nearby ultracool dwarfs M8–L5.5 with one L3.5 at only 10 pc and reidentified six known ones at low Galactic latitude. Four of them are low-pm ultracool dwarfs, giving a significant fraction of of our sample. These ultracool dwarfs provide us additional targets for detailed studies of the basic physical properties of stars at the bottom of the main sequence.
Acknowledgments
The DENIS project has been partly funded by the SCIENCE and the HCM plans of the European Commission under grants CT920791 and CT940627. It is supported by INSU, MEN and CNRS in France, by the State of Baden-Württemberg in Germany, by DGICYT in Spain, by CNR in Italy, by FFwFBWF in Austria, by FAPESP in Brazil, by OTKA grants F-4239 and F-013990 in Hungary, and by the ESO C&EE grant A-04-046. Jean Claude Renault from IAP was the Project manager. Observations were carried out thanks to the contribution of numerous students and young scientists from all involved institutes, under the supervision of P. Fouqué, survey astronomer resident in Chile.
The Digitized Sky Surveys were produced at the Space Telescope Science Institute under U.S. Government grant NAG W-2166. The images of these surveys are based on photographic data obtained using the Oschin Schmidt Telescope on Palomar Mountain and the UK Schmidt Telescope. The plates were processed into the present compressed digital form with the permission of these institutions. The National Geographic Society - Palomar Observatory Sky Atlas (POSS-I) was made by the California Institute of Technology with grants from the National Geographic Society. The Second Palomar Observatory Sky Survey (POSS-II) was made by the California Institute of Technology with funds from the National Science Foundation, the National Geographic Society, the Sloan Foundation, the Samuel Oschin Foundation, and the Eastman Kodak Corporation. The Oschin Schmidt Telescope is operated by the California Institute of Technology and Palomar Observatory. The UK Schmidt Telescope was operated by the Royal Observatory Edinburgh, with funding from the UK Science and Engineering Research Council (later the UK Particle Physics and Astronomy Research Council), until 1988 June, and thereafter by the Anglo-Australian Observatory. The blue plates of the southern Sky Atlas and its Equatorial Extension (together known as the SERC-J), as well as the Equatorial Red (ER), and the Second Epoch [red] Survey (SES) were all taken with the UK Schmidt.
This publication makes use of data products from the Two Micron All Sky Survey, which is a joint project of the University of Massachusetts and Infrared Processing and Analysis Center/California Institute of Technology, funded by the National Aeronautics and Space Administration and the National Science Foundation; the NASA/IPAC Infrared Science Archive, which is operated by the Jet Propulsion Laboratory/California Institute of Technology, under contract with the National Aeronautics and Space Administration.
This research has made use of the ALADIN, SIMBAD and VIZIER databases, operated at CDS, Strasbourg, France.
We thank the referee for useful comments that significantly improved our paper.
References
- Bessell (1982) Bessell M. S., 1982, PASA, 4, 417
- Bessell (1991) Bessell M. S., 1991, AJ, 101, 662
- Bessell (1999) Bessell M. S., 1999, PASP, 111, 1426
- Bessell & Brett (1988) Bessell M. S., Brett J. M., 1988, PASP, 100, 1134 (B88)
- Bertin & Arnouts (1996) Bertin E., Arnouts S., 1996, A&AS, 117, 393
- Bouy et al. (2003) Bouy H., Brandner W., Martín E. L., Delfosse X., Allard F., Basri G., 2003, AJ, 126, 1526
- Burgasser et al. (2002) Burgasser A. J. et al., 2002, ApJ, 564, 421
- Burgasser et al. (2003) Burgasser A. J., Kirkpatrick J. D., Reid I. N., Brown M. E., Miskey C. L., Gizis J. E., 2003, ApJ, 586, 512
- Burgasser et al. (2004) Burgasser A. J., McElwain M. W., Kirkpatrick J. D., Cruz K. L., Tinney C. G., Reid I. N., 2004, AJ, 127, 2856
- Burgasser et al. (2007) Burgasser A. J., Cruz K. L., Kirkpatrick J. D., 2007, ApJ, 657, 494
- Burgasser et al. (2007) Burgasser A. J., Looper D. L., Kirkpatrick J. D., Liu M. C., 2007, ApJ, 658, 557
- Carpenter (2001) Carpenter J. M., 2001, AJ, 121, 2851
- Chiu et al. (2006) Chiu K., Fan X., Leggett S. K., Golimowski D. A., Zheng W., Geballe T. R., Schneider D. P., Brinkmann J., 2006, AJ, 131, 2722
- Close et al. (2003) Close L. M., Siegler N., Freed M., Biller B., 2003, ApJ, 587, 407
- Crifo et al. (2005) Crifo F., Phan-Bao N., Delfosse X., Forveille T., Guibert J., Martín E. L., Reylé C., 2005, A&A, 441, 653
- Cruz & Reid (2002) Cruz K. L., Reid I. N., 2002, AJ, 123, 2828
- Cruz et al. (2003) Cruz K. L., Reid I. N., Liebert J., Kirkpatrick J. D., Lowrance P. J., 2003, AJ, 126, 2421
- Cruz et al. (2007) Cruz K. L. et al., 2007, AJ, 133, 439
- Dahn et al. (2002) Dahn C. C. et al., 2002, AJ, 124, 1170
- Deacon & Hambly (2001) Deacon N. R., Hambly N. C., 2001, A&A, 380, 148
- Deacon et al. (2005) Deacon N. R., Hambly N. C., Cooke J. A., 2005, A&A, 435, 363
- Delfosse (1997) Delfosse X., 1997, PhD thesis, Univ. Grenoble
- Delfosse et al. (1999) Delfosse X., Tinney C. G., Forveille T., Epchtein N., Borsenberger J., Fouqué P., Kimeswenger S., Tiphène D., 1999, A&AS, 135, 41
- Delfosse et al. (2001) Delfosse X. et al., 2001, A&A, 366, L13
- Epchtein (1997) Epchtein N., 1997, in Garzon F., Epchtein N., Omont A., Burton B., Persi P., eds, The impact of large scale near-IR sky surveys, Kluwer Academic Publishers, Dordrecht, p. 15
- Fan et al. (2000) Fan X. et al., 2000, AJ, 119, 928
- Fluks et al. (1994) Fluks M. A., Plez B., Thé P. S. et al., 1994, A&AS, 105, 311
- Folkes et al. (2007) Folkes S. L., Pinfield D. J., Kendall T. R., Jones H. R. A., 2007, MNRAS, 378, 901
- Fuhrmeister & Schmitt (2003) Fuhrmeister B., Schmitt J. H. M. M, 2003, A&A, 403, 247
- Geballe et al. (2002) Geballe T. R. et al., 2002, ApJ, 564, 466
- Gizis et al. (2000) Gizis J. E., Monet D. G., Reid I. N., Kirkpatrick, J. D., Liebert J., Williams R. J., 2000, AJ, 120, 1085
- Gizis et al. (2003) Gizis J. E., Reid I. N., Knapp G. R., Liebert J., Kirkpatrick J. D., Koerner D. W., Burgasser A. J., 2003, AJ, 125, 3302
- Golimowski et al. (2004) Golimowski D. A. et al., 2004, AJ, 128, 1733
- Hambaryan et al. (2004) Hambaryan V., Staude A., Schwope A. D., Scholz R.-D., Kimeswenger S., Neuhäuser R., 2004, A&A, 415, 265
- Kendall et al. (2007) Kendall T. R., Jones H. R. A., Pinfield D. J., Pokorny R. S., Folkes S., Weights D., Jenkins J. S., Mauron N., 2007, MNRAS, 374, 445
- Kirkpatrick et al. (1997) Kirkpatrick J. D., Henry T. J., Irwin M. J., 1997, AJ, 113, 1421
- Kirkpatrick et al. (1999) Kirkpatrick J. D. et al., 1999, ApJ, 519, 802
- Kirkpatrick et al. (2000) Kirkpatrick J. D. et al., 2000, AJ, 120, 447
- Knapp et al. (2004) Knapp G. R. et al., 2004, AJ, 127, 3553
- Koerner et al. (1999) Koerner D. W., Kirkpatrick J. D., McElwain M. W., Bonaventura N. R., 1999, ApJ, 526, L25
- Lawrence et al. (2007) Lawrence A. et al., 2007, MNRAS, 379, 1599
- Leggett (1992) Leggett S. K., 1992, ApJS, 82, 531
- Leggett et al. (1998) Leggett S. K., Allard F., Hauschildt P. H., 1998, ApJ, 509, 836
- Leggett et al. (2001) Leggett S. K., Allard F., Geballe T. R., Hauschildt P. H., Schweitzer A., 2001, ApJ, 548, 908
- Lépine et al. (2002) Lépine S., Shara M. M., Rich R. M., 2002, AJ, 124, 1190 Lépine S., Shara M. M., Rich R. M., 2003, ApJ, 585, L69
- Liu et al. (2006) Liu M. C., Leggett S. K., Golimowski D. A., Chiu K., Fan X., Geballe T. R., Schneider D. P., Brinkmann J., 2006, ApJ, 647, 1393
- Lodieu et al. (2005) Lodieu N., Scholz R.-D., McCaughrean M. J., Ibata R., Irwin M., Zinnecker H., 2005, A&A, 440, 1061
- Lodieu et al. (2007) Lodieu N. et al., 2007, MNRAS, 379, 1423
- Malmquist (1936) Malmquist K. G., 1936, Stockholm Obs. Medd. 26
- Martín et al. (1999) Martín E. L., Delfosse X., Basri G., Goldman B., Forveille T., Zapatero Osorio M. R., 1999, AJ, 118, 2466
- McCaughrean et al. (2004) McCaughrean M. J., Close L. M., Scholz R.-D., Lenzen R., Biller B., Brandner W., Hartung M., Lodieu N., 2004, A&A, 413, 1029
- Meyer & Meyer-Hofmeister (1999) Meyer F., Meyer-Hofmeister E., 1999, A&A, 341, L23
- Mohanty et al. (2002) Mohanty S., Basri G., Shu F., Allard F., Chabrier G., 2002, ApJ, 571, 469
- Monet et al. (1992) Monet D. G., Dahn C. C., Vrba F. J., Harris H. C., Pier J. R., Luginbuhl C. B., Ables H. D., 1992, AJ, 103, 638
- Phan-Bao & Bessell (2006) Phan-Bao N., Bessell M. S., 2006, A&A, 446, 515
- Phan-Bao et al. (2001) Phan-Bao N. et al., 2001, A&A, 380, 590
- Phan-Bao et al. (2003) Phan-Bao N. et al., 2003, A&A, 401, 959
- Pickles (1998) Pickles A. J., 1998, PASP, 110, 863
- Reid (2003) Reid I. N., 2003, AJ, 126, 2449
- Reid & Cruz (2002) Reid I. N., Cruz K. L., 2002, AJ, 123, 2806
- Reid et al. (1995) Reid I. N., Hawley S. L., Gizis J. E., 1995, AJ, 110, 1838
- Reid et al. (2000) Reid I. N., Kirkpatrick J. D., Gizis J. E., Dahn C. C., Monet D. G., Williams R. J., Liebert J., Burgasser A. J., 2000, AJ, 119, 369
- Reid et al. (2001) Reid I. N., Gizis J. E., Kirkpatrick J. D., Koerner D. W., 2001, AJ, 121, 489
- Reid et al. (2006) Reid I. N., Lewitus E., Allen P. R., Cruz K. L., Burgasser A. J., AJ, 132, 891
- Reylé et al. (2002) Reylé C., Robin A. C., Scholz R.-D., Irwin M., 2002, A&A, 390, 491
- Salim et al. (2003) Salim S., Lépine S., Rich R. M., Shara M. M., 2003, ApJ, 586, 149
- Scholz & Meusinger (2002) Scholz R.-D., Meusinger H., 2002, MNRAS, 336, L49
- Scholz et al. (2003) Scholz R.-D., McCaughrean M. J., Lodieu N., Kuhlbrodt B., 2003, A&A, 398, L29
- Skrutskie et al. (1997) Skrutskie M. F. et al., 1997, in Garzon F., Epchtein N., Omont A., Burton B., Persi P., eds, The impact of large scale near-IR sky surveys, Kluwer Academic Publishers, Dordrecht, p. 25
- Stephens & Leggett (2004) Stephens D. C., Leggett S. K., 2004, PASP, 116, 9
- Stobie et al. (1989) Stobie R. S., Ishida K., Peacock J. A., 1989, MNRAS, 238, 709
- Thé et al. (1990) Thé P. S., Thomas D., Christensen C. G., Westerlund B. E., 1990, PASP, 102, 565 (T90)
- Tinney (1996) Tinney C. G., 1996, MNRAS, 281, 644
- Tsuji (2005) Tsuji T., 2005, ApJ, 621, 1033
- van Altena et al. (1995) van Altena W. F., Lee J. T., Hoffleit E. D., 1995, The General Catalogue of Trigonometric Stellar Parallaxes, Fourth Edition (New Haven, CT: Yale University Observatory)
- Van Biesbroeck (1961) Van Biesbroeck G., 1961, AJ, 66, 528
- Vrba et al. (2004) Vrba F. J. et al., 2004, AJ, 127, 2948
- York et al. (2000) York D. G. et al., 2000, AJ, 120, 1579
| Table 6. 26 nearby L, and late-M dwarfs | ||||||||||||||||
|---|---|---|---|---|---|---|---|---|---|---|---|---|---|---|---|---|
| DENIS name | PC3 | err | TiO5 | err | VOa | err | Sp.T | err | Sp.T | err | Sp.T | Sp.T | err | Sp.T | Sp.T | Refs. |
| (PC3) | (TiO5) | (VOa) | (PC3) | (TiO5) | (VOa) | (index) | (temp.) | (adopted) | ||||||||
| (1) | (2) | (3) | (4) | (5) | (6) | (7) | (8) | (9) | (10) | (11) | (12) | (13) | (14) | (15) | (16) | (17) |
| D* 06150100 | 3.73 | 0.48 | 0.871 | 0.211 | 2.05 | 0.43 | L2.3 | 0.4 | L1.2 | 1.2 | L2.3 | L2.0 | 1.0 | L2.5 | L2.5 | |
| D* 06301840 | 2.63 | 0.20 | 0.336 | 0.030 | 2.35 | 0.30 | L0.1 | 1.4 | M8.1 | 0.2 | L0.2 | M9.0 | 1.0 | M8.0 | M8.5 | |
| D* 06442841 | 2.38 | 0.29 | 0.315 | 0.067 | 1.92 | 0.63 | M9.7 | 0.8 | M8.0 | 0.4 | L3.2 | M9.0 | 0.5 | M9.5 | M9.5 | 1 |
| D* 06522534 | 2.28 | 0.22 | 0.768 | 0.040 | 2.27 | 0.24 | M9.5 | 0.6 | L0.6 | 0.2 | L0.7 | L0.0 | 0.5 | M9.5 | L0.0 | |
| D* 07160630 | 3.01 | 0.32 | 0.590 | 0.166 | 2.45 | 0.65 | L1.7 | 1.5 | M9.6 | 0.9 | M9.5 | L0.5 | 1.0 | L1.0 | L1.0 | |
| D* 07512530 | 3.79 | 0.40 | 0.985 | 0.116 | 2.29 | 0.33 | L2.4 | 0.3 | L1.8 | 0.7 | L0.6 | L2.0 | 0.5 | L1.0 | L1.5 | |
| D* 08053158 | 1.95 | 0.16 | 0.180 | 0.114 | 2.19 | 0.24 | M8.5 | 0.7 | M7.2 | 0.6 | M6.8 | M8.0 | 0.5 | M8.0 | M8.0 | |
| D* 08122444 | 3.11 | 0.38 | 1.086 | 0.151 | 2.28 | 0.49 | L1.8 | 0.3 | L2.4 | 0.9 | L0.7 | L2.0 | 0.5 | L1.0 | L1.5 | |
| D* 08234912 | 3.52 | 0.68 | 0.885 | 0.077 | 2.07 | 0.57 | L2.1 | 0.6 | L1.2 | 0.4 | L2.2 | L1.5 | 0.5 | L1.0 | L1.5 | |
| D* 08281309 | 2.54 | 0.32 | 0.750 | 0.201 | 2.16 | 0.44 | L0.0 | 1.5 | L0.5 | 1.1 | L1.5 | L0.5 | 1.5 | L1.0 | L1.0 | 2 |
| D* 10485254 | 2.91 | 0.49 | 0.874 | 0.242 | 2.77 | 0.77 | L1.6 | 1.8 | L1.2 | 1.4 | M7.3 | L1.5 | 1.5 | L1.0 | L1.5 | |
| D* 11265003 | 11.03 | 8.17 | 0.772 | 0.395 | 1.46 | 0.98 | L5.9 | 4.3 | L0.6 | 2.2 | L6.5 | L6.0 | 4.5 | L5.0 | L5.5 | 3 |
| D* 11574844 | 2.54 | 0.33 | 0.819 | 0.102 | 2.48 | 0.57 | L0.0 | 1.5 | L0.9 | 0.6 | M9.3 | L0.5 | 1.0 | L1.0 | L1.0 | |
| D* 11595247 | 2.16 | 0.14 | 0.429 | 0.017 | 2.21 | 0.26 | M9.2 | 0.5 | M8.7 | 0.1 | M7.0 | M9.0 | 0.5 | M9.0 | M9.0 | 4 |
| D* 12326856 | 1.94 | 0.16 | 0.217 | 0.014 | 2.68 | 0.79 | M8.4 | 0.7 | M7.5 | 0.1 | L1.9 | M8.0 | 0.5 | M8.0 | M8.0 | |
| D* 12535709 | 2.22 | 0.42 | 0.987 | 0.336 | 2.43 | 0.66 | M9.3 | 1.5 | L1.8 | 1.9 | M9.6 | L0.5 | 1.5 | L0.0 | L0.5 | |
| D* 13477610 | 2.28 | 0.74 | 0.498 | 0.536 | 2.33 | 2.17 | M9.5 | 2.9 | M9.0 | 3.0 | L0.3 | M9.5 | 3.0 | L0.0 | L0.0 | 5 |
| D* 14546604 | 4.60 | 1.76 | 1.293 | 0.121 | 1.79 | 1.05 | L3.0 | 1.5 | L3.6 | 0.7 | L4.1 | L3.5 | 1.0 | L3.5 | L3.5 | |
| D* 15197416 | 2.17 | 0.28 | 0.192 | 0.074 | 2.22 | 0.43 | M9.2 | 1.0 | M7.3 | 0.4 | M7.1 | M8.5 | 0.5 | M9.0 | M9.0 | |
| D* 15204422 | 2.52 | 0.68 | 0.826 | 0.163 | 1.73 | 0.50 | L0.0 | 2.0 | L0.9 | 0.9 | L4.6 | L0.5 | 1.5 | L1.0 | L1.0 | 5 |
| D* 17055441 | 2.06 | 0.57 | 0.007 | 0.011 | 2.58 | 1.44 | M8.9 | 2.6 | M6.3 | 0.1 | L0.9 | M9.0 | 2.5 | M8.0 | M8.5 | |
| D* 17331654 | 2.62 | 0.40 | 0.725 | 0.081 | 2.17 | 0.48 | L0.1 | 1.6 | L0.3 | 0.5 | L1.5 | L0.0 | 1.0 | L1.0 | L1.0 | |
| D* 17451640 | 3.23 | 0.73 | 0.636 | 0.157 | 1.95 | 0.71 | L1.9 | 1.9 | M9.8 | 0.9 | L3.0 | L1.0 | 1.5 | L2.0 | L1.5 | |
| D* 17564518 | 1.97 | 0.20 | 0.310 | 0.177 | 2.38 | 0.36 | M8.5 | 0.8 | M8.0 | 1.0 | M8.8 | M8.5 | 1.0 | M9.0 | M9.0 | |
| D* 17564805 | 2.40 | 0.39 | 0.450 | 0.270 | 2.42 | 0.60 | M9.8 | 1.7 | M8.8 | 1.5 | M9.7 | M9.5 | 1.5 | L0.0 | L0.0 | |
| D* 19091937 | 2.58 | 0.89 | 1.851 | 1.283 | 2.29 | 1.38 | L0.1 | 2.7 | L6.7 | 7.3 | L0.7 | L0.0 | 2.5 | L2.0 | L1.0 | |
Abbreviations.—D*: DENIS
Col. (1): abbreviated DENIS name.
Cols. (2)–(7): spectroscopic indices and associated errors. PC3 defined Martín et al. (1999); TiO5 defined
in Reid et al. (1995); VOa defined in Kirkpatrick et al. (1999).
Cols. (8)–(12): spectral types derived from the PC3, TiO5, and VOa index using the formula given
in Martín et al. (1999) and Cruz & Reid (2002) and their associated errors (only for PC3 and TiO5).
Cols. (13) & (14): the mean spectral type derived based on PC3 and TiO5 and its associated errors
(see Section 6.2).
Col. (15): spectral type estimated from comparison with templates.
Col. (16): the adopted spectral type (see Section 6.2).
Col. (17): references;
(1): 2MASS J0644143284141, Cruz et al. (2003);
(2): SSSPM J08291309, Scholz & Meusinger (2002);
(3): 2MASS J112639915003550, Folkes et al. (2007);
(4): 1RXS J115928.5524717, Hambaryan et al. (2004);
(5): Kendall et al. (2007), for 2MASS J152002244422419 see also Burgasser et al. (2007).
|
-
Col. (1): abbreviated DENIS name. Col. (2): spectral type determined in this paper. Col. (3): -band absolute magnitude computed from spectral type using the calibration in this paper. Cols. (4) & (5): spectrophotometric distance and its associated error. Cols. (6) & (7): tangential velocity and its associated error. Col. (8): H equivalent widths (Å). Col. (9): references; (1): 2MASS J0644143284141, Cruz et al. (2003); (2): SSSPM J08291309, Scholz & Meusinger (2002); (3): 2MASS J112639915003550, Folkes et al. (2007); (4): 1RXS J115928.5524717, Hambaryan et al. (2004); (5): Kendall et al. (2007), for 2MASS J152002244422419 see also Burgasser et al. (2007).