The Variability of Polarized Radiation from Sgr A*
Abstract
Sgr A* is variable at radio and submillimeter wavelengths on hourly time scales showing time delays between the peaks of flare emission as well as linearly polarized emission at millimeter and sub-mm wavelengths. To determine the polarization characteristics of this variable source at radio frequencies, we present VLA observations of Sgr A* and report the detection of polarized emission at a level of 0.77% and 0.2% at 43 and 22 GHz, respectively. The change in the time averaged polarization angle between 22 and 43 GHz corresponds to a RM of -2.5 rad m-2 with no phase wrapping (or rad m2 with 2 phase wrap). We also note a rise and fall time scale of 1.5 – 2 hours in the total polarized intensity. The light curves of the degree of linearly polarized emission suggests a a correlation with the variability of the total intensity at 43 GHz. The available polarization data at radio and sub-mm wavelengths suggest that the rotation measure decreases with decreasing frequency. This frequency dependence, and observed changes in polarization angle during flare events, may be caused by the reduction in rotation measure associated with the expansion of synchrotron-emitting blobs.
1 Introduction
The compact, dark and massive (4 ) object at the Galactic center has been uniquely identified with the radio source Sgr A* through measurements of the proper motion of the radio source and the orbital motion of stars in its vicinity (Reid & Brunthaler 2004; Schödel et al. 2003; Ghez et al. 2005). Recent multi-wavelength polarization and total intensity measurements of the flaring activity of Sgr A* are recognized as powerful probes of mass-loss and mass-accretion processes. Previous rotation measure (RM) estimates of flare emission in millimeter and submillimeter wavelengths have applied the spherical accretion flow model to estimate the mass accretion rate (Bower et al. 2003; Marrone et al. 2007; Macquart et al. 2006). Assuming that the RM is proportional to the mass accretion rate, the estimated electron density value is much less than that predicted by the ADAF model, thus, implying that most of the infalling material is not reaching the central black hole.
To provide additional insight on the nature of flaring activity such as whether the variable emission is driven by an outflow or by infall, we have begun a program to study the light curves as well as polarization measurements of Sgr A*’s flare emission at radio wavelengths. The flare emissions in radio, sub-millimeter and millimeter wavelengths are known to vary on hourly time scales (Marrone et al. 2007; Miyazaki et al. 2006; Maurehan et al. 2005; Yusef-Zadeh et al. 2006a). The near-IR measurements show a high degree of linearly polarized emission during the 10-20 minute time scale of typical flare emission. Eckart et al. (2006) report near-IR polarized emission with a degree of polarization 12-25% with a position angle swing of about 400. In another study, Trippe et al. (2007) report the detection of up to 40% degree of polarization at 2.08 m band as well as a swing in the polarization angle of 700 during the decaying part of the flare. The polarization angle of the peak emission at this wavelength remains constant in three different measurements over the course of two years.
At longer wavelengths, polarized emission from Sgr A* was first detected by Aitken et al. (2000) in the submillimeter. Several measurements using the SMA have recently confirmed that the submillimeter emission is polarized, with the percentage polarization increasing above 100 GHz (Marrone et al. 2006a). The detection of variable linear polarization on hourly time scales has been reported at 880m with a degree of polarization ranging between 8.5% and 2.3% and a 500 swing in the polarization position angle (Marrone et al. 2006b). However, variable polarization has yet to be conclusively associated with flaring in total intensity. At the longest wavelength (3.5 mm) at which linear polarization from Sgr A* has been detected, Macquart et al. (2006) find a mean polarization fraction of 2.1%% and a mean polarization position angle of 16. Near-IR polarization measurements have provided the only evidence of variable polarized emission associated with the flaring component of the emission from Sgr A*.
Here we focus on linear polarization measurements of two overlapping flares from Sgr A* at 43 GHz (7mm) and 22 GHz (13mm). The total intensity light curves of these flares were recently shown to be variable on an hourly time scale with a time lag of the peak 22 GHz emission with respect to the peak 43 GHz flare emission (Yusef-Zadeh et al. 2006b). In the context of an expanding synchrotron blob driven by flaring activity, we present theoretical and empirical plots comparing the frequency-dependence of the RM between the radio and submillimeter bands.
2 Observations & Results
Using the Very Large Array (VLA) of the National Radio Astronomy Observatory111The National Radio Astronomy Observatory is a facility of the National Science Foundation, operated under a cooperative agreement by Associated Universities, Inc., we carried out observations in the A-array configuration including the Pie Town antenna on February 10, 2006. This experiment was designed to remove the amplitude calibration errors resulting from the low elevation of Sgr A* and investigate the time variability in flux density and polarization. Because of its gain instability, the Pie Town telescope is not included in the 43 GHz measurements reported here. We used the fast-switching mode of the VLA to quickly slew between Sgr A* and a nearby calibrator at 7 and 13mm. For each of the two frequencies, two IFs were separated by 50 MHz and were centered at 43.3149, 43.3649, 22.4851 and 22.4351 GHz. Throughout the observations, we alternated between the fast-switching calibrator 17444-31166 (2.3 degrees away from Sgr A*) and Sgr A* for 30s and 90s, respectively. In order to achieve a similar sensitivity at 43 and 22 GHz, we observed 1.6 times longer at 43 GHz than at 22 GHz. We also observed the calibrator 1733-130 every 30 minutes. However, because of its distance from Sgr A* (15 degree) and its infrequent observations (30 minutes), we were not able to use this calibrator as a phase or polarization calibrator. We attempted to include this calibrator, but it added gain errors to calibrations at these high frequencies. Thus, we used 17444-31166 as both the complex gain and polarization calibrator.
A first order instrumental polarization correction was done for the entire period of the observation using standard procedures in AIPS. In order to make a light curve of the polarized intensity of Sgr A*, a second order correction was also done for a 10 minute sampling time interval, during which the data was smoothed. After Sgr A* data has had the first order polarization calibration applied, the second order correction to polarized flux of Sgr A* for each smoothing period was estimated by first measuring the Stokes Q and U variations of the calibrator from its mean value. These variations were normalized by the flux of Sgr A* and then subtracted from the Stokes Q and U values of Sgr A*. The corrected values of Q and U flux accounted for instantaneous instrumental polarization in different parallactic angles with the assumption that 17444-31166’s polarization is not varying on hourly time scales. The rms errors of the Q and U Stokes in the uv plane (see Fig. 1) are overestimated when compared with the errors estimated from the images of the Q and U Stokes. This is due to the bias of amplitudes of complex numbers. We believe the error estimates in the uv plane may arise from the amplitudes which will have a low SNR (i.e., one baseline per polarization per IF at a time) whereas the image plane data has a vector average which does not have this bias. Thus, the values derived from imaging individual Stoke parameters have a better error distribution and are used in the discussion below. We noted that this bias increases the uv data error estimates by a factor of 2-3 when compared with that of the image plane data.
Figures 1a,b show the characteristics of the light curves of Stokes, I, Q and U emission from Sgr A* at 43 and 22 GHz, respectively. The top panel displays the total intensity light curves of two overlapping flares. The peak flux of these flares are about 200 mJy above the quiescent flux. A more detailed account of the cross-correlation analysis of 43 and 22 GHz light curves will be given elsewhere. The accuracy of the polarization calibration in each ten-minute time interval is given as 0.06% and 0.03% at 43 and 22 GHz, respectively, We measured these values by imaging Sgr A* for a 10-minute time interval around the first peak flux 14:30h UT, as identified in Figure 1, and then took the ratio of the polarized rms noise to the peak flux of Sgr A*. The fractional polarization 0.3% at 43 GHz and 0.15% at 22 GHz correspond to a 5 detection.
The polarization fraction is in the middle panels show modulation of the polarization fraction ranging between 0.3% and 1.4% at 43 GHz. and 0.15 – 0.4% at 22 GHz. We also averaged over the entire period of observation and found the degree of polarization at 43 and 22 GHz are 0.77% and 0.20%, respectively. As shown in the bottom panel of Figure 1, the position angle of the electric field is shown to remain nearly constant at 43 and 22 GHz. The mean position angle of the polarization at 22 and 43 GHz when sampled every 20 minutes for the entire observation are 102 and 121 degrees, respectively.
The modulation of polarized intensity is real at 43 GHz for the following reasons. First, unlike what is seen in Figure 1, the polarization position angle due to instrumental polarization changes as a function of the hour angle. This assures us that instrumental polarization has been removed effectively. Furthermore, a close examination of the polarization fraction in the middle panel appears to show that the emission in total and polarized intensities do not peak at the same time. This is more obvious for the second flare in the 22 GHz light curve. If the polarized emission were due to the leakage term, instrumental polarization would have been proportional to the total flux which does not appear to be the case. Earlier polarization measurements by Bower et al. (1999) used a different observing technique with a smaller number of antennas observing Sgr A* at 44 and 22 GHz simultaneously. Their observing technique could not correct atmospheric errors on a short time scale, in the way that the fast-switching technique does. Their measurements indicated fractional polarization upper limits of 0.2% and 0.4% at 43 and 22 GHz, respectively. These upper limits are consistent with measurements given here when the data are averaged over the entire period. The low fraction of linear polarization presented in the light curves of Sgr A* at 43 and 22 GHz can be explained by our employing a fast switching technique, using 27 antennas, and the fact that we see clear flaring activity from Sgr A*. Lastly, given that the the rms errors of the Stokes Q and U in Figure 1 are overestimates by a factor 2-3, as discussed in , we believe the modulation of the fractional polarized intensity is real. The fact that the actual scatter in the polarized emission plots is smaller than the error bars supports the conjecture that the error bars are over-estimates.
3 Discussion
The recent radio monitoring of Sgr A* shows that the duration of radio flares – about two hours – is similar to the duration observed at sub-millimeter and millimeter wavelengths. The duration may indicate cooling by adiabatic expansion, implying that flare activity may drive an outflow or a collimated jet (Yusef-Zadeh et al. 2006c). This interpretation stems from the fact that the synchrotron lifetime of particles producing 850m and centimeter emission range from 12 hours to several days, much longer than the 35-min synchrotron cooling time scale for the GeV particles responsible for the near-IR emission. A jet model of Sgr A* has previously been proposed motivated by the broad band spectrum of Sgr A* (Falcke and Markoff 2000; Melia and Falcke 2001). Further support for this picture comes from the light curves corresponding to 43 and 22 GHz data taken with the VLA in 2005. These observations reported a 20-40 minute time delay in which the 43 GHz emission is leading the 22 GHz emission (Yusef-Zadeh et al. 2006a,b). This time delay supports a picture in which the peak frequency of emission shifts from high (near-IR) to low frequencies (sub-mm, millimeter and then radio) as a self-absorbed synchrotron source expands adiabatically (van der Laan 1966).
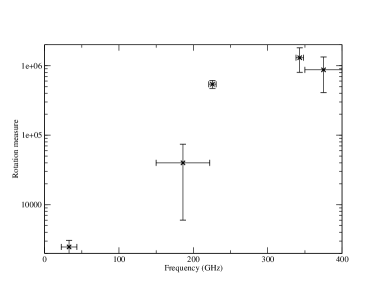
To examine the outflow picture further, we explore polarization of light curves of emission in radio and sub-mm wavelengths where optical depth becomes important and in near-IR wavelengths where synchrotron emission is optically thin. The RM of an expanding blob is proportional to the product of thermal plasma density , magnetic field and the radius of the emitting plasma, , i.e. . As increases, and scale as and respectively, so . We searched in the literature for observations that could test for frequency-dependence of the RM. The change in the time averaged position angle at 22 and 43 GHz corresponds to a RM of -2.47 rad m-2. Figure 2 shows the log of negative RM as a function of the observed frequencies in sub-mm (Aitken et al. 2000; Marrone et al. 2007) and radio wavelengths based on the measurements presented here. The RM measurements are taken with the same instrument at adjacent frequencies on the same day. The RM values in sub-mm wavelengths are averaged over several days (Marrone et al. 2007). The least-square fit to the data points in Figure 2 show a trend that the RM value becomes more negative with increasing frequency, Assuming that there is no phase wrapping across the adjacent frequencies, the available data suggests that classical Faraday rotation (i.e. constant RM) of polarized radiation passing through a cold medium can not be applied to Sgr A*. Furthermore, the RM estimate used to measure the accretion rate on Sgr A* may need to be re-examined (Ballantyne et al. 2007).
The empirical RM plot shown in Figure 2 is based on time-averaged quantities and there is a question whether these values are associated with the flaring events or the quiescent flux. In the expanding plasmon model, it is possible that much of the polarized emission is due to flare emission because flare activity occurs 25-30% of the time in near-IR wavelengths. The optically thin near-IR flares which are characterized to have 20-minute duration will have duration of 2-3 hours in the optically thick flare emission (Maurehan et al. 2005; Marrone et al. 2006b; Yusef-Zadeh et al.2006a) as the flares expand, thus, contributing to the total quiescent flux of Sgr A*.
The observational situation in the sub-mm is confused by the presence of quiescent and/or continually varying emission that is at a transition from being optically thick to thin - it is unclear whether well-separated, distinct flaring events are occurring at these wavelengths. In addition, observations that are resolved on hour-long time scales are very difficult. The time-averaged sub-mm emission from Sgr is linearly polarized, with some variability in percentage polarization, and Faraday rotations rad m-2 have been detected (Marrone et al. 2006a, 2007). However, there is as yet no evidence for sub-mm flares that can be identified with large swings in polarization position angle. The linear polarization, when plotted as vs Stokes parameters do appear to execute a couple of loops around the average position on a timescale of a few hours (Marrone et al. 2006b), while the ratio , which determines the polarization position angle , does not change very much. This behavior is a feature of generalized Faraday rotation, which arises when the electrons in the ambient medium are relativistic. This changes the normal modes of the plasma from being circularly polarized to being elliptically polarized (e.g. Kennett & Melrose 1998; Ballantyne, Özel & Psaltis 2007). Instead of rotating the plane of linear polarization, Faraday rotation causes cyclic partial conversion between Stokes Q, U and V as a signal propagates through the medium. In the limit that the electrons in the medium are ultra-relativistic the normal modes are linearly polarized, and complete conversion back and forth between linear and circular polarization is possible. In this case the phase of the oscillation is given by where RRM is the relativistic rotation measure
| (1) |
for a relativistic distribution of electrons with () above a cutoff energy with (Kennett & Melrose 1998).
If is the amplitude of the oscillations in and about their mean values, then the change in angle of the plane of polarization will be for small angles . Empirically, the RM is found by comparing at two neighboring wavelengths, so the effective value is . The emission at sub-mm and radio frequencies is optically thick, complicating the analysis substantially (O’Dell & Jones 1977); here we simply assume that the relativistic rotation measure is determined by the material lying within optical depth of 1 of the blob’s surface, i.e. , where is given by eq (1) with .
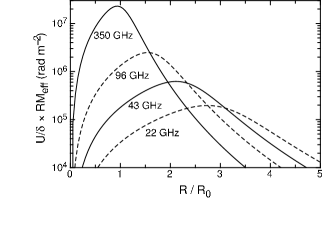
For an expanding homogeneous sphere producing a peak synchrotron flux of 500 mJy at 350 GHz, assuming an electron spectrum down to 1 MeV in equipartition with the magnetic field, we find that the radius when the sub-mm emission peaks is , the magnetic field strength is , and cm-3. These inferred field strengths and densities are one and two orders of magnitude larger, respectively, than the values typically inferred in the mean accretion flow. In Figure 3, we show how the sphere’s effective rotation measure increases and then decreases as the blob expands, with the maximum effective RM occurring just before the peak in the flux.
In the orbiting spot model, one would expect a significant swing in the polarization angle due to rotation of the spot’s magnetic field as it is carried around by the accretion flow, modified by relativistic effects, although this could be reduced by the presence of other polarized components such as longer-duration flares or a quiescent background. Significant swings in the angle of linear polarization during near-IR flares have been reported by Eckart et al. (2006) and Trippe et al. (2007). The dependence of the RRM effects described above renders them ineffective in the near-IR, but an alternative is that the polarization swing is caused by cold thermal gas within the blob. In this case the optically thin synchrotron flux scales with the radius as , and the internal rotation measure , so over the course of the flare (where is the flux from the blob) will drop significantly. To produce a significant swing in the plane of polarization, the rotation of the plane of polarization within the source at the beginning of the flare is radian. It cannot be much larger, otherwise variations within the source would depolarize the emission. It cannot be much smaller, otherwise the change in as the source expands would be too small. If we assume that the synchrotron flux from a uniform blob characterized by radius , with a relativistic electron population above energy is 10 mJy, and that there is equipartition between the magnetic field, relativistic electrons, and a thermal plasma then the derived magnetic field strength is G. The number density of the thermal component needed to give radian is large, . The Alfven speed within the blob is and the expansion time scale due to the internal pressure is 6200 s. Then the time scale for the near-IR flux () to decay is s, consistent with the observed flare durations.
The duration of the flaring at submillimeter and radio wavelengths is much shorter than the time scale for synchrotron cooling. With the high vlue of the inferred magnetic field, the flare duration could reflect the duration of the particle acceleration event. In the context of the orbiting spot model this presumably reflects changes to Doppler boosting on orbital time scales at different radii, consistent with the wavelength-dependence of the angular size of Sgr A (Bower et al. 2004; Shen et al. 2005; Bower et al. 2006). However, two distinct features of the flaring of Sgr A* favor the outflow picture of the flare activity over the orbiting hot spot model. First, the systematic time delay of the peak emission at radio and sub-mm wavelengths relative to the near-IR. Second, if the polarized emission arises mainly from flares, the frequency-dependence of the inferred RM can also be explained by expansion of the emitting region. If so, the RM of flaring activity can not be used to determine the accretion rate by way of tracing the electron column density (Marrone et al. 2006a, 2007 and references therein). Instead, in this picture the measured RMs are upper limits for the RM within the accretion flow and ADAF models are still excluded.
References
- (1) Aitken, D. K., Greaves, J., Chrysostomou, A., Jenness, T., Holland, W., et al. 2000, ApJ, 534, L173
- (2) Ballantyne, D. R., Ozel, F. & Psaltis, D. 2007, ApJ, 663, L17
- (3) Bower, G. C., Wright, M. C. H., Backer, D. C. & Falcke, H. 1999, ApJ, 527, 851
- (4) Bower, G. C., Falcke, H., Herrnstein, R. M., Zhao, J.-H., Goss, W. M. & Backer, D. C. 2004, Science, 304, 704
- (5) Bower et al. 2005, ApJ, 618, L29
- (6) Bower, G. C., Goss, W. M., Falcke, H., Backer, D. C., Lithwick, Y. 2006, ApJ, 648, L127
- (7) Broderick, A. E. & Loeb, A. 2006, MNRAS, 367, 905
- (8) Eckart, A., Schödel, R., Meyer, L., Trippe, S., Ott, T. et al. 2006, A&A, 455, 1
- (9) Falcke,. & Markoff, S. 2000, A&A, 362, 113
- (10) Ghez, A. M., Salim, S., Hornstein, S. D., Tanner, A., Lu, J. R. et al. 2005, ApJ, 620, 744
- (11) Kennett, M. & Melrose, D. 1998, PASA, 15, 211
- (12) Macquart, J. P. et al. 2006, ApJ, 646, L111
- (13) Mauerhan, J.C., Morris, M., Walter, F. & Baganoff, F. 2005, ApJ, 623, L25
- (14) Marrone D. P., Moran, J. M., Zhao, J.-H. & Rao, R. 2006a, ApJ, 640, 308
- (15) Marrone, D. P., Moran, J. M., Zhao, J.-H. & Rao, R. 2006b, JPCS, 54, 354
- (16) Marrone D. P., Moran, J. M., Zhao, J.-H. & Rao, R. 2007, ApJ, 654, L57
- (17) Melia, F. & Falcke H., 2001, ARA&A, 39, 309
- (18) Miyazaki, A., Tsutsumi, T. & Tsuboi, M. 2006, JPh, xx
- (19) Reid, R. J. & Brunthaler, A. 2004, ApJ, 616, 872
- (20) Schödel, R., Ott, T., Genzel, R., Eckart, A., Mouawad, N., & Alexander, T., 2003, ApJ, 596, 1015
- (21) Shen, Z.-Q., Lo, K. Y., Liang, M.-C., Ho, P. T. P. & Zhao, J.-H. 2005, Nature, 438, 62
- (22) Trippe, S., Paumard, T., Ott, T., Gillessen, S., et al. 2007, MNRAS, 375, 764
- (23) van der Laan 1966, Nature, 211, 1131
- (24) Yusef-Zadeh, F., Bushouse, H., Dowell, C. D., Wardle, M., Roberts, D., Heinke, C., 2006a, ApJ, 644, 198
- (25) Yusef-Zadeh, F., Roberts, D., Wardle, M., Heinke, C.O. & Bower, G.C., 2006b, ApJ, 650, 189
- (26) Yusef-Zadeh, F. et al. 2006c, in ”Microquasars and Beyond”, September 18-22 2006, Como, Italy (arXiv:astro-ph/0612156)