Effects of mode degeneracy in the LIGO Livingston Observatory recycling cavity
Abstract
We analyze the electromagnetic fields in a Pound-Drever-Hall locked, marginally unstable, Fabry-Perot cavity as a function of small changes in the cavity length during resonance. More specifically, we compare the results of a detailed numerical model with the behavior of the recycling cavity of the Laser Interferometer Gravitational-wave Observatory (LIGO) detector that is located in Livingston, Louisiana. In the interferometer’s normal mode of operation, the recycling cavity is stabilized by inducing a thermal lens in the cavity mirrors with an external laser. During the study described here, this thermal compensation system was not operating, causing the cavity to be marginally optically unstable and cavity modes to become degenerate. In contrast to stable optical cavities, the modal content of the resonating beam in the uncompensated recycling cavity is significantly altered by very small cavity length changes. This modifies the error signals used to control the cavity length in such a way that the zero crossing point is no longer the point of maximum power in the cavity nor is it the point where the input beam mode in the cavity is maximized.
I Introduction
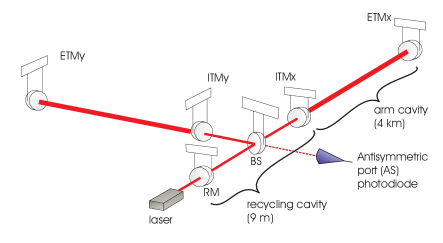
The Laser Interferometer Gravitational Wave Observatory (LIGO) Abramovici et al. (1992); Fritschel (2001); Abbott et al. (2004) is a set of three kilometer-scale suspended interferometers for the detection of gravitational waves from astronomical sources Weiss (1999); Hough et al. (2005). Each of the three detectors consists of coupled optical cavities with the basic arrangement of a Michelson interferometer as shown in Fig. 1. In this paper we are primarily concerned with the behavior of the recycling cavity. The LIGO recycling cavity was designed to be optically stable at full input power, which implies thermally induced lensing of the recycling cavity optics during full power operation Beusoleil et al. (2003); Kells and Camp (1997). In addition to the thermal lens produced by the resonating beams at full power, active tuning of the input test mass effective radii of curvature is achieved by a thermal compensation system Frolov (2005) which uses a laser to heat the surface of the test ITM’s, creating a thermally induced lens. Without the thermal compensation system, and especially at low input power, the LLO recycling cavity is optically unstable. The thermal compensation system was installed because the instability made proper interferometer operation difficult. In addition to the effects described in this paper, the marginal instability of the recycling cavity lead to reduced optical gain and extremely high sensitivity to alignment fluctuations. This lead to greater than expected sensitivity to seismic motion and made the wavefront sensor alignment system Fritschel (1998); Bhawal (2004) very difficult to operate.
In this paper, we present measurements of the fields in the recycling cavity when the thermal compensation system is not operating and input power is set low enough so that no significant thermal lensing occurs due to absorption of the resonating beam in the cavity optics. In other words, we were studying the unstable cavity behavior. The measurements are then compared to a detailed numerical model. In the absence of thermal lensing, the recycling cavity is optically unstable with which takes into account the curvature of the input test masses, the recycling mirror and also the slight curvature of the beamsplitter. Therefore, the recycling cavity beam is not matched to the fundamental optical mode of the stable interferometer arm cavities, nor to the input beam which is designed to closely match the fundamental mode of the arms. In this “cold” condition, the optical fields that resonate only in the recycling cavity exhibit a ringlike structure. The spatial structure of these fields is very sensitive to small angle or length perturbations of the cavity. Basically, this occurs because marginally unstable cavities have non-separable boundary conditions on the optical fields, leading to mode degeneracy. So, the cavity will resonate arbitrary TEM fields as long as the optical loss is small. To model the detailed behavior, it is no longer efficient to express the cavity field in terms of the usual Hermite-Gaussian (or Laguerre-Gaussian) modes E. D’Ambrosio (2006). We therefore chose to compare our measurements to a numerical simulation based on the Fast Fourier Transform as opposed to a simulation based on the propagation of cavity modes. The simulation software used is referred to as ”The FFT Model” Bochner (1998). As a result of the sensitivity of the transverse field distribution to small length changes, we find that the Pound-Drever-Hall error signal Drever et al. (1983) used to control the length of the cavity is modified and the lock-point develops an unexpected offset.
We tested the model against actual interferometer behavior by applying a series of offsets to the error point of the length loop of the recycling cavity of the Livingston interferometer LLOwebsite . The length loop of the recycling cavity controls the position of the recycling mirror.
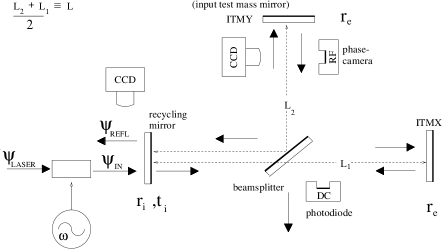
In this paper, the phrase “cavity length” always refers to the common arm length of the cavity, that is the sum of the two optical paths in the cavity, to ITMx and ITMy, divided by two (the quantity in Figure 2). By contrast, the differential arm length is the difference of the two optical pathlengths divided by two. In order to lock the recycling cavity, we need to control both the common arm length of the cavity and the differential arm length of the cavity. The error signal for the common arm length is generated at the reflected port using the light returning from the recycling mirror. The differential length is sensed at the antisymmetric port using the very small amount of sideband light that manages to enter the cavity, despite being non-resonant, and leaks out of cavity via the beamsplitter. The differential armlength is controlled by simultaneously actuating on the beamsplitter and recycling mirror in such a way that a pure differential arm length change is achieved. The common arm length, or just “the cavity length” is controlled by actuating on the recycling mirror alone.
We recorded the power in the recycling cavity for a range of cavity length loop error point offsets and also acquired images of the light distribution inside the cavity and on reflection from the cavity. We then compared our results to those of the simulation. Although the FFT Model has previously been used to gain insight into power build-up effects of the LIGO interferometers D’Ambrosio (2004), this study is unusual in that it provides a direct, well controlled, quantitative comparison between the predictions of the model and the observed interferometer behavior.
II Measurement Overview
The light entering the interferometer consists of carrier light (the main laser frequency) and upper and lower phase-modulation sidebands with modulation index . When the interferometer is operating in its normal, fully locked configuration, the carrier resonates in both the recycling cavity and in the arm cavities, while the sidebands resonate only in the recycling cavity. To make the optical fields easier to model and to make the results easier to interpret, most of our measurements were taken when the arms were unlocked and the recycling cavity was locked so that only the carrier was resonant in the recycling cavity while the sidebands were non-resonant. By adding an offset to the error point of the Pound-Drever-Hall locking servo controlling the position of the recycling mirror, we induced small length changes of the cavity with respect to the null point of the servo. We could change the cavity length by several nanometers before lock was lost. The length offset was calibrated in terms of actual cavity length change in nanometers Gretarsson (2004) which allowed a quantitative comparison between our simulation results and the experimental data. We obtained the cavity power as a function of the length offset and obtained images of the cavity beam profile at various offsets. We also made preliminary measurements with the full interferometer locked. No attempt was made to model the fields in the fully locked interferometer.
The schematic diagram in Fig. 2 illustrates the general configuration and introduces notation to be used later. To obtain information about the intensity distribution of the fields interacting with the cavity, we used two CCD cameras: One captured the light reflected from the cavity and the other captured light picked out of the cavity by means of the slightly wedged antireflective side of one of the mirrors (ITMy). We measured the power in the cavity using a calibrated DC photodiode to monitor the intensity of the beam picked off at the slightly wedged, antireflective side of the beamsplitter. The beam picked off at the antireflective side of the beamsplitter, like the beam picked off at the antireflective side of the arm input test masses, is a good representation of the recycling cavity beam.
In the case of the fully locked interferometer, additional methods were required to provide information about the sidebands in the recycling cavity. When the full interferometer is locked, the recycling cavity field intensity is dominated by the carrier so we could not use a DC coupled photodiode or a CCD camera for the purpose of interrogating the RF sidebands. To measure the intensity of the sidebands, we used an RF photodiode whose signal was demodulated at twice the sideband frequency. This photodiode received a highly focused version of the beam picked off from the antireflective side of the beamsplitter. The signal from this photodiode is called NSPOB and is proportional to the geometric mean of the power in the upper and lower sidebands. We employed a similar technique to measure the spatial profile of the sideband intensity using a “phase camera” Goda et al. (2004). The phase camera rapidly scans an enlarged version of the beam over an RF photodiode which is very small compared to the size of the enlarged beam. Like the NSPOB signal, the signal from this RF photodiode is demodulated at twice the sideband frequency. However, due to the scanning, we now obtain a measurement of the spatial profile of the geometric mean of the upper and lower sideband intensities. The phase camera received the recycling cavity beam picked off from the slightly wedged antireflective side of ITMy.
III FFT Model Overview
The numerical simulation with which we compare our measurements—The FFT Model Bochner (1998)—is based on a Fortran program whose first step is a Fourier transformation of a grid representation of the optical field. In the wave vector domain, a matrix multiplication provides the propagation of the field; then, when the interaction with the optics must be reproduced, the optical field is Fourier transformed back from the momentum representation to the spatial one and each field element on the grid is multiplied by a phase delay describing the action of the optics. Once iterative propagation has terminated and the resulting fields are stationary, we construct the Pound-Drever-Hall error signal directly from the fields.
IV Results
IV.1 Carrier resonant in the recycling cavity, arms non-resonant
Figure 3 compares the resonant field intensity in the recycling cavity derived from the FFT model with the actual measured field intensity. The four panels represent the intensity distribution at four different cavity lengths, each 4 nanometers apart. Clearly, the intensity distribution changes dramatically with very small changes of the cavity length.
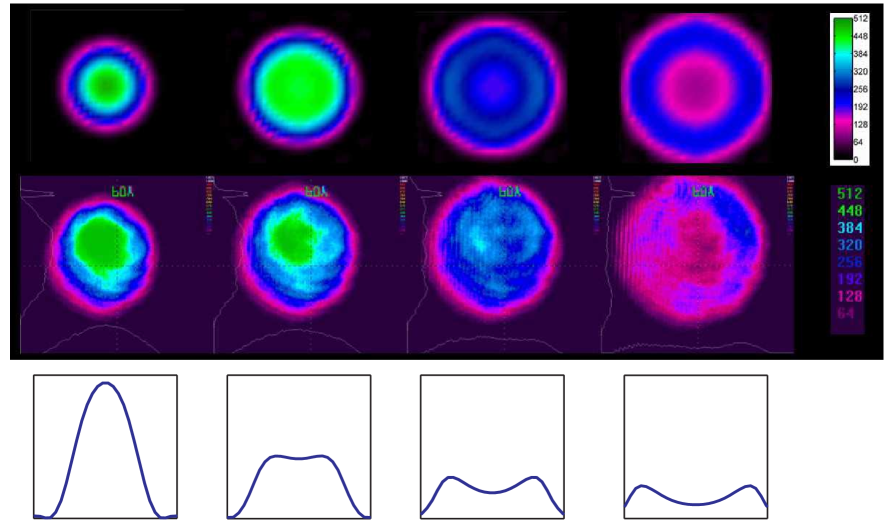
Note that the FFT model correctly reproduces the evolution of the beam shape as it goes from a one-peak profile to a donut and also shows the increase in beam size as the offset is changed between nm and nm, although the change in beam size is somewhat less pronounced in the data than in the model.
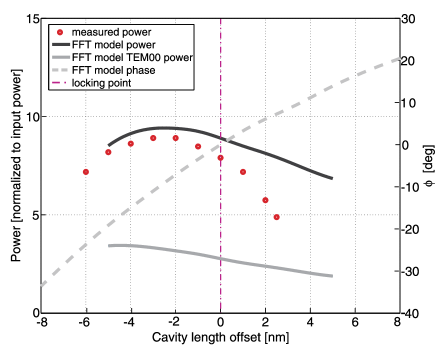
Figure 4 compares the measured cavity power with the prediction from the FFT model. The point of maximum power found by the FFT model agrees with the measurement as does the approximate power build-up. The fact that the power data fall generally below the prediction for the larger length offsets is likely due to a reduction in the gain of the loop controlling the cavity length. This produces a change in the calibration leading to an underestimation of the cavity length change for those offsets that are quite far from the point of maximum cavity power. The figure also shows the portion of the power in the mode, which is defined here as the mode of the input beam to the recycling cavity (fundamental mode of the modecleaner propagated through the mode-matching telescope towards the interferometer). By design, the input beam mode is closely matched to the fundamental mode of the 4 km arm cavities. Unexpectedly, and in contrast to the behavior seen in optically stable cavities (even ones whose input beams are not matched to the cavity mode) the FFT model shows that the power in the component is maximized even further from the locking point than the total cavity power.
To gain insight into this unusual behavior, we write down a general expression for the Pound-Drever-Hall error signal that makes no assumptions about the spatial profile of the beams involved. The notation refers to the fields indicated in Fig. 2. The Pound-Drever-Hall error signal is generated by phase modulating the input beam to the cavity. The input field can be expanded in terms of Bessel functions
| (1) |
where is the modulation frequency and is the modulation index. (In our case, and .) The input field is therefore often considered as three collinear beams: the carrier, , and a pair of sidebands, and , with frequency separation on either side of the carrier frequency. The modulation frequency is such that when the carrier beam is resonant in the recycling cavity (without the arms resonant), the sidebands are nearly anti-resonant and thus nearly totally reflected from the input mirror (the recycling mirror). In these circumstances, only the carrier is significantly sensitive to the geometrical features of the cavity, including length variations or alignment, as described by the equations
| (2) |
where the operator incorporates the effect of the cavity on the resonant carrier. The total reflected power is the integral of the squared field over an area much larger than the beam size.
| (3) |
We are interested in the error signal for the length of the cavity. This error signal, which controls the position of the recycling mirror, is basically the same as the error signal from a simple two-mirror cavity. The error signal, which we call here, is the cosine-phase of the demodulated voltage from an RF photodiode placed at the reflected port sensing . The beam is focused onto the active area of the RF photodiode so that no beam clipping occurs. Using the modulation frequency to demodulate the signal from this photodiode, we find that one term survives.
| (4) |
where indicates the real part, is the effective integration time of the sensing chain and is an overall constant representing the efficiency of the photo-detection and the gain of the sensing chain. Rewriting the integrals as inner products brings out the structure —
| (5) |
where indicates the imaginary part. Equation (5) makes it obvious that the error signal is generated only from the component of the returning carrier that is in the mode of the input beam.
In stable cavities, different spatial modes of the cavity are separated by a discrete Gouy phase and therefore resonate at slightly different cavity lengths. The Pound-Drever-Hall servo generates a large error signal whenever the cavity field has large overlap with the mode of the input beam. Using mode-matching optics, we normally arrange for large overlap to occur with only one of the cavity modes (usually the fundamental mode). The Pound-Drever-Hall servo will lock the cavity onto the chosen mode because this is the only mode contributing significantly to the error signal. When the cavity locks on a low-loss mode to which the input beam is well matched, large buildups of that cavity mode can occur. In that situation, the imaginary part of the overlap integral in Eq. (5) becomes zero precisely when the phase of the carrier component exiting the cavity through the input mirror matches the phase of the input beam and is therefore 180∘out of phase with the promptly reflected beam. This maximizes the power of the component of the cavity field that is in the mode of the input beam, because this component of the cavity field experiences a destructive phase condition with the promptly reflected beam. In short, when is zero, we get maximum power in that component of the cavity field that is in the mode of the input beam. For stable cavities, where the shape of the cavity mode does not change with small length changes of the cavity, must therefore also correspond to the point of maximum cavity power, regardless of mode.
For marginally unstable cavities the eigenmode decomposition breaks down and we observe that the transverse shape of the cavity beam depends strongly on the cavity length. The Pound-Drever-Hall error signal is modified by this spatial dependence in such a way that minimization of the error signal, and therefore the natural lock point, no longer corresponds to maximizing the input beam mode component of the cavity field. Nor is there any particular reason to expect that the overall cavity power is maximized at the natural lock point. From the naive point of view therefore, the servo has developed an offset. As discussed above, this effect was clearly seen in the LLO recycling cavity data and in the model.
The dependence of the cavity beam shape on the cavity length is probably due to two effects. First, as the fields inside the cavity propagate, they spread out slightly due to diffraction. Thus, fields corresponding to consecutive cavity traversals do not have exactly the same spatial beam profile. With length changes alone, it’s therefore not possible to enforce constructive superposition everywhere in the cavity between beams that have traversed the cavity a different number of times. Thus, beam propagation within the cavity is bound to lead to beam shaping, simply due to the fact that some regions will have constructive superposition while others have destructive superposition. In addition, this shape can be expected to depend strongly on the cavity length since even a small change in the cavity length alters the interference condition between cavity traversals. Secondly, the shape and location of regions of destructive phase between the cavity beam and the promptly reflected beam at the input mirror depends on the intensity and phase profile of the cavity beam. Thus, the shape and location of those regions at the input mirror where light is efficiently coupled into the cavity also change with microscopic cavity length changes. Under these conditions, the power of the input beam mode in the cavity is set by a combination of direct coupling of the input beam mode into the cavity (requiring destructive interference with the promptly reflected beam) and the transferral of power coupled into the cavity in a combination of modes into the mode of the input beam. Since destructive interference of the input beam mode in the cavity with the promptly reflected beam corresponds to , we should not be surprised to find that this alone does not lead to maximum input beam mode power in the cavity. And of course there is no obvious reason to expect the overall cavity power to be maximized for zero error signal either. Indeed, we have no particular reason to expect that the cavity length offset corresponding to maximum overall cavity power corresponds to the point of maximum power in the input beam mode component of cavity field, as illustrated by the FFT model results.
Qualitatively consistent behavior has been observed at LIGO Hanford Observatory (LHO) in the marginally unstable recycling cavities of their interferometers Kells (1997); Ottaway_Private (2005). As in the LLO interferometer, the maximum cavity power build up occurs only when an offset is applied to the natural lock point. Transverse beam profile changes are evident as well. (In fact, these effects were first seen at LHO, and subsequently at LLO, several years before the current study to quantitatively compare the FFT Model predictions with the LLO behavior was begun.)
The high level of agreement between the experimental observations and the predictions of the FFT Model, indicate that the observed loop offset is a true optical effect (not due to a simple technical problem such as unintended offsets in the control electronics). Such an offset can therefore be expected to develop in any marginally unstable cavity locked by the Pound-Drever-Hall technique and the resonant points of such cavities may need to be adjusted “by hand” to compensate.
IV.2 Full interferometer lock
When the full interferometer is locked Regehr (1998), the intensity in the recycling cavity is dominated by the carrier whose spatial structure is set by the input conditions to the arm to be the mode of the optically stable arm cavities. This is due to the fact that the arms are overcoupled. Thus, the total carrier field (promptly reflected field plus leakage field) returning from the arms is 180 degrees out of phase with the promptly reflected field alone and has approximately the same magnitude as the incident field. As a result, the recycling cavity length leading to resonance of carrier light that is also resonant in the arms is different by one half wavelength than the length leading to resonance of carrier light that is not resonant in the arms. In other words, higher order carrier modes (in the basis of the arms) are anti-resonant in the recycling cavity while the mode of the arms is resonant. Thus, the carrier field in the recycling cavity is entirely in the mode of the arms. Now, the frequency of the sidebands was chosen such that they would be resonant in the recycling cavity without resonating in the arms precisely when the carrier that does resonate arms is resonant in the recycling cavity. Thus, the recycling cavity light is a mixture of mode carrier light and sideband light in a very large number of modes, with the carrier light dominating the intensity due to the greater power in the carrier.
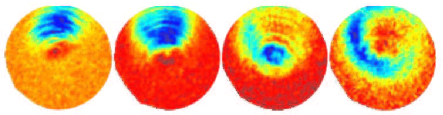
The sidebands, being non-resonant in the arms experience almost identical conditions as the carrier in Section IV.1 (where the carrier is resonant in the recycling cavity with the arms non-resonant). Therefore, we can expect the field structure of the sidebands in the full lock to be qualitatively similar to the carrier field distribution of Section IV.1. The input power to the recycling cavity during these measurements (roughly one Watt) was insufficient to generate significant thermal lensing in the recycling cavity optics, even when the interferometer was fully locked. As before, the thermal compensation system was not operating. Phase camera images of the sideband intensity taken from the beam picked off at the antireflective side of ITMy are shown in Fig. 5 at four different recylcing cavity length loop offsets. For technical reasons, we did not obtain a calibration of the length loop offset in terms of cavity length change.
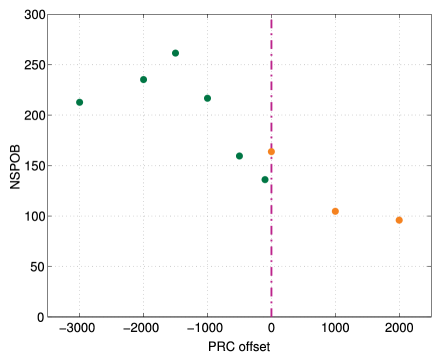
Figure 6 shows the (geometric mean of the) power of the sidebands in the recycling cavity as the cavity length is changed. The x-axis shows the offset added to the error point in uncalibrated counts. The y-axis is the value of the interferometer NSPOB signal, which measures the geometric mean of the upper and lower sideband powers. Note that we see a much larger change in the sideband intensity in this fully locked state than the change in the carrier intensity for the carrier lock in the recycling cavity. The reason for this may be that as the profile of the sidebands in the recycling cavity begins to better match the resonating mode of the arm cavities, a larger fraction of the beam is exactly on anti-resonance and is totally reflected from the arm thus enhancing the build up of the sidebands in the recycling cavity.
As expected, the qualitative behavior of the sideband power and the qualitative transverse profile changes of the sidebands are the same as those seen in Section IV.1. As before, the shape of the cavity beam changes as a function of small length changes of the cavity, and the lock point does not correspond to maximum sideband power in the cavity. Although we could not extract the component of the sidebands from the intensity alone, it seems likely based on the analysis of Section IV.1 that it is also not maximized.
Acknowledgements
The continuing and reliable operation of the LIGO interferometer at Livingston was made possible by the hard work of our many commissioning colleagues. Rana Adhikari taught one of the authors [AMG] how to understand the LIGO Livingston interferometer and also provided useful comments for the paper. David Ottaway read versions of the manuscript and shared insights based on his considerable knowledge of the interferometer optics. He was also one of the first people to appreciate the importance of the non-gaussian structure of the sidebands in the LLO recycling cavity, first seen during installation and commissioning of the LLO phase camera with one of the authors [AMG]. Bill Kells and David Ottaway provided information about the LHO results and Bill Kells pioneered the application of the Eikonal optical model. The authors thank Riccardo DeSalvo and David Reitze for encouraging the submission of the manuscript for publication. Finally, Keita Kawabe provided a careful internal (LSC) review of the manuscript and made observations leading to improvements. LIGO was constructed by the California Institute of Technology and Massachusetts Institute of Technology with funding from the National Science Foundation and operates under cooperative agreement PHY-0107417. This paper has LIGO Document Number LIGO-P070044-02-Z .
References
- (1)
- Abbott et al. (2004) Abbott et al., “Detector description and performance for the first coincidence observations between LIGO and GEO,” Nucl. Instr. and Methods A517, 154-179 (2004). URL http://www.ligo.caltech.edu/docs/P/P030024-01/P030024-01.pdf
- Abramovici et al. (1992) A. Abramovici, W.E. Althouse, R.W.P. Drever, Y. G rsel, S. Kawamura, F.J. Raab, D. Shoemaker, L. Sievers, R.E. Spero, K.S. Thorne, R.E. Vogt, R. Weiss, S.E. Whitcomb and M.E. Zucker, “LIGO: The Laser Interferometer Gravitational-Wave Observatory,” Science 256, 325-333 (1992).
- Fritschel (2001) P. Fritschel, R. Bork, G. Gonz lez, N. Mavalvala, D. Ouimette, H. Rong, D. Sigg and M. Zucker, “Readout and Control of a Power-Recycled Interferometric Gravitational-Wave Antenna,” Applied Optics 40, 4988-4998 (2001). URL http://resolver.caltech.edu/CaltechAUTHORS:FRIao01
- Weiss (1999) R. Weiss, “Gravitational Radiation,” Reviews of Modern Physics 71 S187-S196 (1999).
- Hough et al. (2005) J. Hough, S. Rowan and B.S. Sathyaprakash, “The Search for Gravitational Waves,” arXiv.org, gr-qc/0501007. URL http://arxiv.org/abs/gr-qc/0501007
- Beusoleil et al. (2003) R. Beusoleil, E. D’Ambrosio, B. Kells, J. Camp, E. Gustafson, and M. Fejer, “Model of thermal wave-front distortion in interferometric gravitational-wave detectors. I. Thermal focusing,” J. Opt. Soc. Am. B 20, 1247-1268 (2003). URL http://arxiv.org/abs/gr-qc/0205124
- Kells and Camp (1997) B. Kells and J. Camp, “Absorption in the Core Optics and LIGO Sensitivity,” LIGO Document Control Center, T970097-01 (1997). URL http://www.ligo.caltech.edu/docs/T/T970097-01.pdf
- Frolov (2005) S. Ballmer, V. Frolov, R. Lawrence, W. Kells, G. Moreno, K. Mason, D. Ottaway, M. Smith, C. Vorvick, P. Willems and M. Zucker, “Thermal Compensation System Description,” LIGO Document Control Center, T050064-00 (2005). URL http://www.ligo.caltech.edu/docs/T/T050064-00.pdf
- Fritschel (1998) P. Fritschel, N. Mavalvala, D. Shoemaker, D. Sigg, M. Zucker and G. Gonzalez, “Alignment of an Interferometric Gravitational Wave Detector,” Applied Optics 37, 6734-6747 (1998). URL http://www.ligo.caltech.edu/docs/P/P970017-A.pdf
- Bhawal (2004) B. Bhawal, “The Effect of Thermal Lensing on Wave-Front Sensor signals,” LIGO Document Control Center, T040066-00 (2004). URL http://www.ligo.caltech.edu/docs/T/T040066-00.pdf
- E. D’Ambrosio (2006) E. D’Ambrosio and W. Kells, “Carrier mode selective working point and side band imbalance in LIGO I,” Physical Review D 73, 122002-26 (2006). URL http://authors.library.caltech.edu/3586/01/DAMprd06.pdf
- Bochner (1998) B. Bochner, “Modelling the Performance of Interferometric Gravitational-Wave Detectors with Realistically Imperfect Optics,” Ph.D. Thesis, Massachusetts Institute of Technology (1998). URL http://www.ligo.caltech.edu/docs/P/P980004-00.pdf
- Drever et al. (1983) R.W.P. Drever, J.L. Hall, F.V. Kowalski, J. Hough, G.M. Ford, A.J. Munley and H. Ward, “Laser phase and frequency stabilization using an optical resonator,” Applied Physics B 31, 97-105 (1983).
- (15) LIGO Livingston Obseratory web site, URL http://www.ligo-la.caltech.edu. The measurements described were made during March, 2004.
- D’Ambrosio (2004) E. D’Ambrosio, “Study of the different responsive behaviour of the sidebands in LIGO I,” Class. and Quant. Gravity 21, S1113-S1120 (2004).
- Gretarsson (2004) Andri M. Gretarsson, Valera Frolov, Exerpt from the LLO electronic detector logs, LIGO Document Control Center, T070074-00(2004). URL http://www.ligo.caltech.edu/docs/T/T070074-00.pdf
- Goda et al. (2004) K. Goda, D. Ottaway, B. Connelly, R. Adhikari, N. Mavalvala, and A. Gretarsson, “Frequency-resolving spatiotemporal wave-front sensor,” Opt Lett 29, 1452 (2004). URL http://www.ligo.caltech.edu/docs/P/P030069-00.pdf
- Kells (1997) B. Kells, “Distorted PRM SB fields in Eikonal approximation,” LIGO Document Control Center, T070074-00(2004). URL http://www.ligo.caltech.edu/docs/T/T040195-02.pdf. And references to the LIGOHanford interferometer logs therein.
- (20) David Ottaway, LIGO Project MIT, MIT, NW22-295, 185 Albany Street, Cambridge, MA 02139, USA. (Personal Communication, 2005).
- Regehr (1998) M. Regehr, “Signal Extraction and Control for an Interferometric Gravitational Wave Detector,” Ph.D. Thesis, California Institute of Technology (1994). URL http://www.ligo.caltech.edu/docs/P/P940002-00.pdf