Optical colours of AGN in the Extended Chandra Deep Field South: Obscured black holes in early type galaxies
We investigate the optical colours of X-ray sources from the Extended Chandra Deep Field South (ECDFS) using photometry from the COMBO-17 survey, aiming to explore AGN - galaxy feedback models. The X-ray sources populate both the “blue” and the “red sequence” on the colour-magnitude diagram. However, sources in the “red sequence” appear systematically more obscured. HST imaging from the GEMS survey demonstrates that the nucleus does not affect significantly the observed colours, and therefore red sources are early-type systems. In the context of AGN feedback models, this means that there is still remaining material after the initial “blowout”. We argue that this material could not be only left-over from the original merger, but a secondary cold gas supplier (such as minor interactions or self-gravitational instabilities) must also assist.
Key Words.:
Galaxies: evolution – Galaxies: colours – X-rays: galaxies1 Introduction
The interplay between star formation and AGN activity in galaxies is one of their most striking properties. Both phenomena are often linked with merger events (e.g. Larson & Tinsley, 1978; Stockton, 1982) and this was for years considered their only connection. The mass of the black hole is found to be tightly correlated with properties of the host galaxy, such as the bulge luminosity (Magorrian et al., 1998), its mass (Merritt & Ferrarese, 2001) and its velocity dispersion ( relation; Ferrarese & Merritt, 2000; Gebhardt et al., 2000) suggesting that there is a close connection of the central engine with its host galaxy. These observational trends have been taken into account in early, semi-analytical models of AGN - host galaxy co-evolution (e.g. Kauffmann & Haehnelt, 2000), which managed to predict many of their observational characteristics, such as the quasar luminosity function and its evolution.
Modern evolutionary models of AGN track the evolution of major merger events, which are common in redshifts (Conselice et al., 2003). They take into account feedback from the starburst itself through supernova explosions and the central super-massive black hole (Granato et al., 2004; Monaco, 2004). Feedback can heat the cold gas supply which feeds both the starburst and the AGN, thus regulating the activity in galactic centres. AGN and QSO evolution models accounting for feedback (e.g. Hopkins et al., 2005a, b, 2006) predict that the AGN is obscured for most of its lifetime (see also Page et al., 2004) and is directly observable only at the later stages, when the majority of cold gas has been swept away and before it stops accreting because of fuel shortage. Such a scenario supports previous claims giving similar predictions (Sanders et al., 1988). At the last stages of its evolution, the AGN can maintain low level activity by accreting hot surrounding gas in a so called ‘radio mode’ (Croton et al., 2006) or from fresh gas supply as a result of interactions with other systems (Cavaliere & Vittorini, 2000; Mouri & Tanigushi, 2004; Menci et al., 2004; Vittorini, Shankar & Cavaliere, 2005).
A useful tool for testing the implications of such models is the inspection of the optical colours of the galaxies. A bimodal distribution has been observed in the colour-magnitude diagram (Baldry et al., 2004; Bell et al., 2004), which is explained with star formation (e.g. Menci et al., 2005). The red cloud is populated by old systems that are passively evolving, whereas blue galaxies owe their colour to active star formation. According to popular models of AGN evolution, galaxies start their lives in the blue cloud and they migrate to the red sequence when star formation is quenched and the AGN can be directly viewed. Nandra et al. (2007) used the colour distribution of a number of X-ray selected AGN in the AEGIS survey (Davis et al., 2007) to show that they are preferably located in the red sequence and the “valley”, between the red sequence and the blue cloud. According to these authors, this reflects the emergence of the AGN only at the latest stages of quasar evolution. However, there still remain a few issues that need to be addressed. The obscuration status of X-ray selected AGN poses a problem when interpreting it with standard models and the contribution of the nucleus to the colour of the galaxy is still unclear.
2 Data
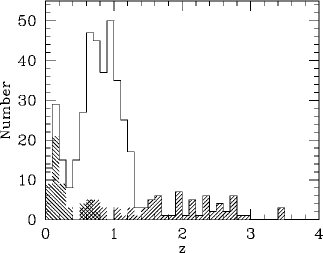
We select our X-ray sources using the public catalogue of the Extended Chandra Deep Field South (ECDFS; Lehmer et al., 2005), which reaches depths of erg cm-2 s-1 and erg cm-2 s-1 in the keV and keV bands respectively. We combine these data with the optical catalogue of the ECDFS from the COMBO-17 survey (Wolf et al., 2004), which provides photometric redshifts, as well as rest-frame optical colours for most of the sources. Within a search radius of 3 arcsec, we find optical counterparts for 578 of the 762 ECDF-S sources, 421 of which with calculated photometric redshifts. The redshift distribution of those sources is shown in Fig. 1 (main histogram). Among the X-ray sources in the ECDFS there are normal galaxies, which do not host an AGN. We use X-ray criteria ( erg s-1; ; see Bauer et al. 2004) to identify them and remove them from our AGN sample. As can be seen in Fig. 1 (shaded histogram) they are confined in redshifts .
The COMBO-17 catalogue provides rest-frame optical colours for all sources whose SED is fitted with a “galaxy” template but not for optical QSOs where the light of the AGN dominates the broad-band spectrum. In those cases we calculated the rest-frame colours assuming a power-law spectrum with slope and corrected the results by 0.5 mag. This method introduces an r.m.s. scatter of 0.24 mag according to Wolf et al. (2003), which is reasonable for the scope of this study, as optical QSOs are a small fraction, 21% in all redshifts and 7% in redshifts . Moreover, they occupy a distinct region of the colour-magnitude diagram and their optical colours are dominated by the nuclear regions (see next paragraphs), therefore they are not considered for statistical evaluations.
In the following discussion, we will focus on the redshift range of , unless otherwise stated to encompass the peak of the redshift distribution of AGN participating in the formation of the X-ray Background (Barger et al., 2005). This redshift selection includes 63% of sources with a super-massive black hole (moderate AGNs and QSOs) and 74% of moderate AGNs (fitted with a “galaxy” template - non QSOs). As can be seen in Fig. 1, at there is the bulk of normal galaxies (see also Zheng et al., 2004, for the central region) and at there are many optical QSOs (see also Wolf et al., 2004).
3 Results
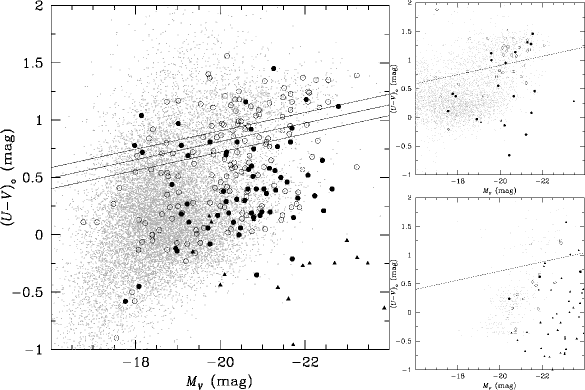
The colour-magnitude diagram is often used to examine the evolution of different kinds of galaxies (see Baldry et al., 2004; Bell et al., 2004). We plot the Johnson optical rest-frame colour versus the rest-frame magnitude (Vega magnitudes) in Fig. 2. The main (left) diagram refers to sources in the main redshift range (), whereas the diagrams on the right refer to sources with (upper) and (lower). We use different symbols for plotting obscured and unobscured sources according to their hardness ratios. Open circles mark sources with (corresponding to for and intrinsic ) and filled circles mark sources with , whereas sources with QSO templates are marked with a filled triangle (all have ) and occupy a distinct region in the CMD.
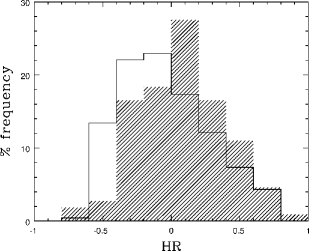
In Fig. 2 we can see that sources in the main redshift range and in the red sequence appear harder than those in the blue cloud and the region in between. Only 9 (14%) of the unobscured sources () have red colours (; Bell et al., 2004) while 28% of all sources are red. The hardness ratio histograms for blue (shaded) and red sources are shown in Fig. 4, where although both distributions have large scatters (see also Akylas et al., 2006), it is clear that red sources are generally harder. To statistically evaluate this trend, we use the Kolmogorov - Smirnov test and find that within 99.9% the blue and red sources are drawn from different populations in terms of hardness ratio. However, there is a number of sources having upper or lower limits in their hardness ratios, which might affect this result. To overcome this we created a hard and a soft sub-sample of our sources (with hardness ratio lower and upper limits respectively) and performed the Gehan’s test to each sub-sample separately to check if the blue and red sources are drawn from different populations in terms of . In both cases the probability is higher than 98.7%. For the sources outside the main redshift range, the statistical significance of this trend is much lower, the null hypothesis is 34.6% and 10.6% probable for low and high redshift sources respectively. The fact however remains that we can see a significant number of obscured sources in the red cloud.
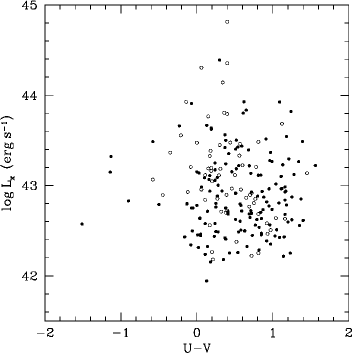
The ratio of X-ray obscured to unobscured sources is related to the X-ray luminosity (Ueda et al., 2003; Akylas et al., 2006), as galaxies with lower X-ray luminosity tend to be more obscured. The association of red systems with enhanced X-ray obscuration could affect the X-ray luminosity, if the red sources were less X-ray luminous. To estimate the effect of this we calculate the X-ray luminosities in the keV band for the AGN of Fig. 2 (left). This X-ray band is affected by absorption, and we have applied a correction based on the hardness ratio of each source. We have assumed a power-law X-ray spectrum with an intrinsic (Nandra & Pounds, 1994), obscured by an optimum hydrogen column density () to reproduce the observed hardness ratio.
In Fig. 3 we plot the intrinsic X-ray luminosity against the colour. The soft X-ray sources (with ) are more luminous than the hard (with ), at the 99.7% significance level. However, we do not observe any correlation between the X-ray luminosity and the optical colour. The average luminosity of the AGN in the red cloud is marginally lower than this of the blue, but the probability that those two populations are drawn from the same parent distribution is 54.5%, which does not allow any correlation. Therefore, we conclude that the obscuration detected toward red galaxies is not a luminosity effect.
An issue which still remains unresolved is the impact the nucleus has in the optical colours. High resolution optical images have been taken with the HST by Rix et al. (2004) in the GEMS survey (Galaxy Evolution from Morphology and SEDs). This survey covers the outskirts of the ECDFS in (F606W) and (F850LP), while the inner region is observed with the HST as part of the GOODS survey. These data have been re-reduced by the GEMS team to obtain a smooth field. Optical inspection of the and images reveals that red sources are mostly associated with early type galaxies, in agreement with Bell et al. (2004b), while the nuclear region affects the sources with the bluest optical colours.
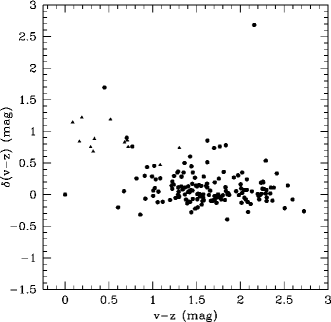
We used the and GEMS images to estimate the contribution of the nucleus to the colour of the system. We conducted photometry to the optical sources related to X-ray sources and repeated this excluding a central region of radius 0.3 arcsec ( kpc for ) and compared the results. The change in the (observer’s frame) colour with respect to it is shown in Fig. 5. We can see that although there is some scatter in the colour difference around its mean value, this remains close to zero. Only 11 sources (7.1%) have and we do not detect any sources with red nuclei which affect the overall colour. Therefore we can safely regard optical rest-frame colours (roughly corresponding to observer’s frame for ) as a property of the host galaxy and not the AGN. An exception are optical QSOs which as can be seen in Fig. 5 owe their colour to the blue nucleus.
Since the nuclear light has little impact on the overall colour of the system, this can be attributed to either an old stellar population or a dusty starburst. Roche et al. (2003) find that many red galaxies in the CDFS/GOODS fields have large amounts of dust which define their optical colours. Dust lanes away from the AGN (e.g. Radomski et al., 2003) could redden the system and still be far from the nucleus, so that the nuclear light would not dominate the overall colour. However, optical inspection of their GEMS morphologies reveal early type structures, according to the findings of Bell et al. (2004b). We therefore assume that dust has a minimal contribution to the optical colours of the majority of sources in the red cloud.
So far we have seen that AGN having red colours have late-type morphologies (are thus evolved) and at the same time show evidence of X-ray obscuration. According to galaxy-AGN evolution models invoking AGN (and/or starburst) feedback (e.g. Hopkins et al., 2006), AGN should shine unobscured at the latest stages of their evolution, as a result of the “blowout” of the obscuring material. However, AGN feedback has a lower efficiency at lower black hole masses (e.g. Fabian, 1999; Granato et al., 2004; Shankar et al., 2006), so we do expect some residual obscuring material when the black hole mass is relatively low. To test this assumption, we need to estimate these masses. The galaxies in the red cloud in our AGN sample have elliptical-type morphologies, so their optical luminosities can reveal the masses of their nuclear sources (Magorrian et al., 1998). We use the band luminosity and calculate: , according to Lauer et al. (2007). The X-ray luminosity on the other hand is tightly related to the total bolometric luminosity, depending on the accretion rate. We use the luminosity-dependent bolometric correction from Hopkins et al. (2007), using the hard () X-ray luminosity (which is less affected by obscuration) to derive the bolometric luminosity of the AGN: . We can then calculate the Eddington rate at which mass is accreted to the central black hole as: , where is given in erg s-1.
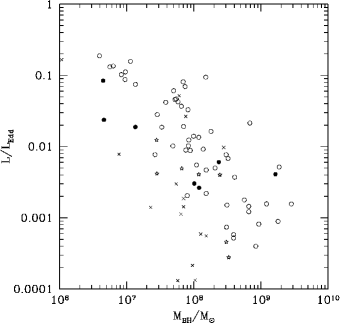
In Fig. 6 we plot the Eddington rate against the mass of the central black hole for red sources. Obscured sources (having ) within the main redshift range () are plotted with open circles and unobscured with filled circles. Sources with are plotted with crosses and stars if they are obscured and unobscured respectively. We note that the masses of the black holes of the red sources span across three orders of magnitude, reaching few times , characteristic of AGNs (see Shankar et al., 2004), so they are not considered the low end of the black hole mass function. Moreover, the obscured sources do not have lower masses compared with those which show no signs of X-ray obscuration, suggesting that the obscured red sources are not a result of lower black hole masses and a limited “blowout” efficiency. In Fig. 6 we can also see that the red AGN are accreting at sub-Eddington rates (generally ), while there is an obvious decrease in the Eddington rate with increasing black hole mass. This is a hint that the accretion rate is independent of the black hole mass, so it is probably regulated by the gas supply and not the size of the central black hole for galaxies in the red sequence. Lower redshift sources also have lower Eddington rates than those in the main redshift range, for their respective masses. For bluer sources we cannot estimate the black hole masses and Eddington rates because their morphologies are more complicated and a selection of the bulge part of the optical emission would be needed.
4 Discussion
The colour magnitude diagram (CMD) provides a useful tool to explore the evolutionary status of moderate luminosity AGN. X-ray selected sources tend to be optically more luminous than COMBO-17 sources (Fig. 2) and occupy the red end of the blue cloud, the red cloud and the region in between. Nandra et al. (2007) observed a similar distribution of X-ray sources in the AEGIS survey and interpreted it using models of QSO evolution based on AGN feedback (e.g. Hopkins et al., 2006). These models describe the migration of galaxies from the blue cloud to the red sequence when AGN activity becomes powerful enough to quench star formation sweeping away the obscuring material. However, the existence of a number of obscured sources in the red cloud in the Nandra et al. (2007) sample could not be straightforwardly explained with AGN feedback models, which predict that the AGN is unobscured at the latter stages of its evolution linking the obscuring with the star-forming gas. We extend this result by showing that red galaxies have early-type morphologies (they are not dust reddened) and are preferentially more obscured.
One important question that needs to be raised before associating early-type galaxies with obscured nuclei, is whether there are unobscured early-type galaxies in the blue cloud, just because their colours are contaminated by their nuclear light. There are some objects in Fig. 5 deviating from the average ‘galaxy’ colours, and the most extreme cases (those with ) are all not obscured members of the blue cloud according to the Bell et al. (2004) criterion and have morphologies resembling early-type galaxies. However, their number is small (7 sources out of 165 with GEMS counterparts) and they do not affect our result in great extent.
Since a red colour implies an old stellar population, there has to exist a mechanism that obscures the X-rays after the initial “blowout” of foreground cold gas by AGN feedback. The most obvious scenario has to do with the efficiency of the feedback. It is possible that lower mass AGN are not powerful enough to completely disrupt the surrounding gas, so residual material could both obscure and feed the AGN. The redshift range probed in this paper () is lower than this where massive galaxies are formed, and at lower redshifts the dark matter potential wells which reach virialization are shallower, as a result of the decrease in virialization time with the mass of the protogalaxy (Granato et al., 2004). However, the black hole masses we measure are not at the low end of the black hole mass function and obscuration seems not to be related with the black hole mass (see Fig. 6). Moreover, The X-ray luminosity of red sources is not less than this of blue sources, which means that the accretion rates of evolved systems are not lower. Both these make the “blowout efficiency” scenario less likely, however without ruling out that at least part of the obscuring gas is left-over from the initial blowout, especially for lower mass black holes.
If the original merger-driven material is disrupted as a result of AGN feedback, there has to be a secondary gas supply to both sustain AGN activity and obscure the AGN at later epochs. Croton et al. (2006) propose a ‘radio mode’ for the latest stages of quasar evolution, where AGN activity is preserved by the accretion of hot gas from the newly-formed galactic halo. The destruction of the star-forming cool gas (e.g. King, 2005) by the AGN causes the migration to the red sequence, while the hot halo continues to feed the AGN. This could explain the obscured red sources (although not the correlation between obscured AGN and red sources) if we assume that the hot halo can provide large enough column densities to obscure the X-rays. However, in such a scenario, galaxies in the red sequence would again be less luminous in X-rays, as a result of the lower accretion rates (Croton et al., 2006). The X-ray luminosities of the sources in the red cloud are not smaller than these of the blue cloud (see Fig. 3), disfavoring such a hypothesis and requiring a secondary cold gas supplier to re-fuel the system.
This secondary cold gas supply which revives the AGN and obscures the system could be a result of minor interactions with nearby galaxies or even self gravitational instabilities. Galaxy evolution models consider major mergers as the mechanism which transfers large amounts of cold gas into the central regions of galaxies, which is accreted into the black hole enlarging it, or even sometimes generating it. At the same time this cold gas triggers star formation episodes further away from the black hole. In cases of minor galaxy interactions, which are more common in redshifts , the gas supply is limited, and could not be enough to sustain star formation, while being enough to feed the AGN, as it needs a lower rate of gas supply to function (Mouri & Tanigushi, 2004). This cold gas could also provide the column density needed for obscuration. These AGN-dominant Seyferts have gone through the starburst-dominated phase, where the black hole experienced its main growth phase and are now passively evolving, having a more early-type morphology, like the red sources in our sample. Moreover, as their central black holes have already grown, they are accreting material at sub-Eddington rates, while the accretion is regulated by the gas supply and not the black hole mass. The decline of the Eddington rate (being significantly lower than one) with black hole mass seen in Fig. 6 supports this. Also, as seen in Fig. 6, red systems at lower redshifts () have lower Eddington rates for their respective black-hole masses, which is consistent with the decline of the galaxy interaction and merger rate with decreasing redshift (e.g. Le Fèvre et al., 2000).
The association of red galaxies with absorbed AGN has been witnessed earlier. Silverman et al. (2005) associates X-ray absorbed AGN hosts with red galaxies and finds evidence that the red colours reflect the presence of an early-type galaxy and not a reddened AGN (see also Georgakakis, Georgantopoulos & Akylas, 2006). Here, we further argue that the AGN does not influence the optical colours by directly measuring its contribution with HST imaging. Our early-type absorbed AGN population may bear some similarities with the Extremely Red Objects (ERO) population. Brusa et al. (2005) find that almost all of ERO X-ray sources with redshift information from the literature are obscured with (see also Severgnini et al., 2005). While our sources are not typically EROs111The red sources in our sample with available and measurements (Szokoly et al., 2004) have , while EROs have . Moreover, our red sources have X-ray to optical flux ratios typical of an AGN (; Lehmann et al., 2001), while EROs often have (Mignoli et al., 2004), they share some observational characteristics (colours redder than the respective median, X-ray absorption) and could be their analogous sources in more moderate redshifts (EROs usually have ; Georgakakis et al., 2005), at least of those not being dust reddened. Red evolved galaxies are therefore rather common, and theoretical models of galaxy and AGN evolution should be fine-tuned to predict such a behavior in evolved systems.
5 Conclusions
In this paper we used the rest-frame colours from the COMBO-17 survey to investigate the optical properties of X-ray selected ECDFS sources. We used HST imaging from the GEMS survey to examine the contribution of the nucleus, which we found minimal for moderate optical luminosity sources (not QSOs). We found that red sources tend to be more obscured in X-rays, while they are linked with optical early-type systems. This result enhances previous results finding X-ray obscuration in the red cloud (Nandra et al., 2007). Merger driven AGN-galaxy co-evolution models do predict obscuration in evolved systems after the effect of AGN feedback, but require lower black hole masses and accretion rates, something which is not supported by our data. However, fresh cold gas could re-fuel the system (e.g. through interactions with a nearby galaxy or even gravitational instabilities within the system) and in conjunction with residual cold gas from an incomplete blowout it could revive the AGN and obscure the system. In this case the accretion rate is regulated by the gas supply and the system is accreting at low Eddington rates, as demonstrated by our results. There a significant number of sources which are old and obscured, and theoretical models should consider this observational trend.
Acknowledgements.
ER wishes to thank the European Social Fund (ESF), Operational Program for Educational and Vocational Training II (EPEAEK II), and particularly the Program PYTHAGORAS II, for funding part of the above work. We thank A. Georgakakis for useful discussions and the use of his software. We also thank the anonymous referee for comments that improved the original manuscript.References
- Akylas et al. (2006) Akylas, A., Georgantopoulos, I., Georgakakis, A., Kitsionas, S., Hatziminaoglou, E., 2006, A&A, 459, 693
- Baldry et al. (2004) Baldry, I. K., Glazebrook, K., Brinkmann, J., et al., 2004, ApJ, 600, 681
- Barger et al. (2005) Barger, A. J., Cowie, L. L., Mushotzky, R. F., et al., 2005, AJ, 129, 578
- Bauer et al. (2004) Bauer, F. E., Alexander, D. M., Brandt, W. N., Schneider, D. P., Treister, E., Hornschemeier, A. E., Garmire, G. P., 2004, AJ, 128, 2048
- Bell et al. (2004) Bell, E. F., Wolf, C., Meisenheimer, K., et al., 2004, ApJ, 608, 752
- Bell et al. (2004b) Bell, E. F., McIntosh, D. H., Barden, M., et al., 2004, ApJ, 600, L11
- Brusa et al. (2005) Brusa, M., Comastri, A., Daddi, E., et al., 2005, A&A, 432, 69
- Cavaliere & Vittorini (2000) Cavaliere, A., Vittorini, V., 2000, ApJ, 543, 599
- Conselice et al. (2003) Conselice, C. J., Bershady, M. A., Dickinson, M., Papovich, C., 2003, AJ, 126, 1183
- Croton et al. (2006) Croton, D. J., Springel, V., White, S. D., et al., 2006, MNRAS, 365, 11
- Davis et al. (2007) Davis, M., Guhathakurta, P., Konidaris, N., et al., 2007, ApJL, in press (astro-ph/0607355)
- Fabian (1999) Fabian, A. C., 1999, MNRAS, 308L, 39
- Ferrarese & Merritt (2000) Ferrarese, L., Merritt, D., 2000, ApJ, 539, L9
- Gebhardt et al. (2000) Gebhardt, K., Bender, R., Bower, G., et al., 2000, ApJ, 539, L13
- Georgakakis et al. (2006) Georgakakis, A. E., Georgantopoulos, I., Akylas, A., 2006, MNRAS, 366, 171
- Georgakakis et al. (2005) Georgakakis, A., Afonso, J., Hopkins, A. M., et al., 2005, ApJ, 620, 584
- Granato et al. (2004) Granato, G. L, De Zotti, G., Silva, L., Bressan, A., Danese, L., 2004, ApJ, 600, 580
- Hopkins et al. (2006) Hopkins, P. F., Hernquist, L., Cox, T. J., et al., 2006, ApJS, 163, 1
- Hopkins et al. (2005a) Hopkins, P. F., Hernquist, L., Martini, P., et al., 2005, ApJ 625, L71
- Hopkins et al. (2005b) Hopkins, P. F., Hernquist, L., Cox, T. J., et al., 2005, ApJ, 630, 705
- Hopkins et al. (2007) Hopkins, P. F., Richards, G. T., Hernquist, L., 2007, ApJ, 654, 731
- Kauffmann & Haehnelt (2000) Kauffmann, G., Haehnelt, M., 2000, MNRAS, 311, 576
- King (2005) King, A., 2005, ApJ, 635, L121
- Larson & Tinsley (1978) Larson, R. B., Tinsley, B. M., 1978, ApJ, 219, L46
- Lauer et al. (2007) Lauer, T. R., Faber, S. M., Richstone, D., et al., 2007, ApJ, 662, 808
- Le Fèvre et al. (2000) Le Fèvre, O., Abraham, R., Lilly, S. J., et al., 2000, MNRAS, 311, 565
- Lehmann et al. (2001) Lehmann, I., Hasinger, G., Schmidt, M., et al., 2001, A&A, 371, 833
- Lehmer et al. (2005) Lehmer, B. D., Brandt, W. N., Alexander, D. M., et al., 2005, ApJS, 161, 21
- Magorrian et al. (1998) Magorrian, J., Tremaine, S., Richstone, D., et al., 1998, AJ, 115, 2285
- Menci et al. (2005) Menci, N., Fontana, A., Giallongo, E., Salimbeni, S., 2005, ApJ, 632, 49
- Menci et al. (2004) Menci, N., Cavaliere, A., Fontana, A., Giallongo, E., Poli, F., Vittorini, V., 2004, ApJ, 604, 12
- Merritt & Ferrarese (2001) Merritt, D., Ferrarese, L., 2001, MNRAS, 320, L30
- Mignoli et al. (2004) Mignoli, M., Pozzetti, L., Comastri, A., et al., 2004, A&A, 418, 827
- Monaco (2004) Monaco, P., 2004, MNRAS, 352, 181
- Mouri & Tanigushi (2004) Mouri, H., Taniguchi, Y., 2004, ApJ, 605, 144
- Nandra & Pounds (1994) Nandra, K., Pounds, K. A., 1994, MNRAS, 268, 405
- Nandra et al. (2007) Nandra, K., Georgakakis, A., Willmer, C. N. A., et al., 2007 ApJ, 660L, 11
- Page et al. (2004) Page, M. J., Stevens, J. A., Ivison, R. J., Carrera, F. J., 2004, ApJ, 611, L85
- Radomski et al. (2003) Radomski, J. T., Piña, R. K., Packham, C., 2003, ApJ, 587, 117
- Rix et al. (2004) Rix, H.-W., Barden, M., Beckwith, S. V. W., et al., 2004, ApJS, 152, 163
- Roche et al. (2003) Roche, N. D., Dunlop, J., Almaini, O., 2003, MNRAS, 346, 803
- Sanders et al. (1988) Sanders, D. B., Soifer, B. T., Elias, J. H., et al., 1988, ApJ, 325, 74
- Severgnini et al. (2005) Severgnini, P., Della Ceca, R., Braito, V., et al., 2005, A&A, 431, 87
- Shankar et al. (2006) Shankar, F., Lapi, A., Salucci, P., De Zotti, G., Danese, L., 2006, ApJ, 643, 14
- Shankar et al. (2004) Shankar, F., Salucci, P., Granato, G. L., De Zotti, G., Danese, L., 2004, MNRAS, 354, 1020
- Silverman et al. (2005) Silverman, J. D., Green, P. J., Barkhouse, W. A., et al., 2005, ApJ, 618, 123
- Stockton (1982) Stockton, A., 1982, ApJ, 257, 33
- Szokoly et al. (2004) Szokoly, G. P., Bergeron, J., Hasinger, G., et al., 2004, ApJS, 155, 271
- Ueda et al. (2003) Ueda, Y., Akiyama, M., Ohta, K., Miyaji, T., 2003, ApJ, 598, 886
- Vittorini et al. (2005) Vittorini, V., Shankar, F., Cavaliere, A., 2005, MNRAS, 363, 1376
- Wilkes et al. (2002) Wilkes, B. J., Schmidt, G. D., Cutri, R. M., et al., 2002, ApJ, 564, L65
- Wolf et al. (2003) Wolf, C., Wisotzki, L., Borch, A., et al., 2003, A&A, 408, 499
- Wolf et al. (2004) Wolf, C., Meisenheimer, K., Kleinheinrich, M., et al., 2004, A&A, 421, 913
- Zheng et al. (2004) Zheng, W., Mikles, V. J., Mainieri, V., et al., 2004, ApJS, 155, 73