Cumulative hard X-ray spectrum of local AGN: a link to the cosmic X-ray background
Abstract
Aims. We determine the cumulative spectral energy distribution (SED) of local active galactic nuclei (AGN) in the 3–300 keV band and compare it with the spectrum of the cosmic X-ray background (CXB) in order to test the widely accepted paradigm that the CXB is a superposition of AGN and to place constraints on AGN evolution.
Methods. We performed a stacking analysis of the hard X-ray spectra of AGN detected in two recent all-sky surveys, performed by the IBIS/ISGRI instrument aboard INTEGRAL and by the PCA instrument aboard RXTE, taking into account the space densities of AGN with different luminosities and absorption column densities.
Results. We derived the collective SED of local AGN in the 3–300 keV energy band. Those AGN with luminosities below erg s-1 (17–60 keV) provide the main contribution to the local volume hard X-ray emissivity, at least 5 times more than more luminous objects. The cumulative spectrum exhibits (although with marginal significance) a cutoff at energies above 100–200 keV and is consistent with the CXB spectrum if AGN evolve over cosmic time in such a way that the SED of their collective high-energy emission has a constant shape and the relative fraction of obscured AGN remains nearly constant, while the AGN luminosity density undergoes strong evolution between and , a scenario broadly consistent with results from recent deep X-ray surveys.
Conclusions. The first direct comparison between the collective hard X-ray SED of local AGN and the CXB spectrum demonstrates that the popular concept of the CXB being a superposition of AGN is generally correct. By repeating this test using improved AGN statistics from current and future hard X-ray surveys, it should be possible to tighten the constraints on the cosmic history of black hole growth.
Key Words.:
Surveys – Galaxies: active – Galaxies: evolution – Galaxies: Seyfert – X-rays: diffuse background1 Introduction
It is widely believed that the bulk of the cosmic X-ray background (CXB) consists of emission from all active galactic nuclei (AGN) in the visible Universe (Setti & Woltjer 1989). Therefore, the CXB represents a unique integral record of the history of growth of massive black holes since the early epochs until the present time. The popularity of this concept rests on the absence of significant distortions in the thermal spectrum of the cosmic microwave background, which rules out that a hot intergalactic medium is a major contributor to the CXB (Wright et al. 1994), and also on the fact that most of the background emission at energies below several keV has been directly resolved into individual AGN (see Brandt & Hasinger 2005 for a recent review).
However, the peak of the CXB spectral energy distribution (SED) is situated near 30 keV (e.g. Gruber et al. 1999), where % of the background emission remains unresolved (Krivonos et al. 2007). For this reason, currently popular CXB synthesis models (e.g. Gilli et al. 2007) compare versatile AGN statistics (source counts, luminosity functions at different redshifts, distribution of absorption column densities, etc.) collected by X-ray surveys at energies below keV with the CXB spectrum, under certain assumptions about AGN SEDs in the hard X-ray and soft gamma-ray bands (from 10 to several hundred keV). This allows one to test the overall paradigm of the CXB being a superposition of AGN and possibly to get an idea about still missing (e.g. heavily obscured) populations of AGN and other types of extragalactic objects.
Recent observations have provided a number of constraints for this picture. In particular, it has been established how the AGN luminosity function defined at rest-frame energies below 8 keV evolves with redshift, at least out to , and there are now constraints on the fraction of obscured AGN as a function of luminosity and redshift (e.g. Ueda et al. 2003; Barger et al. 2005; Tozzi et al. 2006). Most of these data were obtained in deep, pencil-beam extragalactic surveys conducted by the Chandra and XMM-Newton observatories.
Valuable complementary statistics have recently been provided by shallow hard X-ray surveys of the whole sky performed by RXTE (Revnivtsev et al. 2004; Sazonov & Revnivtsev 2004), Swift (Markwardt et al. 2005), INTEGRAL (Bassani et al. 2006; Beckmann et al. 2006; Krivonos et al. 2007; Sazonov et al. 2007) and HEAO-1 (Shinozaki 2006). Most importantly, these surveys have made it possible for the first time to reliably measure the distribution of AGN absorption column densities well into the Compton thick regime ( cm-2), albeit only at low redshifts (). In particular, it was found that the observed ratio of obscured ( cm-2) to unobscured ( cm-2) AGN drops from about 2:1 at hard X-ray (17–60 keV) luminosities erg s-1 to about 1:3 at higher luminosities (Sazonov et al. 2007; see also Sazonov & Revnivtsev 2004; Markwardt et al. 2005; Shinozaki 2006).
As was mentioned above, previous CXB studies used some fiducial intrinsic AGN SED going up to several hundred keV, which was usually assumed to be similar to the few measured spectra of brightest nearby Seyfert galaxies (e.g. Jourdain et al. 1992; Zdziarski et al. 1995). However, it has never been demonstrated that the cumulative hard X-ray SED of all AGN residing in a given volume of the Universe is compatible with the CXB spectrum. It is only now that such crucial comparison can be made for the first time, albeit only for the low-redshift AGN population, using the all-sky hard X-ray surveys mentioned above. The IBIS/ISGRI instrument (Ubertini et al. 2003) aboard INTEGRAL (Winkler et al. 2003) is particularly suitable for this purpose since it is effectively sensitive up to 300 keV, i.e. well into the energy range where the collective AGN SED is expected to have a cutoff if our understanding of the CXB origin is correct.
The purpose of the present work is to estimate the cumulative hard X-ray SED of local () AGN. For this purpose we stack the spectra of AGN detected in two recent all-sky surveys, performed by the IBIS/ISGRI instrument aboard INTEGRAL and by the PCA instrument aboard RXTE, taking into account the space densities of AGN with different luminosities (§2). By comparing the derived cumulative SED of local AGN, which spans two decades in energy (3–300 keV), with the CXB spectrum we obtain constraints on the evolution of AGN over cosmic time (§3). A cosmology with , , and km s-1 Mpc-1 is adopted throughout the paper. All quoted uncertainties are 1 unless noted otherwise.
2 Analysis
We recently used the (mostly) serendipitous all-sky survey conducted by the IBIS/ISGRI instrument (Krivonos et al. 2007) to obtain a sample of nearby AGN detected in the 17–60 keV energy band (Sazonov et al. 2007). This sample is well suited for estimating the cumulative hard X-ray SED of local AGN. In what follows we first describe our stacking spectral analysis performed on this AGN set (§2.1). We then report on our similar analysis carried out at lower energies (3–20 keV) using the RXTE Slew Survey (§2.2). Finally we put both sets of results together to obtain a composite AGN SED covering the energy range 3–300 keV (§2.3, §2.4).
2.1 INTEGRAL sample
The all-sky survey reported by Krivonos et al. (2007) is based on INTEGRAL/IBIS/ISGRI observations performed during 2002–2006, including a special series of observations of “empty” extragalactic fields. It greatly improves on previous hard X-ray surveys in terms of angular resolution () and sensitivity. For 80% of the sky a source detection limit of erg s-1 cm-2 (17–60 keV) or better is achieved. A total of 403 sources were found, with at most 1–2 of them being spurious.
Nearly two thirds of the sources in the Krivonos et al. (2007) catalog reside in the Galaxy, while the rest are confirmed or suspected AGN. We previously used the INTEGRAL catalog to construct the hard X-ray (17–60 keV) luminosity function of nearby AGN and to study their distribution in absorption column density (Sazonov et al. 2007). As in that work, we now use the subsample of AGN located outside the Galactic plane region () to avoid problems with identification incompleteness at low Galactic latitudes; our AGN sample is highly complete (%) at .
In fact the sample of AGN used in the present work is slightly different from that presented by Sazonov et al. (2007) but precisely corresponds to the catalog of Krivonos et al. (2007), which included a few additional INTEGRAL observations and follow-up identifications that had become available between those two publications. Specifically, our current sample is composed of 76, rather than 74 AGN detected on the IBIS/ISGRI average sky map at . Information on the two additional sources is presented in Table 1, which should be regarded as a continuation of Table 1 in Sazonov et al. (2007). Among these 76 AGN, there are 8 blazars and 68 nearby () Seyfert galaxies (although a few of them still lack an exact optical classification). Below we focus on these non-blazar AGN, although a short notice is made in §2.4 with respect to the blazar contribution to the cumulative AGN spectrum.
| Object | Classa | Ref.b | c | d | Ref.e | |||
|---|---|---|---|---|---|---|---|---|
| Mpc | 10-11 erg s-1 cm-2 | erg s-1 | 1022 cm-2 | |||||
| SWIFT J0601.98636=ESO 005-G004 | S2 | 1 | 0.0062 | 22.4 | 42.18 | 1 | ||
| IGR J145613738=ESO 386-G034 | S2 | 2 | 0.0246 | 43.23 | 2 |
a Optical AGN class: S2 – Seyfert 2 galaxy.
c Distance according to the Nearby Galaxies Catalogue (Tully 1988).
d Observed (uncorrected for absorption) luminosities in the 17–60 keV energy band.
2.1.1 Reconstruction of multiband sky images
To obtain the hard X-ray spectra of the INTEGRAL AGN we essentially repeated our analysis of IBIS/ISGRI data, previously performed in the 17–60 keV energy band (see Krivonos et al. 2007 for details), in 7 narrow channels: 17–26, 26–38, 38–57, 57–86, 86–129, 129–194 and 194–290 keV. This resulted in time-averaged maps of the whole sky in these energy bands, which were then used to measure source spectral fluxes. In this analysis, the source positions were fixed at the values determined by Krivonos et al. (2007) in the 17–60 keV band.
There are two important differences with respect to the Krivonos et al. (2007) study. First, for the present work we updated our data set by adding all IBIS/ISGRI data that became available to us since the last publication. This amounted to 26 Ms of cleaned and deadtime-corrected data in addition to 33 Ms available before. Secondly, in reconstructing clean sky images from raw IBIS/ISGRI shadowgrams in a given energy channel we used only those sources detectable in that band rather than the entire source catalog. This essentially eliminates iterative removal of sources from images, unnecessary in the high-energy channels (129–194 and 194–290 keV), where only 27 and 8 sources, respectively, are detected () on the whole sky, and reduces the error in measured fluxes.
It is important to emphasize that despite the addition of the most recent IBIS/ISGRI data we continued to base our analysis on the original AGN catalog (Sazonov et al. 2007 plus the two sources in Table 1) and the corresponding exposure map from Krivonos et al. (2007). Thus, the new data, added in an attempt to improve the quality of the source spectra, do not affect the statistical properties of our AGN sample.
When carrying out a stacking analysis like the one reported here one should always worry that some systematic uncertainties associated with the reconstruction of individual source fluxes may be greatly enhanced by adding up the fluxes of many sources. Therefore, to verify that our results do not suffer from systematic uncertainties related to image reconstruction we made a number of simulations.
In particular, we have extracted spectra from 3,000 “empty” positions on the sky chosen in accordance with the INTEGRAL exposure map, i.e. the number density of these “zero-flux” sources was made higher in regions of large exposure than in regions of small exposure. When we carried out simulations including in the iterative source removal procedure all the sources from the INTEGRAL catalog, irrespective of the significance of their detection in the considered energy channel, the mean of the distribution of the fluxes of the simulated sources proved to be –0.1 above zero (where is the typical uncertainty of source flux measurement), which is unacceptable for our stacking analysis. This result is actually anticipated for the employed algorithm of image reconstruction (Krivonos et al. 2007). However, when we repeated the simulations in exactly the same manner as we carried out our real stacking analysis, i.e. including into our iterative source removal procedure only those INTEGRAL sources that are significantly detected in the considered energy channel, the distribution of the fluxes of the simulated sources proved to be consistent with the normal one with zero mean and the dispersion expected from Poisson statistics.
This proves that a stacking analysis of as many as 3,000 sources does not suffer from any systematic uncertainties in our image reconstruction procedure.
2.1.2 Stacked spectra
The individual AGN spectra derived from the reconstructed IBIS/ISGRI multiband sky images will be discussed in detail elsewhere. Here we are only interested in the average properties of these spectra.
We first separately stacked AGN spectra within three groups defined by the source signal-to-noise ratio in the 17–60 keV energy band: (5 sources), between 15 and 30 (6 sources) and (57 sources). This is done mainly to prevent the stacked spectrum from being dominated by one or two bright sources. The resulting spectra are shown in Fig. 1. One can see that all three spectra are similar to each other. They exhibit some rollover between and keV and can be approximately described by a power law with a high-energy cutoff: , with and keV (see the solid lines in Fig. 1). This model provides an adequate approximation of the observed spectra, but given the limited energy coverage (17–290 keV), other functional forms (e.g. a broken power law) would fit the INTEGRAL data equally well.

The fact that the averaged spectra of local AGN presented in Fig. 1 have a maximum at energies –100 keV, which can be explained by the presence of a high-energy cutoff with keV, implies that if the same hard X-ray emission were coming from redshifts –2 its spectrum observed at would have a peak near keV, similar to the cosmic X-ray background. However, these stacked spectra cannot yet be regarded as characteristic of the collective hard X-ray emission of the local AGN population, since neither AGN space densities nor luminosities were taken into account when constructing them.
To really obtain the cumulative SED of local AGN, the following weighted stacking should be done:
| (1) |
Here is the cumulative volume emissivity (measured in units of erg s-1 Mpc-3) in energy channel (from 1 to 7), is the observed luminosity of ’th AGN in channel , is the measured flux from ’th AGN in channel , is the source luminosity distance and is the volume of space within which an AGN with observed luminosity in the 17–60 keV band could be detected in the INTEGRAL survey. We adopted the source distances () and signal-to-noise ratios (used to derive the maximum volumes given the INTEGRAL sky exposure map) from Sazonov et al. (2007), where the hard X-ray luminosity function of local AGN was derived in a similar way, and also from Table 1. The conversion of detector counts to photon fluxes in the 7 spectral bands was calibrated using IBIS/ISGRI measurements of the Crab and assuming that the Crab spectrum is given by phot keV-1 s-1 cm-2. In calculating the volumes we also assumed the observed spectra to be Crab-like. Although in general this may be a poor assumption for heavily obscured ( cm-2) AGN, it is unlikely to introduce a significant error in our case, because we use a relatively narrow energy band (17–60 keV) for source detection and since such strongly absorbed AGN provide a small contribution to the resulting cumulative SED.
There are two types of uncertainty associated with the summed spectrum . One results from the errors in the measured source spectral fluxes (and the associated uncertainties, , in the spectral luminosities) and is given by:
| (2) |
Another uncertainty is associated with the finite size of our AGN sample:
| (3) |
Therefore, these uncertainties are associated with the Poisson distribution of detector counts and the number of sources, respectively. Since the first uncertainty is directly linked to the survey’s sensitivity in different energy bands, its relative amplitude is much larger for the high-energy channels than for the low-energy ones. In contrast, the second uncertainty is nearly independent of the energy band () and affects the normalization of the cumulative SED rather than its shape.


In Figs. 2 and 3 we show two cumulative AGN SEDs obtained using equations (1)–(3). In the first case the stacking was done for the AGN (40 in total) with luminosities between and erg s-1 (17–60 keV). In the other case, erg s-1 and (27 AGN). This division approximately corresponds to the low-luminosity and high-luminosity branches of the luminosity function of nearby AGN, which are characterized by different ratios of obscured and unobscured sources (Sazonov et al. 2007) and so may represent somewhat different populations of AGN. Note that one source in our sample – the Seyfert galaxy NGC 4395 – has luminosity less than erg s-1 () and was not used in the stacking analysis.
2.2 RXTE/PCA sample
We have thus obtained the cumulative SEDs of local low-luminosity and high-luminosity AGN in the energy range 17–290 keV. There is an obvious need to continue these spectra to lower energies where intrinsic X-ray absorption in AGN should come into play, producing a low-energy cutoff in the spectra of obscured objects. There are two possible ways to obtain this low-energy part of the cumulative SED. One is to search the literature and data archives for X-ray spectra of the INTEGRAL AGN. We decided not to follow this approach for two reasons. First, published or archival X-ray observations of sufficient quality do not exist for all of our objects. Second, because AGN are inherently variable, adding lower-energy spectral fluxes to the IBIS/ISGRI hard X-ray spectra could introduce a bias due to the fact that these particular AGN tended to be detected by IBIS/ISGRI as they were bright relative to their typical flux levels (averaged over many years), while a different X-ray telescope will find the same source equally likely either below or above its average flux level (see Shinozaki 2006 for a detailed discussion of this effect). As a result, the low-energy part of the cumulative SED derived by this method would somewhat underestimate the true SED of the local AGN population.
Another feasible approach consists of using an independent survey of nearby AGN performed at the energies of our current interest, i.e. just below 20 keV. Such a survey of the whole sky in the energy band 3–20 keV was recently performed with the PCA instrument aboard the RXTE observatory during its slews between pointed observations – the RXTE Slew Survey, or XSS (Revnivtsev et al. 2004). In this survey a flux limit of erg s-1 cm-2 (3–20 keV) or better was achieved for 80% of the sky at . Therefore, the XSS is substantially more sensitive than the IBIS/ISGRI survey with respect to unobscured AGN (e.g. Seyfert 1 galaxies) but is less sensitive with respect to strongly obscured ( cm-2) ones.
| XSS object | Name | Classa | Ref.b | 3–8 keV | 8–20 keV | c | Refd | |||
|---|---|---|---|---|---|---|---|---|---|---|
| (J2000.0) | cnt s-1 | cnt s-1 | erg s-1 | 1022 cm-2 | ||||||
| 050542348 | 2MASX J050545752351139 | S2 | 1 | 0.0350 | 43.77 | 43.83 | 6 | 1 | ||
| 123034232 | IRAS F122954201 | S1.5 | 2 | 0.1000 | 44.37 | 44.37 | 1 | |||
| 123891614 | 2MASX J123906301610472 | S2 | 3 | 0.0367 | 43.75 | 43.77 | 2 | 2 | ||
| 150764257 | 2MASX J150804624244452 | S1 | 4 | 0.0565 | 43.96 | 43.96 | 3 | |||
| 182365616 | IC 4709 | S2 | 5 | 0.0169 | 42.86 | 42.98 | 12 | 1 | ||
| 19459+4508 | 2MASX J19471938+4449425 | S2 | 1 | 0.0532 | 43.84 | 43.95 | 11 | 2 | ||
| 213542720 | IRAS F213182739 | S1.5 | 1 | 0.0670 | 43.99 | 43.99 | 4 | |||
a Optical AGN class: S1.5 – Seyfert 1.5 galaxy, S2 – Seyfert 2 galaxy.
b Reference for the optical classification: (1) Bikmaev et al. (2006), (2) Landi et al. (2007), (3) Masetti et al. (2006a), (4) a Seyfert 1 nucleus is suggested by the 6dF spectrum, (5) Masetti et al. (2006b).
c Left and right columns give the observed and absorption corrected luminosities in the 3–20 keV band, respectively.
The high Galactic latitude () part of the XSS was previously used to obtain a catalog of AGN, to construct the 3–20 keV luminosity function of nearby AGN and to study their distribution of absorption column densities (Sazonov & Revnivtsev 2004), quite similarly to the analysis of the INTEGRAL survey we carried out later. Here we use the XSS to obtain low-energy intensities for our cumulative hard X-ray SEDs of local AGN.
Since the original XSS publications several changes have taken place that need to be taken into account here. First, originally a substantial fraction (%) of XSS sources were unidentified, mainly because of their poor localization (uncertainty up to ). Over the passed three years many of these sources have been identified, thanks to dedicated follow-up efforts (Bikmaev et al. 2006; Revnivtsev et al. 2006; Landi et al. 2007) or due to detection and improved localization of some of these sources by INTEGRAL and/or Swift. As a result, the XSS sample of AGN detected () at is now composed of 103, rather than 95 sources, including 84 non-blazar AGN. The new non-blazar AGN are listed in Table 2, which should be considered a continuation of Table 1 in Sazonov & Revnivtsev (2004). At the same time the number of unidentified XSS sources (detected at ) has decreased to 16 objects. Therefore, the XSS AGN sample is now at least 82% complete111Here it is also taken into account that additional AGN are possibly confused with other XSS sources., so incompleteness is significantly less of a problem than before.
Secondly, through careful testing of our methods developed for analyzing data recorded in the slew mode of RXTE observations we found that the conversion factors from PCA counts to source photons quoted in Revnivtsev et al. (2004) had been underestimated by a factor of , because we had not taken into account that the PCA field of view is rapidly moving across sources during RXTE slews and used a slow movement approximation of the PCA response. This implies that, to a first approximation, the AGN luminosities quoted in Sazonov & Revnivtsev (2004) should be revised upwards by a factor of 1/0.7 (the same correction factor applies to Table 2 presented here).
There are a few other minor modifications that have been implemented, including the correction of a misprint in Sazonov & Revnivtsev (2004) for the redshift of NGC 7582 from 0.053 to 0.0053 and accordingly revising its luminosity.
We plan to release an updated version of the XSS catalog in the near future, including the modifications described above and a number of additional source identifications.
It is important to note that although the RXTE and INTEGRAL AGN samples are comparable in size, they overlap by just %, i.e. these samples are mostly independent of each other. Although this result may seem unexpected, it can readily be explained by a combination of circumstances: 1) the XSS catalog is defined at , whereas the INTEGRAL AGN sample used here is defined at and the strip of the sky between and has been well covered by INTEGRAL observations, 2) the distribution of exposure over the sky is significantly different for the two surveys, 3) due to its lower energy band the XSS is biased toward detecting unobscured and weakly obscured AGN and against detecting Compton thick AGN, 4) AGN are inherently variable and the two surveys were conducted at significantly different epochs.
We used the updated XSS AGN sample to obtain the 3–8 and 8–20 keV data points for our cumulative hard X-ray SEDs of local low-luminosity and high-luminosity AGN (Figs. 2 and 3) following the same weighted summing method as we used above (§2.1) to obtain the high-energy parts of the SEDs based on IBIS/ISGRI data. We note that the XSS sample includes 6 non-blazar AGN located at –0.3. Nonetheless, since the vast majority of the sample are truly local sources () and the several more distant AGN contribute just a few per cent to the resulting cumulative SEDs, we included these objects in our stacking analysis as if they were local, i.e. ignoring any evolution of AGN between and .
There are three differences with respect to our analysis of the IBIS/ISGRI data, all caused by the strong effect of intrinsic absorption on AGN spectra below 20 keV. First, in determining the values for the XSS sources, we took into account their absorption column densities given in Table 1 in Sazonov & Revnivtsev (2004) and in Table 2 presented here. That is is now defined as the volume of space in which the XSS would detect an AGN with its observed 3–20 keV luminosity and column density (not just the luminosity as in the INTEGRAL case). Second, the values were taken into account also to calculate the observed and intrinsic (corrected for the absorption) luminosities of the XSS AGN in the subbands 3–8 and 8–20 keV from the detector counts measured in these channels (as given in Table 1 in Sazonov & Revnivtsev (2004) and in Table 2 presented here). In doing this conversion the source spectrum was assumed to have an intrinsic slope of 1.8, although the result only weakly depends on this assumption (Revnivtsev et al. 2004). And finally, we used the same two luminosity ranges: 1) , erg s-1 (38 AGN) and 2) , (46 AGN), as for our stacking analysis of INTEGRAL spectra, but for RXTE these ranges are defined for intrinsic (i.e. absorption-corrected) luminosities in the 3–20 keV energy band. This ensures that the stacking of both INTEGRAL and RXTE spectra is done for almost identical populations of AGN, since the unabsorbed luminosities of AGN in the 3–20 keV and 17–60 keV bands are very similar (see e.g. Fig. 7 in Sazonov et al. 2007).
2.2.1 Influence of the local large-scale structure
Both the INTEGRAL and RXTE all-sky surveys are characterized by substantially nonuniform coverage of the sky. Furthermore, the sky exposure maps of these surveys are quite different. Because both surveys effectively picked out AGN within 100–200 Mpc from us and the distribution of matter in the local Universe is inhomogeneous, effects of the local large-scale structure (LSS) may come into play when comparing AGN space densities or any quantities depending thereof (luminosity functions, cumulative SEDs etc.) estimated using one survey and the other. It is straightforward to estimate these effects if we assume that AGN are distributed in the local Universe approximately as normal galaxies. Krivonos et al. (2007) have actually demonstrated that the AGN detected by INTEGRAL do follow quite well the spatial distribution of galaxies.
To assess the effect of the local LSS on the cumulative SEDs of low- and high-luminosity AGN (Figs. 2 and 3), we made use of the IRAS PSCz catalog (Saunders et al. 2000), which is the most complete published all-sky galaxy redshift catalog. Our analysis essentially consisted of counting PSCz galaxies within the volume of space in which the INTEGRAL or RXTE survey can detect AGN with a given hard X-ray (3–20 or 17–60 keV) luminosity, and calculating the average galaxy number density in that volume of the Universe. To avoid problems with incompleteness of the PSCz catalog at low Galactic latitudes (Saunders et al. 2000), we excluded the sky below from the analysis, even though our INTEGRAL AGN sample extends down to . In reality, the situation is somewhat more complicated, first because the INTEGRAL and RXTE surveys are nonuniform, hence the distance out to which a source with a given luminosity is detectable depends on the direction in the sky, and also because the PSCz catalog itself becomes incomplete at a certain distance that depends on galaxy infrared luminosity. Nonetheless, it is not difficult to take these effects into account to first approximation.
Specifically, we first constructed 9 subsamples of IRAS PSCz galaxies according to their infrared (60 m) luminosity: , , , , , , , , . These subsamples are expected to be complete out to , 32, 45, 72, 102, 144, 228, 322, 455 Mpc, since the PSCz catalog is highly complete at 60 m fluxes higher than 0.6 Jy (Saunders et al. 2000), except near the Galactic plane (we ignore here any -corrections since we are dealing with low redshifts). We then calculated the average number density of IRAS PSCz galaxies with (…9) within the volumes of space probed by INTEGRAL or RXTE at different hard X-ray luminosities (17–60 or 3–20 keV, respectively): , 41.5, 42, 42.5, 43, 43.5, 44. For simplicity, in calculating we assumed power-law spectra with a photon index of 1.8. Of all the resulting galaxy density estimates we finally took into account only those satisfying the condition , where is the distance within which 90% of the space volume probed by INTEGRAL or RXTE at is contained.
We have thus used a combination of dwarf, normal and giant IRAS galaxies to compare the average galaxy number densities characteristic of the INTEGRAL and RXTE surveys in the broad range of AGN luminosities of our interest. The result of this comparison is shown in Fig. 4. It indicates that the local volume of Universe probed by INTEGRAL at erg s-1 is a factor of denser than the corresponding volume probed by RXTE. A comparison of the sky exposure maps of INTEGRAL (Krivonos et al. 2007) and RXTE (Revnivtsev et al. 2004) provides a likely explanation for this: while INTEGRAL has spent a lot of time observing such major galaxy concentrations as the Centaurus cluster–Shapley supercluster and the Perseus–Pisces supercluster, the RXTE Slew Survey has relatively low exposure in these regions. On the other hand, we do not find (see Fig. 4) any significant difference in the average galaxy number densities of the INTEGRAL and RXTE survey volumes at higher AGN luminosities (). This is also an expected result, since high-luminosity AGN are typically observed by INTEGRAL and RXTE at distances –200 Mpc and on such spatial scales the Universe is believed to be approximately homogeneous. We note however that the limited statistics of distant giant galaxies in the IRAS PSCz catalog does not allow us to estimate the galaxy number density for the INTEGRAL and RXTE surveys at high to an accuracy better than %.
To take into account to a first approximation the apparent effect of the local LSS and assuming that the INTEGRAL and RXTE surveys equally over- and underestimate, respectively, the average density in the local Universe, we multiplied the RXTE points of the cumulative SED of low-luminosity AGN (Fig. 2) by a factor of 1.1 and divided the INTEGRAL points by the same factor. No such corrections were done for the cumulative SED of high-luminosity AGN (Fig. 3).

2.3 Spectral modeling
We next modeled, using XSPEC (Arnaud 1996), the broad-band (3–300 keV) cumulative SEDs of local low- and high-luminosity AGN obtained in the previous sections by a sum of absorbed and unabsorbed power-law spectra with a high-energy exponential cutoff:
| (4) |
This model is by definition a sum of identical spectra absorbed by different column densities of neutral gas: 0, , , , , , cm-2. We fix the weights () of these columns at the relative fractions of AGN with different as measured by INTEGRAL (Sazonov et al. 2007), ignoring the associated uncertainties. The corresponding fractions at low ( erg s-1) and high ( erg s-1) luminosities are given in Table 3. We use them accordingly for modeling the cumulative SEDs of low- and high-luminosity AGN (Fig. 2 and Fig. 3).
| () | () | |
|---|---|---|
| 0.300 | 0.68 | |
| 22.0–22.5 | 0.175 | 0.08 |
| 22.5–23.0 | 0.075 | 0.04 |
| 23.0–23.5 | 0.125 | 0.08 |
| 23.5–24.0 | 0.150 | 0.12 |
| 24.0–24.5 | 0.100 | 0.00 |
| 0.075 | 0.00 |
The photoabsorption modifiers are determined using the XSPEC model phabs assuming solar element abundances. Note that for substantially Compton thick sources ( cm-2) this simple photoabsorption model becomes inadequate, but since the relative fraction of such sources according to the INTEGRAL survey is small (%) we apply this model to all AGN. Also, it would be more appropriate to use in equation (4) the true, i.e. corrected for selection effects, fractions of AGN with different absorption column densities rather than the fractions as observed by INTEGRAL in the 17–60 keV energy band (Table 3). However, for the adopted photoabsorption model the observed fraction will significantly (by %) underestimate the intrinsic fraction only at cm-2 and since the contribution of such heavily obscured AGN to the total SED is expected to be small (10%) compared to the various uncertainties associated with our analysis and also because the photoabsorption model itself becomes inadequate in the Compton thick regime, we do not try to correct our spectral fitting procedure for selection effects.
The free parameters of our model are the power-law slope , the position of the high-energy cutoff and the normalization , which is allowed to take different values for the RXTE and INTEGRAL parts of the spectrum to prevent some systematic effects, e.g. associated with the cross-calibration of the IBIS/ISGRI and PCA detectors or with the local LSS (see §2.2.1), from affecting the modeling of the spectral shape. At the same time this allows us not to take into account the uncertainties associated with the finite sizes of the INTEGRAL and RXTE AGN samples [equation (3)] when fitting the spectrum, since these uncertainties are strongly correlated between the different energy channels for a given survey and do not affect the spectral shape. We do however consider these errors when we discuss the final spectral normalization below.
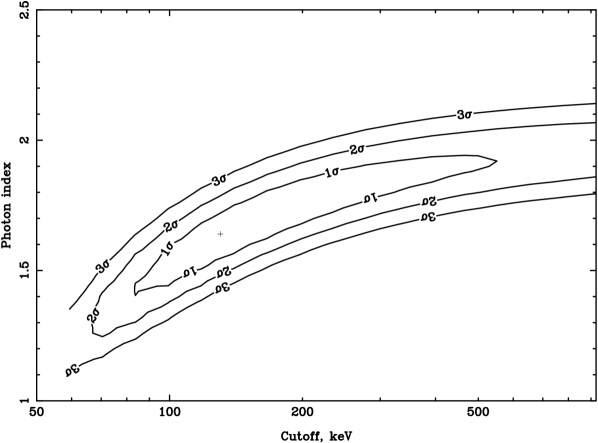
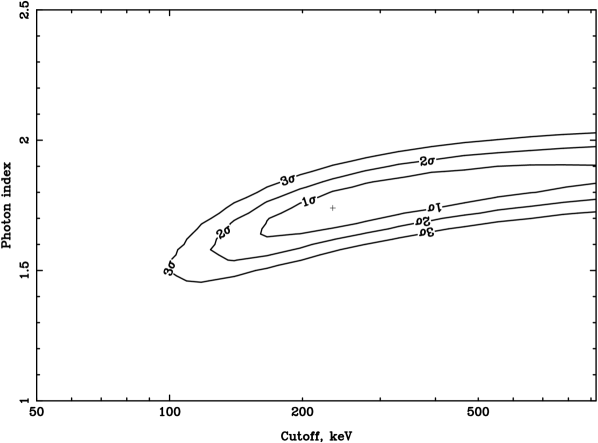
The above model provides an excellent fit both to the cumulative SED of low-luminosity AGN and to that of high-luminosity ones. The best-fit parameter values are given in Table 4 and the associated confidence regions for the two main parameters and are shown in Figs. 5 and 6. The best-fit models are shown in Figs. 2 and 3, as well as the contributions of unobscured (), obscured () and heavily obscured () AGN to the total SEDs.
In summary, the best-fit power-law photon index is found to be , as expected of AGN (see e.g. Reynolds et al. 1997; Turner et al. 1997). In both studied cases, the model prefers to have a high-energy cutoff with –300 keV, while its detection is only marginal () in both cases. Previously, similar values of the cutoff energy have been inferred from individual spectra of several brightest Seyfert galaxies (in particular NGC 4151, Jourdain et al. 1992) selected without regard to their luminosities or space densities, as well as upon averaging over such spectra (e.g. Zdziarski et al. 1995; Perola et al. 2002; Molina et al. 2006).
| (INTEGRAL) | (RXTE) | d.o.f. | |||
|---|---|---|---|---|---|
| erg s-1 | keV | erg s-1Mpc-3 | |||
| – | 3.7/5 | ||||
| 3.1/5 | |||||
We note the excellent agreement of the derived normalizations of the low-energy (RXTE) and high-energy (INTEGRAL) parts of the cumulative SED of low-luminosity AGN, i.e. the whole 3–300 keV spectrum can be well fit by a model using a single normalization. Also, the % difference in the normalizations of the RXTE and INTEGRAL parts of the cumulative SED of high-luminosity AGN is not statistically significant given the uncertainties associated with the photon counting statistics and the finite size of the AGN samples (see the first and second sets of uncertainties for the values in Table 4). The total 1 uncertainties are shown as shaded regions in Figs. 2 and 3 and one can see that the INTEGRAL and RXTE data are in good agreement with each other. Furthermore, part of the apparent mismatch between the RXTE and INTEGRAL parts of the cumulative SED of high-luminosity AGN may be caused by possible small inhomogeneities in the distribution of matter on the 100–200 Mpc scales (see §2.2.1).
Apart from the relatively simple model given by equation (4), we also fit the measured SEDs by more complicated models. In particular we tried adding a Compton reflection component. Since this did not lead to a significant improvement of the quality of the fit nor did it provide interesting constraints on the amplitude of the reflection component (due to its strong correlation with the power-law slope and the position of the high-energy cutoff), we base all of the remaining discussion on our model of a sum of absorbed and unabsorbed power-law spectra with a high-energy cutoff.
2.4 Cumulative SED of the local AGN population
We have seen that the shapes of the summed SEDs of low- and high-luminosity AGN are similar to each other except that the spectrum is harder below 20 keV in the former case due to the larger fraction of obscured sources at low luminosities ( erg s-1). We can now finally determine the SED of the hard X-ray volume emissivity of all local AGN with luminosities over erg s-1.
To this end, we first slightly rescale the best-fit spectral models presented above. Specifically, we define the amplitudes of the low- and high-luminosity spectral components to be the averages of the corresponding INTEGRAL and RXTE values given in Table 4, so that
| (5) |
and
| (6) |
In Fig. 7 we show by the solid line the sum of our low- and high-luminosity best-fit models with the normalizations given by equations (5) and (6). This is our best estimate of the cumulative SED of local AGN. The shaded region represents the multifold of spectral models that are consistent with the INTEGRAL and RXTE data to within 1 and includes an additional uncertainty (% around the average value) in the spectral normalization, which is our estimate of a combination of several uncertainties, which were already discussed in different sections of the paper, namely associated with 1) the finite size of the INTEGRAL and RXTE samples of AGN, 2) the local LSS (although we have taken it into account to a first approximation) and 3) possible incompleteness of both AGN samples. The dashed and dotted lines show the contributions of the low-luminosity ( erg s-1) and high-luminosity ( erg s-1) AGN, respectively. We note that the latter contribute just % to the collective SED of local AGN.
We finally note that blazars are not expected to contribute more than several per cent to the local hard X-ray emissivity at different energies below keV (see Fig. 7). We made this estimate using the same method that we used to derive the cumulative SED of non-blazar AGN. Although in making this estimate we did not exclude high-redshift flat-spectrum radio quasars present in the INTEGRAL and RXTE catalogs, it is essentially based on the 2 and 9 nearby () BL Lacs detected by INTEGRAL and RXTE, respectively. We also note that the contribution of blazars may well be much more significant in gamma-rays ( keV), since emission from blazars can extend to very high energies, in contrast to normal Seyfert galaxies and quasars.

3 Comparison with the cosmic X-ray background
In the previous section we derived the cumulative hard X-ray SED of local AGN. Specifically, we determined its normalization, i.e. the volume hard X-ray emissivity of AGN, and shape, which was shown to be well described as a sum of absorbed and unabsorbed power-law spectra with a high-energy cutoff. It is interesting to put these results into the broader perspective of the cosmic history of growth of massive black holes and the origin of the cosmic X-ray background.
To this end, suppose that the shape of the cumulative AGN SED does not evolve with redshift, which implies a constant relative contribution of obscured sources, while its normalization, i.e. the luminosity density of AGN, does experience evolution. The collective emission of AGN from all redshifts observed at will then have the spectrum (for a flat cosmoslogy, see e.g. Sazonov et al. 2004)
| (7) |
where is the cumulative SED of local AGN (Fig. 7) and the function describes the evolution of the AGN luminosity density.
Following Sazonov et al. (2007), we assume that the hard X-ray luminosity density of AGN evolves similarly to the luminosity density of AGN with erg s-1 in the rest-frame 2–8 keV energy band as reported by Barger et al. (2005), specifically that is bound between two limiting functions:
| (10) |
and
| (13) |
This formulation reflects the significant uncertainty in our knowledge of the AGN evolution at , whereas the rapid, approximately power-law evolution between and is established relatively well (Ueda et al. 2003; Barger et al. 2005; La Franca et al. 2005).


We now use equation (7) to convolve our locally determined composite AGN SED (Fig. 7) with the two limiting evolution functions and (up to ). The resulting SEDs, representing the collective emission of AGN from all redshifts, are shown in Fig. 8 and Fig. 9, respectively. The shaded uncertainty regions in these figures have been derived by propagating the uncertainties associated with the local AGN SED shown in Fig. 7, including the uncertainty in the spectral shape and the estimated 20% uncertainty in the volume emissivity of local AGN.
We see that within the fairly large uncertainties the shape of the predicted redshift-integrated AGN SED is in good agreement with that of the CXB for both limiting scenarios of AGN evolution at and thus for the true evolution constrained between and . As concerns the normalization, depending on the character of evolution at our model is between being consistent with the observed CXB intensity (in the case of ) and underestimating it by some 30% (in the case of ). We also note that by adopting the functional form at we essentially fixed the ratio of the AGN luminosities densities at and at 9.2. In reality, this ratio is known with accuracy % Ueda et al. 2003; Barger et al. 2005; La Franca et al. 2005 and this uncertainty of course translates into a similar uncertainty in our predicted spectrum. The calculated SEDs are compared in Fig. 8 and 9 with the CXB spectrum measured by INTEGRAL (Churazov et al. 2007).
We note that if the simple scenario of evolution considered here is correct, we may expect the calculated SED to somewhat understimate the CXB intensity. Indeed, the calculation above rested on our estimate of the local AGN emissivity, which was based on non-blazar AGN with luminosities higher than erg s-1. An additional significant contribution to the local emissivity is expected to come from AGN with still lower luminosities ( erg s-1) (Elvis et al. 1984) and from blazars (see §2.4 above). In fact, we recently used RXTE observations to study the correlation of large-scale variations of the CXB intensity with the spatial distribution of galaxies in the local Universe, which allowed us to estimate the combined emissivity of all X-ray sources (AGN, star-forming and normal galaxies, and clusters of galaxies etc) in the local Universe at erg s-1 Mpc-1 in the 2–10 keV energy band (Revnivtsev et al. 2008). On the other hand, by integrating the luminosity function of nearby AGN measured by RXTE (Sazonov & Revnivtsev 2004) and applying the corrections described in §2.2, we find that the combined emissivity of AGN with erg s-1 is erg s-1 Mpc-1. Therefore, low-luminosity ( erg s -1) X-ray sources may indeed contribute % or even more to the total local X-ray emissivity (at least in the 2–10 keV energy band and probably somewhat less at higher energies taking into account that clusters of galaxies and normal galaxies produce softer X-ray emission than AGN).
We also point out that our calculation was based on the assumption that the evolution of the total luminosity density of AGN follows the observed evolution of the 2–8 keV luminosity density of AGN with erg s-1 (Barger et al. 2005). The inclusion of lower-luminosity ( erg s-1) AGN, which are not yet accessible to observation at and whose abundance is thus poorly known, could also modify the result of our calculation.
We finally note the well-known fact that if the luminosity density of AGN were the same at high redshifts as it is at , only % of the CXB could be explained.
4 Discussion and conclusions
In this paper we used the INTEGRAL and RXTE all-sky hard X-ray surveys to calculate the spectral energy distribution of the collective emission of local AGN in the broad range 3–300 keV, properly taking into account the relative contributions of AGN with different luminosities and absorption column densities.
We first performed stacking spectral analyses separately for AGN with low ( erg s-1) and high ( erg s-1) luminosities and found that both stacked SEDs are consistent with having the same shape at energies above 20 keV – in particular, a high-energy cutoff is marginally detected above 100–200 keV, whereas the cumulative SED of low-luminosity AGN is harder at energies below 20 keV due to the larger fraction of obscured AGN compared to higher luminosities. We then summed up our best-fit models for the stacked spectra of low- and high-luminosity AGN to obtain the collective SED of all local non-blazar AGN with erg s-1 and estimated the associated statistical and systematic uncertainties.
As a first attempt to apply the derived cumulative SED of local AGN to studying the history of black hole growth in the Universe, we demonstrated that this SED is consistent with the cosmic X-ray background spectrum if both the spectral shape of the collective hard X-ray emission of AGN and the relative fraction of obscured AGN remain constant with redshift while the total AGN luminosity density undergoes strong evolution between and .
This simple model underpredicts the observed CXB intensity by –30% depending on the loosely constrained evolution of AGN at (and to a lesser degree on the evolution at ). As we discussed in §3, the missing CXB flux can also possibly be attributed to blazars and to low-luminosity AGN ( erg s-1 at and erg s-1 at –2), not included in our model, since such objects are known to be abundant and energetically important at least in the local Universe. In this connection we note that there may be an increased fraction of Compton thick ( cm-2) objects among such low-luminosity AGN compared to the % fraction at erg s-1 observed by INTEGRAL. Indeed, some studies suggest that the intrinsic fraction of Compton thick AGN in the local Universe may be as high as % (e.g. Risaliti et al. 1999; Guainazzi et al. 2005) and in the most obscured of these objects even the hard X-ray flux will be strongly depressed.
Turning the above argument around, we can conclude that AGN with erg s-1, which are undetectable even in the deepest extragalactic surveys with Chandra and XMM-Newton, cannot provide a dominant contribution to the X-ray emissivity of the Universe at redshifts –2, otherwise they would produce too much X-ray background.
How does this assumed scenario of AGN evolution compare with observational data obtained by X-ray surveys at energies below keV? First of all, a number of studies have shown that AGN undergo approximately pure luminosity evolution between and (Ueda et al. 2003; Barger et al. 2005), which means that the AGN luminosity function has shifted to lower luminosities by nearly an order of magnitude. More fundamentally, it has been demonstrated that black hole growth and galaxy formation move steadily and in parallel to lower mass scales since up to (e.g. Heckman et al. 2004).
This picture of “cosmic downsizing” or “ antihierarchical evolution” is consistent with the scenario considered in this paper and in fact in our calculations we adopted the functional form of the AGN luminosity density evolution between and from the recent X-ray surveys. As concerns the relative contribution of obscured AGN to the cumulative hard X-ray emissivity at a given redshift, which is constant in our model, observations seem to indicate that there is indeed no significant evolution of this fraction between and (Ueda et al. 2003). Therefore, all the available AGN observations at appear to well fit in the simple scenario of evolution considered in this paper.
However, X-ray observations also suggest that the character of AGN evolution changes at higher redshifts (). Namely, the observed AGN evolution is much better described by a luminosity dependent density evolution model than by a pure luminosity evolution one (Ueda et al. 2003; La Franca et al. 2005; Gilli et al. 2007). Also the relative contribution of obscured sources to the total AGN luminosity density may have undergone substantial evolution at , although this remains a very controversial issue (La Franca et al. 2005; Akylas et al. 2006; Tozzi et al. 2006; Treister & Urry 2006). Although the different character of AGN evolution at high redshifts with respect to suggests that our simple model needs to be modified, such a revision would remain almost unnoticed in view of the fairly large uncertainties in the cumulative SED of local AGN. Indeed, as has been shown in §3, the current uncertainty in the AGN evolution at leads to less than % uncertainty in the predicted CXB spectrum, which is of the same order as the uncertainties in the cumulative SED of local AGN obtained from INTEGRAL and RXTE data.
We also note that in reality the hard X-ray spectra of distant quasars may somewhat differ from those of the nearby Seyfert galaxies that make up our local cumulative SED, since, although AGN spectra are not expected to directly depend on cosmological redshift, they can depend on physical parameters of the accretion disk around the central massive black hole, determined by the black hole mass, accretion rate (Shakura & Sunyaev 1976) and spin. Observations with future hard X-ray telescopes will permit direct tests of whether the high-energy spectra of quasars are similar to those of local AGN or not.
The main result of this work is that for the first time a direct comparison has been made between the cumulative hard X-ray SED of the local AGN population and the CXB spectrum, which demonstrated that the commonly accepted paradigm of the CXB being a superposition of AGN is generally correct. Improved measurements of the cumulative SED and evolution of AGN by current and future X-ray and hard X-ray astronomy missions will make it possible to obtain tighter constraints on the cosmic history of black hole growth and the AGN unification paradigm.
Acknowledgments This work was partially supported by the DFG-Schwerpunktprogramme (SPP 1177). We thank the referee for helpful remarks on the paper. INTEGRAL is an ESA project funded by ESA member states (especially the PI countries: Denmark, France, Germany, Italy, Spain, Switzerland), Czech Republic and Poland, and with the participation of Russia and the USA.
References
- Akylas et al. (2006) Akylas, A., Georgantopoulos1, I., Georgakakis, A., Kitsionas, S., & Hatziminaoglou, E., 2006, A&A, 459, 693
- Arnaud (1996) Arnaud, K.A., 1996, Astronomical Data Analysis Software and Systems V, eds. Jacoby, G. & Barnes, J., ASP Conf. Series, 101, 17
- Barger et al. (2005) Barger, A.J., Cowie, L.L., Mushotzky, R.F., et al., 2005, AJ, 129, 578
- Bassani et al. (2006) Bassani, L., Molina, M., Malizia, A., et al., 2006, ApJ, 636, L65
- Beckmann et al. (2006) Beckmann, V., Soldi, S., Shrader, C.R., Gehrels, N., & Produit, N., 2006, ApJ, 652, 126
- Bikmaev et al. (2006) Bikmaev, I.F., Sunyaev, R.A., Revnivtsev, M.G., & Burenin, R.A., 2006, Astr. Lett., 32, 221
- Brandt & Hasinger (2005) Brandt, W.N., & Hasinger, G., 2005, ARA&A, 43, 827
- Churazov et al. (2007) Churazov, E., Sunyaev, R., Revnivtsev, M., Sazonov, S., Molkov, S., Grebenev, S., et al., 2007, A&A, 467, 529
- Elvis et al. (1984) Elvis, M., Soltan, A., & Keel, W.C., 1984, ApJ, 283, 479
- Gilli et al. (2007) Gilli, R., Comastri, A., Hasinger, 2007, A&A, 463, 79
- Gruber et al. (1999) Gruber, D.E., Matteson, J.L., Peterson, L.E., & Jung, G.V., 1999, ApJ, 520, 124
- Guainazzi et al. (2005) Guainazzi, M., Matt, G., Perola, G.C., 2005, A&A, 444, 119
- Heckman et al. (2004) Hecman, T., Kauffmann, G., Brinchmann, J., Charlot, S., Tremonti, C., & White, S. 2004, ApJ, 613, 109
- Jourdain et al. (1992) Jourdain, E., Bassani, L., Buchet, L., et al., 1992, A&A, 256, L38
- Krivonos et al. (2007) Krivonos, R., Revnivtsev, M., Lutovinov, A., Sazonov, S., Churazov, E., & Sunyaev, R., 2007, A&A, 475, 775
- La Franca et al. (2005) La Franca, F., Fiore, F., Comastri, A., et al., 2005, 635, 864
- Landi et al. (2007) Landi, R., Masetti, N., Morelli, L., et al., 2007, ApJ, 669, 109
- Markwardt et al. (2005) Markwardt, C.B., Tueller, J., Skinner, G.K., Gehrels, N., Barthelmy, S.D., & Mushotzky, R.F., 2005, ApJ, 633, L77
- Masetti et al. (2006a) Masetti, N., Mason, E., Bassani, L., et al., 2006, A&A, 448, 547
- Masetti et al. (2006b) Masetti, N., Morelli, L., Palazzi, E., et al., 2006, A&A, 459, 21
- Masetti et al. (2007) Masetti, N., Morelli, L., Cellone, S.A., et al., 2007, ATel 1033
- Morelli et al. (2006) Morelli, L., Masetti, N., Bassani, L., et al., 2006, ATel 785
- Molina et al. (2006) Molina, M., Malizia, A., Bassani, L., et al., 2006, MNRAS, 371, 821
- Perola et al. (2002) Perola, G.C., Matt, G., Cappi, M., Fiore, F., Guainazzi, M., Maraschi, L., et al., 2002, A&A, 389, 802
- Revnivtsev et al. (2004) Revnivtsev, M., Sazonov, S., Jahoda, K., & Gilfanov, M., 2004, A&A, 418, 927
- Revnivtsev et al. (2006) Revnivtsev, M., Sazonov, S., Churazov, E., & Trudolyubov, S., 2006, A&A, 448, L49
- Revnivtsev et al. (2008) Revnivtsev, M., Molkov, S., & Sazonov, S., 2008, A&A submitted; arXiv:0709.2658
- Reynolds et al. (1997) Reynolds, C.S., 1997, MNRAS, 286, 513
- Risaliti et al. (1999) Risaliti, G., Maiolino, R., & Salvati, M., 1999, ApJ, 522, 157
- Sazonov et al. (2004) Sazonov, S., Ostriker, J.P., & Sunyaev, R., 2004, MNRAS, 347, 144
- Sazonov & Revnivtsev (2004) Sazonov, S., & Revnivtsev, M., 2004, A&A, 423, 469
- Sazonov et al. (2005) Sazonov, S., Churazov, E., Revnivtsev, M., Vikhlinin, A., & Sunyaev, R., 2005, A&A, 444, L37
- Sazonov et al. (2007) Sazonov, S., Revnivtsev, M., Krivonos, R., Churazov, E., & Sunyaev, 2007, A&A, 462, 57
- Sazonov et al. (2008) Sazonov, S., Revnivtsev, M., Burenin, R., et al., 2008, submitted to A&A; arXiv:0802.0928
- Saunders et al. (2000) Saunders, W., Sutherland, W.J., Maddox, S.J., et al., 2000, MNRAS, 317, 55
- Setti & Woltjer (1989) Setti G., & Woltjer L., 1989, A&A, 224, L21
- Shakura & Sunyaev (1976) Shakura, N.I., & Sunyaev, R.A., 1976, MNRAS, 175, 613
- Shinozaki (2006) Shinozaki, K., Miyaji, T., Ishisaki, Y., Ueda, Y., & Ogasaka, Y., 2006, ApJ, 131, 2943
- Tozzi et al. (2006) Tozzi, P., Gilli, R., Mainieri, V., et al., 2006, A&A, 451, 457
- Treister & Urry (2006) Treister, E., & Urry, M., 2006, ApJ, 652, L79
- Tully (1988) Tully, R.B. 1988, Nearby Galaxies Catalogue, Cambridge University Press
- Turner et al. (1997) Turner, T.J., George, I.M., Nandra, K., & Mushotzky, R.F., 1997, ApJS, 113, 23
- Ubertini et al. (2003) Ubertini, P., Lebrun, F., Di Cocco, G., et al., 2003, A&A, 411, L131
- Ueda et al. (2003) Ueda, Y., Akayama, M., Ohta, K., & Miyaji, T., 2003, ApJ, 598, 886
- Ueda et al. (2007) Ueda, Y., Eguchi, S., Terashima, Y., et al., 2007, ApJ, 664, L79
- Winkler et al. (2003) Winkler, C., Courvoisier, T.J.-L., Di Cocco, G., et al., 2003, A&A, 411, L1
- Wright et al. (1994) Wright, E.L., Mather, J.C., Fixsen, D.J., et al., 1994, ApJ, 420, 450
- Zdziarski et al. (1995) Zdziarski, E.L., 1995, ApJ, 438, L63