SPECTROPOLARIMETRY OF R CORONAE BOREALIS IN 1998–2003: DISCOVERY OF TRANSIENT POLARIZATION AT MAXIMUM BRIGHTNESS
Abstract
We present an extended optical spectropolarimetry of R CrB from 1998 January to 2003 September. The polarization was almost constant in the phase of maximum brightness, being consistent with past observations. We detected, however, temporal changes of polarization ( %) in 2001 March and August, which were the first detection of large polarization variability in R CrB near maximum brightness. The amplitude and the position angle of the ‘transient polarization’ were almost constant with wavelength in both two events. There was a difference by about 20 degrees in the position angle between the two events. Each event could be explained by light scattering due to short-lived dust puff occasionally ejected off the line of sight. The flatness of the polarization against the wavelength suggests that the scatterer is a mixture of dust grains having various sizes. The rapid growth and fading of the transient polarization favors the phenomenological model of dust formation near the stellar photosphere (e.g., within two stellar radii) proposed for the time evolution of brightness and chromospheric emission lines during deeply declining periods, although the fading timescale can hardly be explained by a simple dispersal of expanding dust puff with a velocity of km s -1. Higher expansion velocity or some mechanism to destroy the dust grains should be needed.
1 INTRODUCTION
R Coronae Borealis (RCB) stars are hydrogen-deficient, carbon-rich variables that undergo declines in visual brightness up to 7 mag or more at irregular intervals. The evolutionary pathways of these stars are still unclear, with the white dwarf merger model and the final helium-shell flash model being suggested for the extreme abundances (e.g., Iben, Tutukov, & Yungelson 1996; Saio & Jeffery 2002; Clayton et al. 2007). The darkening phenomenon has been attributed to eclipse by clouds of dust grains (dust puff) formed along the line of sight (Loreta, 1934; O’Keefe, 1939). Near-infrared excess, attributable to the dust emission at an equivalent blackbody temperature of K, was found for the prototype of this group, R CrB (Stein et al., 1969), and this excess is a general property of RCB stars (Feast & Glass, 1973). The infrared radiation shows variations on timescales of yr (Feast et al., 1997) and does not clearly correlate with the optical brightness (Forrest, Gillett, & Stein, 1972; Feast et al., 1997; Yudin et al., 2002). These indicate that a large amount of dust being produced surrounds the star and that a smaller dust puff is formed in a random direction per any one ejection event (e.g., Ohnaka et al. 2001, 2003). Recent near-infrared adaptive optics observations with an 8-m class telescope directly revealed the presence of multiple dusty clouds in the vicinity of RY Sgr (de Laverny & Mékarnia, 2004).
The dust formation mechanism itself is, however, still one of the fundamental problems in RCB stars (e.g., Clayton 1996; Feast 1997, 2000). Fadeyev (1986) derived from a theoretical argument a conclusion that the dust formation has to occur somewhere apart from the central star where the local temperature becomes low enough to allow for carbon grains to condense. On the other hand, observational facts such as the time evolution of chromospheric emission lines and timescales of brightness recovering from declines are favorable to other models in which dust forms in close proximity () to the central star (Clayton et al., 1992; Whitney, 1993). To settle this discrepancy, some mechanism to promote dust formation near RCB stars have been proposed. Woitke, Goeres, & Sedlmayr (1996) suggested that the local gas temperature can be substantially decreased by supercooling after the passage of a shock wave driven by stellar pulsation. Asplund & Gustafsson (1996) proposed an episodic local density inversions in the ionization layer of helium due to a kind of radiative instability which can promote a blob ejection. Feast (1997) discussed the dust formation above the cool regions of giant convection cells. Soker & Clayton (1999) suggest that cool magnetic spots existing inside of photosphere facilitate dust formation above the spots after a shock wave passes.
Polarimetry is a probe sensitive to circumstellar medium near the stellar surface, and even to dust formation episodes around RCB stars on very small spatial scales. If dust forms actually near the photosphere (), the angular size of the dust puff should be more than for total eclipse of the stellar disk. Such a wide dust puff is likely to scatter the light from the star and may cause a net polarization more than – %, when it locates along the direction nearly orthogonal to the line of sight (Code & Whitney, 1995). Therefore, it is natural to expect that RCB stars temporally show a significant polarization at maximum brightness stage. The wavelength dependence of the polarization would give unique information about the “newborn” dust grain. So far only small fluctuation of intrinsic polarization less than 0.2 % has been found for RCBs near maximum brightness (Serkowski & Kruszewski, 1969; Coyne & Shawl, 1973; Coyne, 1974; Efimov, 1980, 1990; Stanford et al., 1988; Rosenbush & Rosenbush, 1990; Whitney et al., 1992; Trammell, Dinerstein, & Goodrich, 1994; Clayton et al., 1995, 1997; Yudin et al., 2003; Bieging et al., 2006), except for Efimov (1980)’s observation on 1974 August 24 ( %).
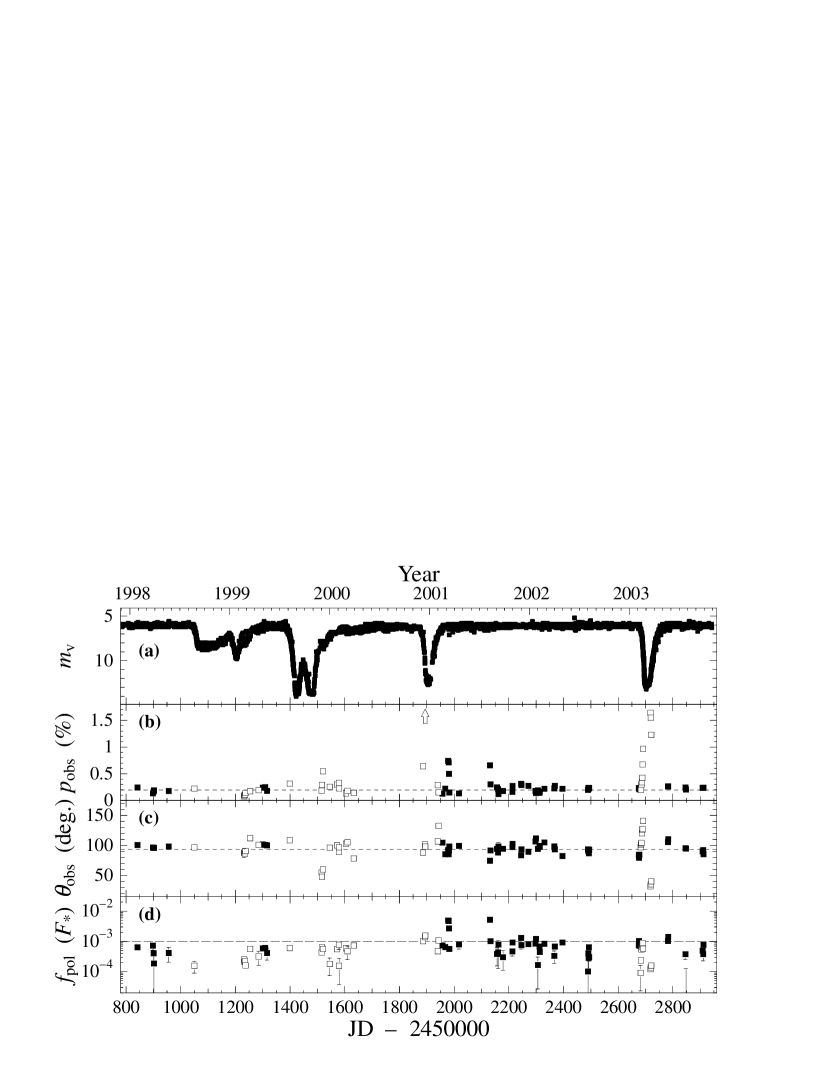
In this paper, we present a new spectropolarimetry of R CrB on 84 nights in 1998–2003. We successfully found two events of temporal increase in polarization by about 0.5 % at maximum brightness stage. We consider the period when the visual magnitude is within 0.3 mag below the maximum magnitude () as “maximum brightness” phase and call the other period “decline” phase. We adopt which is the mean magnitude during the apparent visual maximum of R CrB, JD2,450,800–51,000 and 52,000–52,650 (Figure 1a). The photometric data referred in this paper are obtained from the VSNET111Variable Star NETwork; http://www.kusastro.kyoto-u.ac.jp/vsnet/ and AAVSO222American Association of Variable Star Observers; http://www.aavso.org/ databases.
2 OBSERVATIONS AND DATA REDUCTION
The data were obtained with the low-resolution spectropolarimeter, HBS (an acronym of “Henkou-Bunkou-Sokkou-Ki” which stands for spectropolarimeter in Japanese; Kawabata et al. 1999) from 1998 January 28 to 2003 September 29 at the Dodaira Observatory and the Okayama Astrophysical Observatory of NAOJ. At the Dodaira Observatory, HBS was attached to the Cassegrain focus of the 0.91 m telescope (; mm-1 at the focal plane). At Okayama Astrophysical Observatory, HBS was attached to the Cassegrain focus of either the 0.91 m telescope (; mm-1) or the 1.88 m telescope (; mm-1). HBS has a superachromatic half-wave plate and a quarts Wollaston prism; the orthogonally polarized spectra are simultaneously recorded on either a front-illuminated type TI CCD (10241024 pixels, 12 square per pixel) or a back-illuminated type SITe CCD (512512 pixels, 24 square per pixel). We used either the 1.4 mm circular hole (D1) or the 0.2 mm 1.4 mm rectangular hole (D2) as a focal diaphragm. Each diaphragm has two holes of the same dimension, and we put a target star in one hole and the nearby sky in the other. For the observations with D1 diaphragm, the spectral resolution depends on the seeing size because the stellar image size is much smaller than the diameter of the circular hole. For the observations with D2, the spectral resolution also depends on the stellar image size at the Okayama 0.91 m telescope, while it does not at the other telescopes because the stellar image size was usually larger than the narrower dimension of the rectangular hole. Nevertheless, the spectral resolution falls in the range between 50 Å and 150 Å in the all observations.
A unit of the observing sequence consisted of successive integrations at four position angles (PA), , , , and , of the half-wave plate. The obtained images were processed using the reduction package for HBS data, which was outlined in Kawabata et al. (1999). Instrumental polarization was derived from unpolarized standard star data obtained almost in each night. The data were averaged in each observation run (typically days for the Okayama 1.88 m telescope and 1-2 months for the other telescopes). The level of instrumental polarization was well expressed by a smooth function of wavelength, and vectorially removed from observed Stokes and spectra. At any run, the stability () of was less than 0.05 %. The factor of instrumental depolarization was obtained from observation through a Glan-Taylor prism. This observation also gave us the wavelength-dependent PA of the equivalent optical axis of the superachromatic half-wave plate. The zero point of the PA on the sky was determined from observations of strongly polarized standard stars listed in Wolff, Nordsieck, & Nook (1996). The instrumental polarization, the instrumental depolarization, and the zero point of the PA were properly corrected for in the reduction package.
The observations are summarized in Table 1, in which polarization data integrated over the synthetic Johnson V band filter (Bessell, 1990) are shown. For the observations with D2 diaphragm, we also show the equivalent widths of the C 5165 Å band in the table. The flux was calibrated using spectrophotometry of some standard stars (Taylor, 1984).
3 RESULTS
3.1 Overview
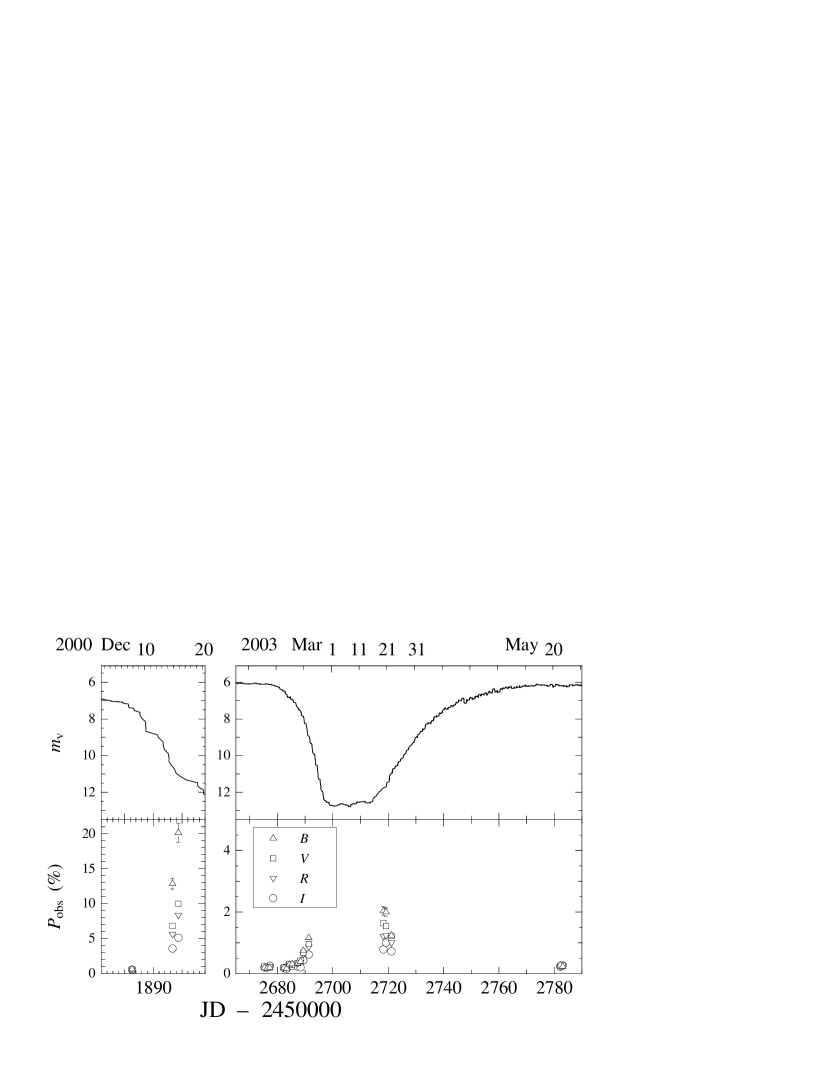
Figure 1 shows the time variation of polarization at the synthetic V band, together with the visual light curve. R CrB experienced three major photometric declines in our observation period. It demonstrates large polarization variability during declines; for example, the polarization angle rotated by more than 30 in 1999 December and the polarization amplitude became over 5 % in 2000 December. On the other hand, R CrB near maximum brightness showed nearly constant polarization (except for on 2001 March 9–12 and August 9). These characteristics are consistent with past observations (e.g., Efimov 1980; Stanford et al. 1988; Clayton et al. 1995). A commonly-accepted explanation for the large polarization during decline is that the unpolarized direct stellar light is heavily obscured by the dust cloud (dust puff) along the line of sight and the visible flux is predominantly scattered light.
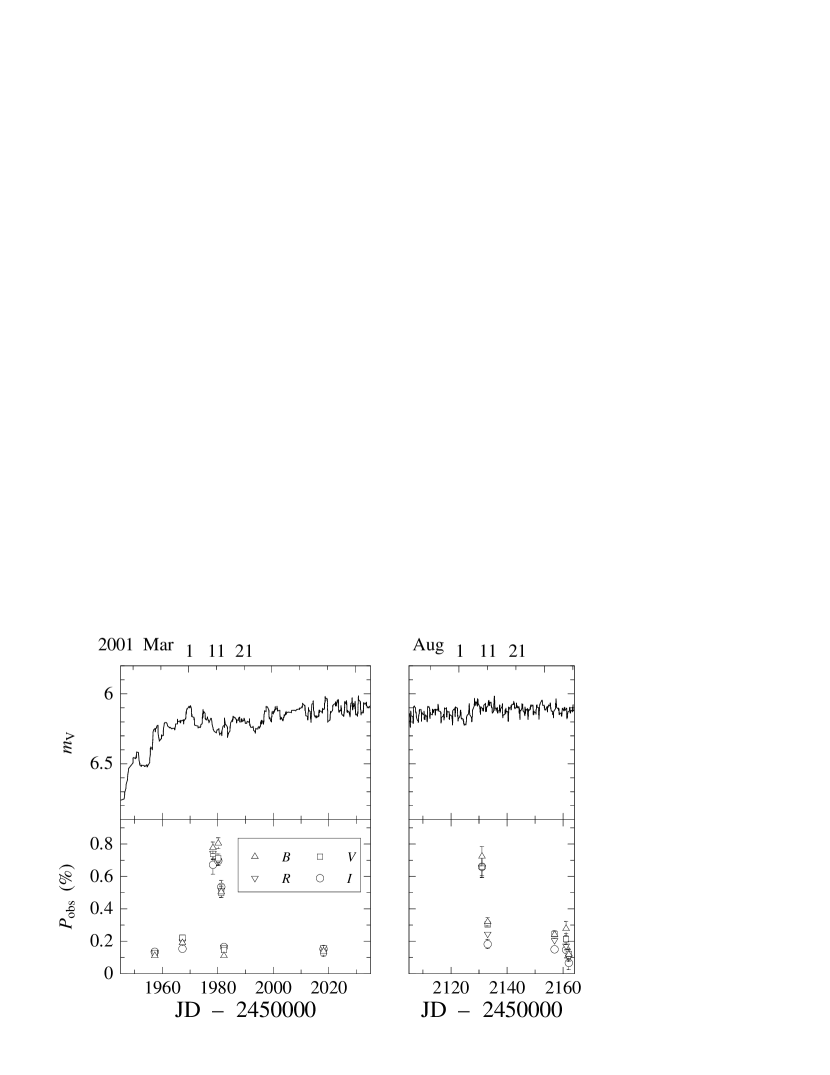
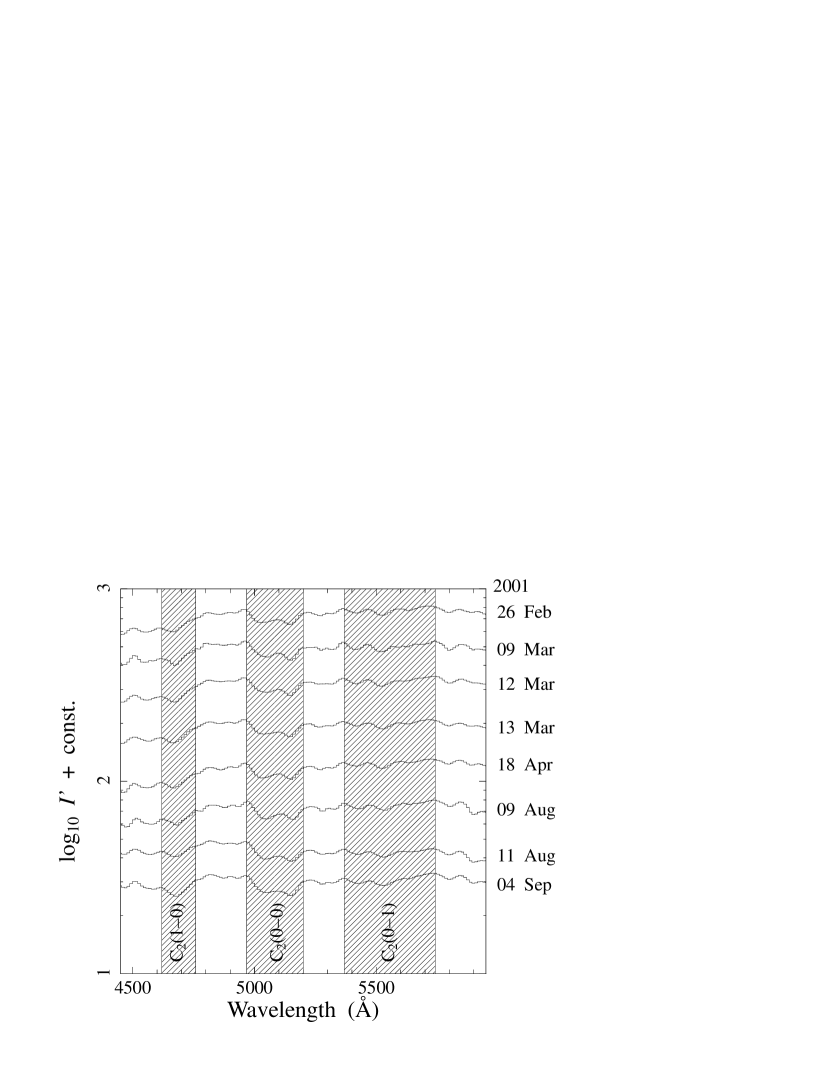
However, we detected temporal increase of polarization two times even at maximum brightness stages; the first event was observed on 2001 March 9–12 and the second was on 2001 August 9. In both times, the amplitude of polarization increased by % (Figure 2). Although polarization usually increases accompanied with the onset of major decline phases (Figure 3), we cannot see any significant decline () in the lightcurve around the two events. Also, any remarkable change in flux spectra have not been recognized as shown in Figure 4, and the equivalent width of C 5165 Å absorption band (Table 1) kept an almost constant value, 22–26 Å, which is consistent with the typical value of R CrB near maximum brightness (17.5–43 Å with an average of 26.5 Å; Clayton et al. 1995). It should be noted, however, that there is possible photometric variations accompanied with the polarimetric variations. The lightcurve shows possible shallow dips (0.1 mag) a few days prior to the polarization events (Figure 2), which could be connected with small dust formation episodes. We will discuss this temporal polarimetric activities after subtraction of the constant polarization component.
3.2 Constant Component of Polarization
It has been known that R CrB shows a nearly constant polarization at maximum brightness. Stanford et al. (1988) averaged the polarization observed in a period when no brightness fluctuations were seen, and derived a constant component of %, % ( %, ) as the values averaged over the optical wavelengths. The same values were obtained from averaging subsequent non-decline observations in 1990–1993 (Clayton et al., 1995). Clayton et al. (1997) reported that the observation in 1995 March, before the onset of the decline of 1995, showed a typical Serkowski-type ISP function ( %, , ) which was in good agreement with the previous estimations. Efimov (1980) assumed the interstellar component of % and from polarization of nearby field stars. Similar technique also gives % and (Bieging et al., 2006).
We averaged our polarization data obtained on 46 nights when R CrB was at maximum brightness stage ( mag) except those in the periods of the transient polarization. The mean values for Stokes and parameters and their standard deviations in each band are , , , and . Parameters of Serkowski function (Serkowski, Mathewson, & Ford, 1975; Whittet et al., 1992) corresponding to those values are derived by a non-linear regression as %, and . These are consistent with the constant and/or interstellar component derived in previous studies. The constancy of the component over two decades, being much more than the 3.5 yr IR period, allows us to consider that the component is fully interstellar polarization. It is noted that Clayton et al. (1995) found a small variability of polarization up to 0.14 % (possibly correlated with the light curve, at least, for their 1991 data) during the maximum brightness stage. The variability seems rather random, and such an effect would be cancelled out in our averaged values, while they possibly remain in the standard deviations.
4 DISCUSSION
After vectorial subtraction of the constant component from the observations, we obtain variable components of polarization, and . Their values in synthetic band are shown in Table 1.
It is known that polarized flux of R CrB is relatively constant since 1968 at the level of to at any part of declines (Whitney et al., 1992; Clayton et al., 1995, 1997), where is the total stellar flux at maximum brightness stage. Here, the polarized flux is simply derived as
| (1) |
where is the drop of visual magnitude from maximum (see § 1). In our data (Figure 1d), also falls between and on almost all days both during and out of declines. However, at the epochs of the transient polarization, showed 5 times as much as the typical maximum values, which indicates that the net polarization flux was extraordinarily large.
4.1 Origin of the Transient Polarization
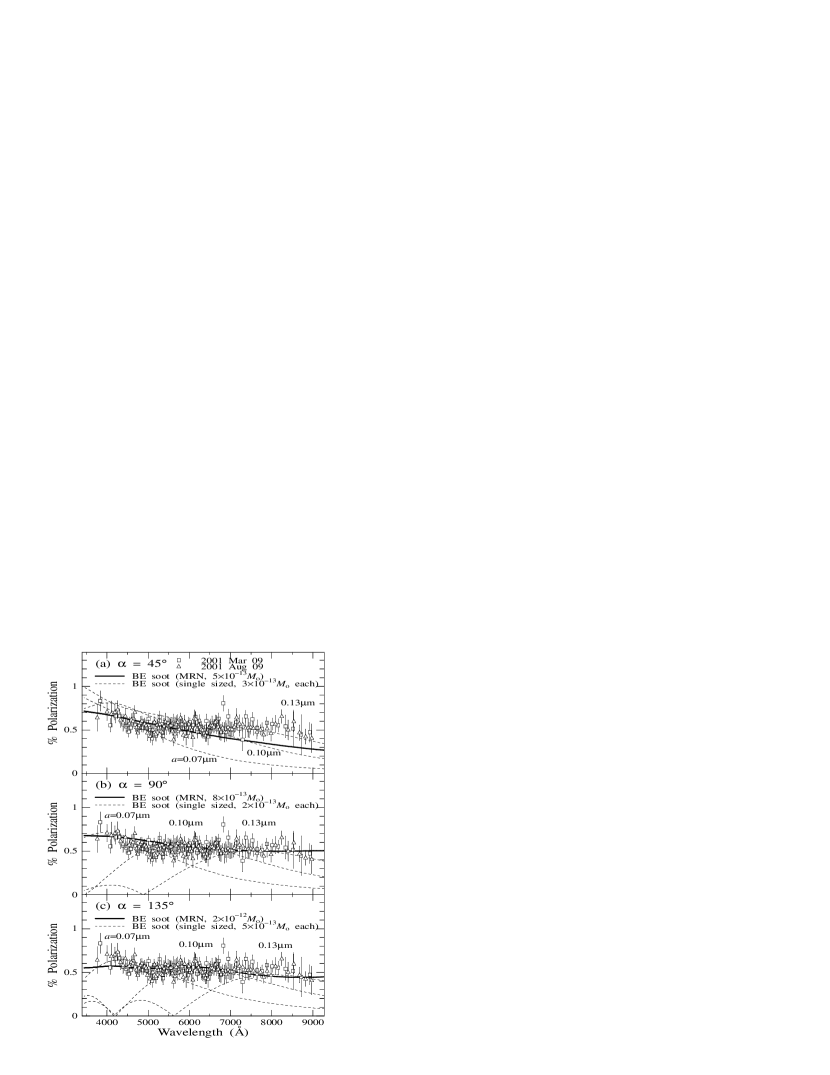
Our polarimetric monitoring brought first detection of the ‘transient polarization’ amounting to 0.5 % for R CrB in the maximum brightness phase. As far as we know, there exists only one observation in which R CrB near maximum brightness showed polarimetric variation larger than %: Efimov (1980) found % at 5450 Å on 1974 August 24 JD. Figures 5a and 5b show the time variation of and in the periods including the first and second events of the transient polarization. There is no significant wavelength dependence in position angle for both events, compared with the polarization found during decline phase (Figures 6a–c).
Suppose that several clouds exist around R CrB and that they scatter the light from the star. If each cloud was ejected from the photosphere in a random manner and it contains a different polarizing property from one to another, the position angle of the scattered light would be mostly wavelength dependent. The nearly constant against indicates that the polarization can be ‘effectively’ attributed to scattering by one component. The wavelength dependence of was almost flat in optical wavelengths and quite similar between the two cases. For the event on 1974 August 24, seems also flat (0.38–0.46 %) in the wavelength range, 3630–7450 Å (Efimov, 1980). The similarity in curve suggests an existence of the possible generality in the polarizing mechanism among those three events. Rayleigh scattering by large molecules or smallest solid particles () cannot reproduce such wavelength dependence because the scattering coefficient is highly wavelength-dependent (). Scattering by free electrons can reproduce a flat curve. However, it is unlikely for R CrB to have a large amount of ionized gas which can produce an observable polarization because the effective temperature of R CrB is not so high ( K; Schönberner 1975; Asplund et al. 1997). The emission lines which appears in R CrB during declines (e.g., Rao et al. 1999; Rao, Lambert, & Shetrone 2006) are not so strong that spectra at maximum brightness stage have little emission line.
As described in §1, several observational facts suggest that R CrB intermittently ejects dust puffs even at maximum brightness phases. The transient polarization could be naturally explained by a dust puff ejection off the line of sight. The shallow dips in the lightcurve (Figure 2) would support this idea, if we can assume that the dust puff eclipses a small part of the photosphere at the very early (nearest) stage. Single-sized grain of radius shows a peak polarization at optical wavelength and the peak wavelength varies with the grain radius (e.g., Shawl 1975). For flat curve, the dust grains would have a size distribution of a wide range of .
We performed a calculation of Mie scattering with a simplified model consisting of a point-like dust cloud and a central star, and estimated the light from the stellar system; that is the sum of an unpolarized direct stellar light and the partially-polarized scattered light. In the calculation we assumed that the dust grains are all spherical amorphous carbon (e.g., Lambert et al. 2001) and adopted the refractive indices of the BE soot (Rouleau & Martin, 1991). We also assumed that the cloud is optically-thin, i.e., multiple scattering process is negligible. We set the distance of the cloud where is the stellar radius (; Feast 1975) and make an estimation of the total mass of dust necessary for explaining the % polarization. The results are shown in Figure 7. In the case of forward-scattering (scattering angle , where is the angle between the direction of the incident light and that of the scattered one), the curves gradually decrease with wavelength and they do not fit well the observation. For a right angle scattering and backward-scattering () cases, the single-sized grain model fails to reproduce the flat curve. The size distribution of the carbon dust should range over 0.13 in order to produce the flat curve. We here consider a power-law size distribution like a well-known interstellar dust model (Mathis, Rumpl, & Nordsieck 1977; hereafter, MRN). The MRN size distribution is expressed as within , where and . Results of the MRN model seem not to contradict the observation in a wide range of scattering angle (–). This is only an illustrative example. A large choice of parameters () can yield similar curves. In general, the scattering by grains having various sizes seems a plausible mechanism for the transient polarization. The similarity in the observed curves between/among two (or three, including Efimov 1980’s event) events suggest that the dependence of on the scattering angle is not so strong.
A correlation between pulsational phase and the time of decline onset has been found for RY Sgr and V854 Cen which show fairly regular pulsation cycles than R CrB (Pugach, 1977; Lawson et al., 1992). Although the correlation is less significant for R CrB itself (Pugach, 1977; Goncharova, Kovalchuk & Pugach, 1986; Percy et al., 1987; Lawson, 1991; Fernie & Seager, 1994), it is recently confirmed by Crause, Lawson, & Henden (2007). These suggest that the condensation of dust is triggered by the stellar pulsation. According to this picture, the appearance of the transient polarization is likely to correlate with the pulsation phase. In our observation, the interval between the two polarization events was d. It has been known that R CrB shows a semi-regular pulsation of about 40 d from photometric and spectroscopic observations, for example d (Alexander et al., 1972), d (Yudin et al., 2002) and d (Rao et al., 1999). If we assume that the 151 d interval corresponds to four cycles, the length of one cycle is d. This seems a little shorter compared with the pulsation period. However, it is noted again that the pulsation period of R CrB is not coherent. Some shorter periods have been found in a timescale of a few hundred days. Fernie & Seager (1994) found well-developed oscillations with an apparent period of d in late 1992 in the visual light curve; while they also found that the better-defined peaks observed from 1992 through 1993 could be fitted with a single, linear ephemeris of period d. We cannot exclude the possibility that the transient polarization was correlated with the stellar pulsation.
4.2 Size Distribution of Dust
In the previous section, we showed that the wavelength dependence of the transient polarization can be reproduced by light scattering due to the carbon grain with various sizes including grains larger than 0.13 µm. However, UV extinction properties at the 1980 decline of R CrB indicate that the dust was grassy or amorphous carbon grain with a size distribution of – (Hecht et al., 1984). A detailed analysis of extinction curves (Zubko, 1997) for three observations of R CrB during declines in 1980–1984 indicated that the size distribution of graphite or amorphous carbon grains has a distinct peak-like form (widths of –) with typical sizes of through . If such small particles scatter the light from the central star, the curve should show a slope of decreasing with wavelength in the optical (Figure 7).
The amplitude of polarization is proportional to inverse square of the distance between the central star and the dust puff, , while the extinction depends only on the column density along the line of sight. The information derived from the extinction would be a mean property of the dust clouds along the line of sight toward the star, while the information derived from the polarization would be selectively for the dust close to the central star. Therefore the apparent difference in dust size between the estimate from polarimetry and that from UV extinction may indicate that the size distribution of the dust changes with the distance from the central star. Coyne & Shawl (1973) reported the variability of the wavelength dependence of polarization in 1972 decline of R CrB, and interpreted each observation with scattering by graphite dust of different sizes ranging from to in radius. In their results the mean particle size became smaller unsteadily with time. Evans (1985) proposed that the extinction properties of the dust responsible for 1982 decline of the hot RCB star, MV Sgr, can be explained by somewhat large carbon grains (). Another model applied for the same extinction data also gave a similar result (Zubko, 1997). For some extinction data of other RCB stars, he also suggested that the particle size exceeds . These facts suggest that the scattering matter consist of discrete clouds with different mean particle sizes (depending on their ages and their distance from the star) even in the same star. If the dust forms near the photosphere, a grain evaporation mechanism might play a role on the change of the size distribution (e.g., Evans 1993). The particle size inferred from our polarimetry suggests that the evolutionary phase of the dust grains causing the transient polarization is more or less the same from that of the dust grains obscuring the stellar flux during deep declines.
4.3 On the Short Timescale of Fading
The transient polarization in 2001 March diminished gradually between March 11 and 13. For the second event, the polarization also diminished within two days. It is remarkable that the decaying timescale of the transient polarization is only days, which is much shorter than the recovery times of the brightness from deep minimum (typically several weeks). If we assume that the scattering geometry keeps similar, the polarized flux approximately depends on the product of intensity of the stellar light at the scattering material and total scattering cross section. Thus, the amplitude of polarization decreases as the dust cloud goes away from the star (i.e., larger ) or the dust particles are destroyed (i.e., smaller ).
Here we consider the former case. If the decrease of polarization was only due to radial dispersal of dust cloud, the rate of decrease in polarization roughly depends on the radial distance and the mean expansion velocity of the cloud . The distance can be expressed as , where is the distance between the central star and the place where the dust formation finishes, and is the time elapsed from the cessation of the dust formation. For simplicity, we assume that the scattering cloud is optically thin. In this case, the polarization amplitude approximately changes as , where is a constant and is the finite disk depolarization factor (Cassinelli, Nordsieck, & Murison, 1987).333The optical thickness of the cloud might not be practically negligible, which results in depolarization. As the cloud expands, the cloud becomes optically-thin and the polarizing efficiency gradually recovers. Thus, should be damped more slowly than in the vicinity of the star and we obtain the lower-limit of with this method anyhow. This function monotonically decreases with for , and the most rapidly decreasing case occurs for nearly . The observed transient polarization decreased to one fourth within days. These indicate that the dust cloud needs to travel, at least, within two days, i.e., km s-1. Thus, if the expansion velocity exceeds km s-1, the dispersal of dust cloud can explain the timescale of the polarization extinction. However, the derived velocity is not consistent with the typical mass loss velocity observed in R CrB. The absorption component of the Na I D or the He I 10830 line are blueshifted by up to to km s-1 (e.g., Payne-Gaposchkin 1963; Querci & Querci 1978; Cottrell, Lawson, & Buchhorn 1990; Rao et al. 1999; Clayton, Geballe, & Bianchi 2003). Evolutions of emission line system at the onset of declines suggest that the wind velocity is likely to be lower ( km s-1) at close proximity to the photosphere, – (Payne-Gaposchkin, 1963; Alexander et al., 1972; Clayton, 1996). Although higher-velocity wind have been reported in the unusual RCB stars, V854 Cen (400–1000 km s-1, Clayton et al. 1993; Rao & Lambert 1993), the observational facts suggests the ejecta of R CrB is gradually accelerated up to km s-1 within a few weeks (probably by radiation pressure on dust grains). It is unlikely that the dust puff is accelerated to km s-1 within .
Therefore, the rate of depolarization can hardly be explained only by the radial expansion of the dust puff. If the dust forms actually near the photosphere (), the strong radiation from the central star can evaporate and destroy the dust grains once the possible cooling instability to promote the dust condensation (see §1) terminates. In any case, the rapid disappearance of polarization prefers that the dust grains are formed in an activated region, that is, a region close to the photosphere.
The problem of dust formation in such hostile environments is also under discussion in the field of Wolf-Rayet stars. Some phenomenological similarities with RCB stars have been reported for some late-type WC stars and [WC] PN nuclei (e.g., Williams 1997; Crowther 1997; Veen et al. 1998; Clayton 2001; Kato et al. 2002). Polarization is relatively sensitive to the region close to the light source for some optically-thin systems, and the transient polarization events represent the potential of polarimetry as the probe to the dust formation around such stars.
4.4 Geometry of Mass Loss
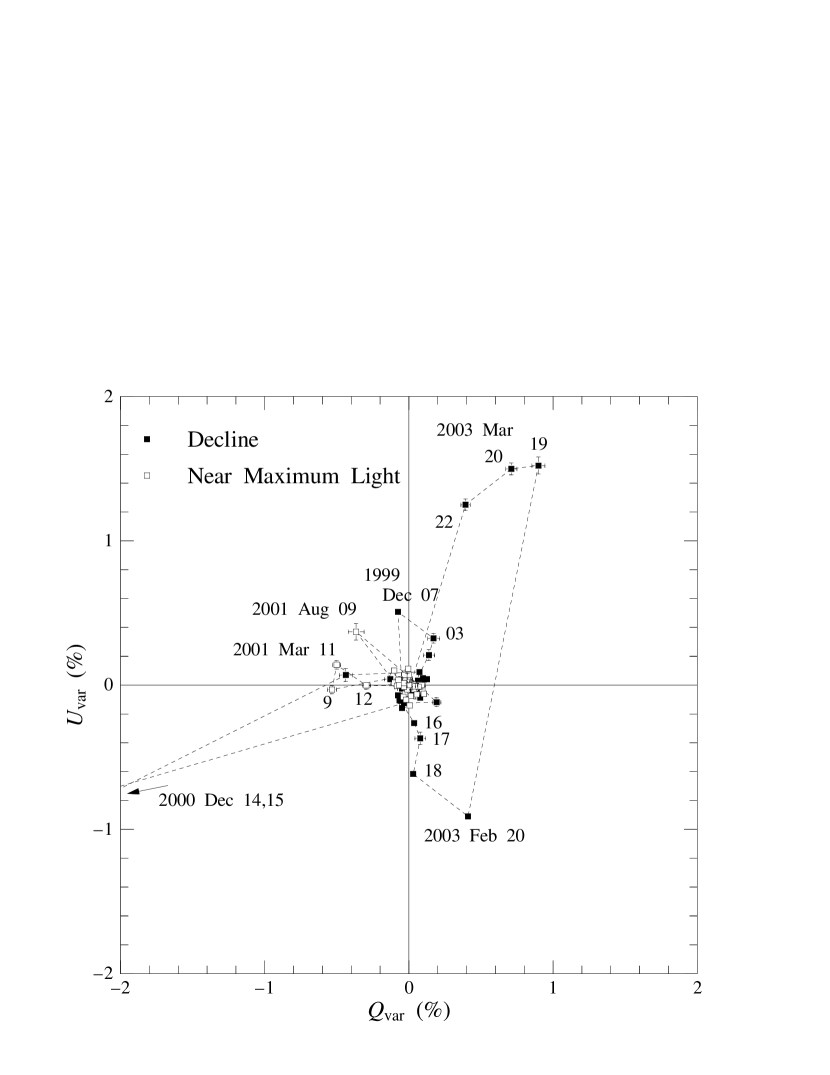
Stanford et al. (1988) presented that the PA of polarization in R CrB observed during decline of 1986 was along with data of two previous declines of 1968 and 1972 (Serkowski & Kruszewski, 1969; Coyne & Shawl, 1973). This suggests that there was a preferred plane (PA –) in the dust ejection. However, the PAs observed during 1989 and 1993 declines were significantly different from them (Clayton et al., 1995). Clayton et al. (1997) summarized a data set in five declines with polarimetry (from 1971 through 1996) having wavelength information when R CrB was more than 5 mag below maximum brightness, and presented that they well fit to the two opposite sector regions of PA and in diagram. They suggested that dust ejection in R CrB has a bipolar geometry consisting of obscuring torus and bipolar lobes. We can see a similar tendency in our data at decline phases (Figure 8). The PA of the largest polarization found during the 2000 decline (–) falls in the sector regions. The PA in the recovering phase of the 2003 decline (–) also falls near the sector regions. These implies that the bipolar geometry for dust ejection directions still exists in R CrB. It is noted that the transient polarization was at – (2001 March) and (2001 August), which lies near or only slightly apart from the edge of the sector regions.
During deep declines a considerable rotation () of the PA with wavelength has been occasionally found in some RCB stars (e.g., Whitney et al. 1992; Clayton et al. 1997). This can be explained by an optical depth effect where a thick torus obscures the central star and thin bipolar lobes act as a reflection nebula (Clayton et al., 1997). On the other hand, for the transient polarization, the rotation of the PA with wavelength is small. It supports the idea that only a single dust puff, which is closest to the photosphere, contributes the transient polarization effectively. The size distribution discussed in §4.2 would reflect the real properties of the newborn grains selectively.
Ohnaka et al. (2001) carried out K-band speckle interferometric observations of R CrB on 1996 October 1 () and 1999 September 28 () and suggested that the large dust shell (with an inner boundary at and 920 K) has a rather isotropic distribution, at least, in a scale of larger than . The authors also introduced a newly formed dust cloud close to the star ( and 1200 K) to fit both the visibility and the spectral energy distribution simultaneously. Asplund et al. (1997) gave an analysis of SED with a model atmosphere and suggested that the IR excess could be explained by recently formed, hot dust grains (K) amounting to a total mass of . Some extinction models for RCB stars suggested that the total mass (gasdust) per ejection event were – (Feast, 1986; Fadeyev, 1988; Clayton et al., 1992) although these could be affected by uncertainties in , (opening angle of the dust puff), and the gas-to-dust ratio. Yudin et al. (2002) derived a mean dust formation rate of yr-1 with a radiative transfer modeling. Our Monte Carlo simulation (see Appendix) suggests that the dust puff off the line of sight can produce a polarization of % when it has a mass of and an opening angle of for . The actual mass should be highly model dependent. However, the lower-limit of the dust mass is still much less than the mean dust formation rate ( yr-1), and we conclude that the amplitude of polarization in the transient polarization events would be consistent with the random ejection model in which dust puffs are formed in the close vicinity of the stellar atmosphere.
5 SUMMARY AND CONCLUSION
We carried out spectropolarimetric monitoring of R CrB from 1998 January to 2003 September. The constant component of polarization derived by Stanford et al. (1988) and confirmed by Clayton et al. (1995) still existed in our observational period. In addition, we discovered a temporal increase of polarization up to % at maximum brightness stage in 2001 March and August. It is likely that dust puff which was ejected off the line of sight produced the transient polarization. Shallow declines (0.1 mag) were marginally found a few days prior to the polarization events, which would support this idea if we can assume that the dust puff eclipsed a part of the photosphere at the very early stage. The flatness in curve of the transient polarization, which was a common property for both two cases, suggested that the size distribution of the dust was not like a -function (as the results of UV–optical extinction studies) but rather wide, e.g., a well-known model of interstellar dust (MRN size distribution). We suggest that the size distribution evolves with the age or the distance from the star. The fading timescale ( days) of the polarization is fairly rapid compared with the recovering rate of brightness from deep declines. It cannot be interpreted by a simple dissipation due to radial expansion of the dust puff at the expansion velocity of km s-1, even in the case where the dust formation occurred at . Higher expansion velocity or some mechanism to destroy the dust grains should be needed.
So far we have not detected a possible increasing part of the transient polarization, which would be important to discuss the process and the site of the dust formation around RCB stars. Further spectropolarimetric monitoring of RCB stars near maximum brightness will bring a valuable information of a dust formation and destruction processes in a hostile circumstellar environment.
Appendix A MONTE-CARLO SIMULATION OF POLARIZATION BY DUST PUFF
Monte Carlo method is a useful tool to solve problems including multiple scattering of light since it requires only a few assumptions and it can be applied for many kinds of complicated geometries and particles. The details in application of Monte Carlo method for light scattering process is described in, e.g., Warren-Smith (1983), and Hillier (1991).
As seen in Figure 9, we consider the Cartesian coordinate, (x, y, z). We define that the origin is the center of the star. The stellar radius is 1, i.e., the coordinate is normalized by the stellar radius. The direction of the earth is . The shape of the dust puff is a part of geometrically-thin spherical shell with a radius of and an opening angle of from the origin. The center of the dust puff, , is located in the - plane. These enable us to investigate the depolarization effect due to finite solid angle of the photosphere in the neighborhood of the star, which is a different point from Code & Whitney (1995)’s. Optical depth of the cloud along is . For simplicity, we neglect geometrical thickness of the shell. The scattering angle, that is, the angle between and , is .
In our Monte Carlo simulation, more than a million photons are emitted from random sites on the stellar surface toward random directions. All released photons have the same intensity, which means that rim darkening effect is neglected. When they meet the cloud, some penetrate, some are absorbed by, and the others are scattered by dust grains in the cloud. The scattered photons are partially polarized and emitted again toward a new direction according to a phase function . We adopt a single peaked Henyey-Greenstein function (White, 1979) as the phase function:
| (A1) |
and,
| (A2) | |||||
| (A3) | |||||
| (A4) | |||||
| (A5) | |||||
| (A6) |
where is an asymmetric parameter (ranging from 0 for isotropic scattering to 1 for forward-throwing), and are the maximum linear and circular polarization, respectively, and is the skew factor ( in almost all cases). Three parameters , , and , are related with the linear polarization. varies with a wavelength and a mean size of dust. White (1979) investigated the dependency of on wavelength for a well-known model of interstellar graphite dust. We used his values, lacking a better alternative for a mixture of cosmic grains having various sizes. Referring to Figure 2 of his paper, we adopt at 5500 Å. We also obtain the albedo at 5500 Å from the same figure. The is set to 0.51 (Code & Whitney, 1995). Although the single peaked Henyey-Greenstein phase function is not well approximated at longer wavelength region and for back-scattering cases (White, 1979), the difference can be negligible in our cases, i.e., and . More details of our calculation will be described in a preparing paper (Ikeda & Seki, 2007).
A.1 Size and Mass of Dust Puff
In this section, we give a rough estimation for the size and mass of dust puff responsible for the amplitude of the transient polarization (%) using the Monte-Carlo method. In Table 2 we summarized the results at 5500 Å for both and cases. Since the wavelength dependence is expected to be small for the dust model, they can be considered as typical values in the optical region. It is obvious that the models of (backward scattering) cannot produce , where is the scattering angle at the cloud center. Figure 10 shows the relations of vs. satisfying polarization of %. To obtain the results of %, we need (i) – and for , or (ii) and for . The cloud at larger distance can produce % with smaller optical thickness and smaller opening angle because the depolarization effect due to finite solid angle of the photosphere become small. However, larger mass is needed for large . We can estimate the total mass of the dust puff as
| (A7) | |||||
| (A8) |
where is the bulk density of dust grains, and are the averaged cubic radius and averaged cross section of extinction per a dust particle, respectively, and is solid angle of the puff seen from the star. In Equation A8 we adopted cm3 and cm2 (White, 1979), g cm-3 (Evans, 1993). We have for the case (), and for the case ().
References
- Alexander et al. (1972) Alexander, J. B., Andrews, P. J., Catchpole, R. M., Feast, M. W., Lloyd Evans, T., Menzies, J. W., Wisse, P. N. J., & Wisse, M. 1972, MNRAS, 158, 305
- Asplund & Gustafsson (1996) Asplund, M., & Gustafsson, B. 1996, in ASP Conf. Ser. Vol. 96, Hydrogen-Deficient Stars, eds. C. S. Jeffery and U. Heber (San Francisco: ASP), 39
- Asplund et al. (1997) Asplund, M., Gustafsson,, B. Kiselman, D., & Eriksson, K. 1997, A&A, 318, 521
- Bessell (1990) Bessell, M. S. 1990, PASP, 102, 1181
- Bieging et al. (2006) Bieging, J. H., Schmidt, G. D., Smith, P. S., & Oppenheimer, B. D. 2006, ApJ, 639, 1053
- Cassinelli, Nordsieck, & Murison (1987) Cassinelli, J. P., Nordsieck, K. H., & Murison, M. A. 1987, ApJ, 317, 290
- Clayton et al. (1992) Clayton, G. C., Whitney, B. A., Stanford, S. A., & Drilling, J. S. 1992, ApJ, 397, 652
- Clayton et al. (1993) Clayton, G. C., Lawson, W. A., Whitney, B. A., & Pollacco, D. L. 1993, MNRAS, 264, L13
- Clayton et al. (1994) Clayton, G. C., Lawson, W. A., Cottrell, P. L., Whitney, B. A., Stanford, S. A., & de Ruyter, F. 1994, ApJ, 432, 785
- Clayton et al. (1995) Clayton, G. C., Whitney, B. A., Meade, M. R., Babler, B., Bjorkman, K. S., & Nordsieck, K. H. 1995, PASP, 107, 416
- Clayton (1996) Clayton, G. C. 1996, PASP, 108, 225
- Clayton et al. (1997) Clayton, G. C., Bjorkman, K. S., Nordsieck, K. H., & Zellner, N. E. 1997, ApJ, 476, 870
- Clayton (2001) Clayton, G. C. 2001, Ap&SS, 275, 143
- Clayton, Geballe, & Bianchi (2003) Clayton, G. C., Geballe, T. R., & Bianchi, L. 2003, ApJ, 595, 412
- Clayton et al. (2007) Clayton, G. C., Geballe, T. R., Herwig, F., Fryer, C., & Asplund, M. 2007, ApJ, 662, 1220
- Code & Whitney (1995) Code, A. D., & Whitney, B. A. 1995, ApJ, 441, 400
- Cottrell, Lawson, & Buchhorn (1990) Cottrell, P. L., Lawson, W. A., & Buchhorn, M. 1990, MNRAS, 244, 149
- Coyne & Shawl (1973) Coyne, G. V., & Shawl, S. J. 1973, ApJ, 186, 961
- Coyne (1974) Coyne, G. V. 1974, IBVS, No. 914
- Crause, Lawson, & Henden (2007) Crause, L. A., Lawson, W. A., & Henden, A. A. 2007, MNRAS, 375, 301
- Crowther (1997) Crowther, P. A. 1997, MNRAS, 290, L59
- de Laverny & Mékarnia (2004) de Laverny, P., Mékarnia, D. 2004, A&A, 428, L13
- Efimov (1980) Efimov, Yu. S. 1980, Bull. Crimean Astrophys. Obs., 61, 88
- Efimov (1990) Efimov, Yu. S. 1990, AZh, 67, 494
- Evans (1993) Evans, A. 1993, The Dusty Universe (New York: Ellis Horwood)
- Evans (1985) Evans, A., Whittet, D. C. B., Davies, J. K., Kilkenny, D., & Bode, M. F. 1985, MNRAS, 217, 767
- Fadeyev (1986) Fadeyev, Y. A. 1986, in Hydrogen Deficient Stars and Related Objects, eds. K. Hunger, D. Schönberner, N. Kameswara Rao (Dordrecht: Reidel), 441
- Fadeyev (1988) Fadeyev, Y. A. 1988, MNRAS, 233, 65
- Feast (1975) Feast, M. W. 1975, in IAU Symp. No. 67, Variable Stars and Stellar Evolution, eds. V. E. Sherwood and L. Plaut (Dordrecht: Reidel), 129
- Feast (1986) Feast, M. W. 1986, in Hydrogen Deficient Stars and Related Objects, eds. K. Hunger, D. Schönberner, N. Kameswara Rao (Dordrecht: Reidel), 151
- Feast (1997) Feast, M. W. 1997, MNRAS, 285, 339
- Feast (2000) Feast, M. W. 2000, in IAU Symp. 177, The Carbon Star Phenomenon, ed. R. F. Wing (Dordrecht: Kluwer), 207
- Feast et al. (1997) Feast, M. W., Carter, B. S., Roberts, G., Marang, F., & Catchpole, R. M. 1997, MNRAS, 285, 317
- Feast & Glass (1973) Feast, M. W., & Glass, I. S. 1973, MNRAS, 161, 293
- Fernie & Seager (1994) Fernie, J. D., & Seager,S. 1994, PASP, 106, 1138
- Forrest, Gillett, & Stein (1972) Forrest, W. J., Gillett, F. C., & Stein, W. A. 1972, ApJ, 178, L129
- Goncharova, Kovalchuk & Pugach (1986) Goncharova, R. I., Kovalchuk, G. U., Pugach, A. F. 1983, Astrophysics, 19, 161
- Hecht et al. (1984) Hecht, J. H., Holm, A. V., Donn, B., & Wu, C. C. 1984, ApJ, 280, 228
- Hillier (1991) Hillier, D. J. 1991, A&A, 247, 455
- Iben, Tutukov, & Yungelson (1996) Ibe, I. J., Tutukov, A. V., & Yungelson, L. R. 1996, ApJ, 456, 750
- Ikeda & Seki (2007) Ikeda, Y., & Seki, M. 2007, in preparation.
- Kato et al. (2002) Kato, T., Haseda, K., Takamizawa, K., & Yamaoka, H. 2002, A&A, 393, L69
- Kawabata et al. (1999) Kawabata, K. S., et al. 1999, PASP, 111, 898
- Lambert et al. (2001) Lambert, D. L., Rao, N. K., Pandey, G., & Ivans, I. I. 2001, ApJ, 555, 925
- Lawson (1991) Lawson, W. A. 1991, MNRAS, 253, 625
- Lawson et al. (1992) Lawson, W. A., Cottrell, P. L., Gilmore, A. C., & Kilmartin, P. M. 1992, MNRAS, 256, 339
- Loreta (1934) Loreta, E. 1934, Astr. Nach., 254, 151
- Mathis, Rumpl, & Nordsieck (1977) Mathis, J. S., Rumpl, W., & Nordsieck, K. H. 1977, ApJ, 217, 425
- Ohnaka et al. (2001) Ohnaka, K., et al. 2001, A&A, 380, 212
- Ohnaka et al. (2003) Ohnaka, K., et al. 2003, A&A, 408, 553
- O’Keefe (1939) O’Keefe, J. A. 1939, ApJ, 90, 294
- Payne-Gaposchkin (1963) Payne-Gaposchkin, C. 1960, ApJ, 138, 320
- Percy et al. (1987) Percy, J. R., Carriere, L. E. M., & Fabro, V. A. 1987, AJ, 93, 200
- Pugach (1977) Pugach, A. F. 1977, IBVS, 1277
- Querci & Querci (1978) Querci, M., & Querci, F. 1978, A&A, 70, L45
- Rao et al. (1999) Rao, N. K., et al. 1999, MNRAS, 310, 717
- Rao & Lambert (1993) Rao, N. K., & Lambert, D. L. 1993, AJ, 105, 1915
- Rao, Lambert, & Shetrone (2006) Rao, N. K., Lambert, D. L., & Shetrone, M. D. 2006, MNRAS, 370, 941
- Rosenbush & Rosenbush (1990) Rosenbush, A. É. & Rosenbush, V. K. 1990, IBVS, 3439
- Rosenbush (2001) Rosenbush, A. É. 2001, Astrophysics, 44, 78
- Rouleau & Martin (1991) Rouleau, F. & Martin, P. G., 1991, ApJ, 377, 526
- Saio & Jeffery (2002) Saio, H., & Jeffery, C. S. 2002, MNRAS, 333, 121
- Schönberner (1975) Schönberner, D. 1975, A&A, 44, 383
- Serkowski & Kruszewski (1969) Serkowski, K., & Kruszewski, A. 1969, ApJ, 155, L15
- Serkowski, Mathewson, & Ford (1975) Serkowski, K., Mathewson, D. S., & Ford, V. L. 1975, ApJ, 196, 261
- Shawl (1975) Shawl, S. J. 1975, AJ, 80, 595
- Soker & Clayton (1999) Soker, N., & Clayton, G. C. 1999, MNRAS, 307, 993
- Stanford et al. (1988) Stanford, S. A., Clayton, G. C., Meade, M. R., Nordsieck, K. H., Whitney, B. A., Murison, M. A., Nook, M. A., & Anderson, C. M. 1988, ApJ, 325, L9
- Stein et al. (1969) Stein, W. A., Gaustad, J. E., Gillett, F. C., & Knacke, R. F. 1969, ApJ, 155, L3
- Taylor (1984) Taylor, B. J. 1984, ApJS, 54, 259
- Trammell, Dinerstein, & Goodrich (1994) Trammell, S. R., Dinerstein, H. L., & Goodrich, R. W. 1994, AJ, 108, 984
- Veen et al. (1998) Veen, P. M., van Genderen, A. M., van der Hucht, K. A., Sterken, C., & Dominik, C. 1998, A&A, 329, 199
- Warren-Smith (1983) Warren-Smith, R. F. 1983, MNRAS, 205, 337
- Wickramasinghe (1973) Wickramasinghe, N. C. 1973, Light Scattering Functions for Small Particles with Applications in Astronomy (London: Adam Hilger)
- White (1979) White, R.L. 1979, ApJ, 229, 954
- Whitney et al. (1992) Whitney, B. A., & Clayton. G. C., Schulte-Ladbeck, R. E., & Meade, M. R. 1992, AJ, 103, 1652
- Whitney (1993) Whitney, B. A., Balm, S. P., & Clayton, G. C. 1993, in ASP Conf. Ser. Vol. 45, Luminous High-Latitude Stars, ed. D. Sasselov (San Francisco: ASP), 105
- Whittet et al. (1992) Whittet, D. C. B., Martin, P. G., Hough, J. H., Rouse, M. F., Bailey, J. A., & Axon, D. J. 1992, ApJ, 386, 562
- Williams (1997) Williams, P. M. 1997, Ap&SS, 251, 321
- Woitke, Goeres, & Sedlmayr (1996) Woitke, P, Goeres, A., & Sedlmayr, E. 1996, A&A, 313, 217
- Wolff, Nordsieck, & Nook (1996) Wolff, M. J., Nordsieck, K. H., & Nook, M. A. 1996, AJ, 111, 856
- Yudin et al. (2002) Yudin, B. F., Fernie, J. D., Ikhsanov, N. R., Shenavrin, V. I., & Weigelt, G. 2002, A&A, 394, 617
- Yudin et al. (2003) Yudin, R. V., Evans, A., Barrett, P., Albinson, J. S., Davies, J. K., & Hutchinson, M. G. 2003, A&A, 412, 405
- Zubko (1997) Zubko, V. G. 1997, MNRAS, 289, 305


| Date | JD | aaVisual magnitude averaged for all data within days in VSNET database. | Tel.bbD36, O36 and O74 denote 0.91 m at Dodaira, 0.91 m at Okayama and 1.88 m at Okayama, respectively. | Diaph.ccD1: 1.4 mm circle, D2: 0.2 mm 1.4 mm rectangle. | CCDddT and S denote TI CCD and SITe CCD, respectively. | Exp. | eeThe equivalent width of the C 5165 Å band is measured between 4970 Å and 5200 Å for D2 observations. | Observed polarizationffObserved polarization is considered as a vectorial summation of a constant component and a variable component (see text). | Variable componentffObserved polarization is considered as a vectorial summation of a constant component and a variable component (see text). | Pol. fluxggPolarized flux | ||
|---|---|---|---|---|---|---|---|---|---|---|---|---|
| yyyymmdd | 2450000+ | sec | (EW) Å | (%) | (deg.) | (%) | (deg.) | |||||
| 19980128 | 0842.32 | D36 | D1 | T | 1200 | — | ||||||
| 19980325 | 0898.20 | D36 | D2 | T | 1440 | |||||||
| 19980328 | 0901.23 | D36 | D1 | T | 1680 | — | ||||||
| 19980329 | 0902.19 | D36 | D1 | T | 792 | — | ||||||
| 19980522 | 0956.07 | D36 | D1 | T | 1260 | — | ||||||
| 19980824 | 1050.01 | O74 | D1 | T | 960 | — | ||||||
| 19990222 | 1232.23 | D36 | D1 | T | 3200 | — | ||||||
| 19990223 | 1233.22 | D36 | D1 | T | 2880 | — | ||||||
| 19990225 | 1235.23 | D36 | D1 | T | 2880 | — | ||||||
| 19990227 | 1237.19 | D36 | D1 | T | 4200 | — | ||||||
| 19990316 | 1254.18 | D36 | D1 | T | 1800 | — | ||||||
| 19990416 | 1285.16 | D36 | D1 | T | 1800 | — | ||||||
| 19990501 | 1300.06 | D36 | D1 | T | 1680 | — | ||||||
| 19990510 | 1309.19 | O74 | D1 | T | 1440 | — | ||||||
| 19990517 | 1316.21 | O74 | D1 | T | 1680 | — | ||||||
| 19990808 | 1399.01 | D36 | D1 | S | 1500 | — | ||||||
| 19991202 | 1515.34 | D36 | D1 | S | 1200 | — | ||||||
| 19991203 | 1516.34 | D36 | D1 | S | 1200 | — | ||||||
| 19991207 | 1520.33 | D36 | D1 | S | 1920 | — | ||||||
| 20000101 | 1545.33 | D36 | D1 | S | 2400 | — | ||||||
| 20000127 | 1571.30 | D36 | D1 | S | 1560 | — | ||||||
| 20000203 | 1578.30 | D36 | D1 | S | 640 | — | ||||||
| 20000204 | 1579.26 | D36 | D1 | S | 1680 | — | ||||||
| 20000229 | 1604.19 | D36 | D1 | S | 2176 | — | ||||||
| 20000306 | 1610.22 | D36 | D1 | S | 2560 | — | ||||||
| 20000329 | 1633.15 | D36 | D1 | S | 2080 | — | ||||||
| 20001207 | 1886.35 | O36 | D1 | S | 1500 | — | ||||||
| 20001214 | 1893.35 | O36 | D1 | S | 2800 | — | ||||||
| 20001215 | 1894.35 | O36 | D1 | S | 2400 | — | ||||||
| 20010130 | 1940.30 | O74 | D2 | T | 5600 | |||||||
| 20010202 | 1943.32 | O74 | D1 | T | 2240 | — | ||||||
| 20010216 | 1957.34 | O36 | D2 | S | 1680 | |||||||
| 20010226 | 1967.29 | O36 | D2 | S | 2400 | |||||||
| 20010309 | 1978.30 | O36 | D2 | S | 1800 | |||||||
| 20010311 | 1980.17 | O36 | D1 | S | 3840 | — | ||||||
| 20010312 | 1981.24 | O36 | D2 | S | 3640 | |||||||
| 20010313 | 1982.22 | O36 | D2 | S | 2000 | |||||||
| 20010418 | 2018.09 | O36 | D2 | S | 1440 | |||||||
| 20010809 | 2131.05 | O36 | D2 | S | 900 | |||||||
| 20010811 | 2133.06 | O36 | D2 | S | 1200 | |||||||
| 20010904 | 2156.97 | O36 | D2 | S | 1080 | |||||||
| 20010908 | 2161.04 | O36 | D2 | S | 960 | |||||||
| 20010909 | 2162.03 | O36 | D2 | S | 1080 | |||||||
| 20010926 | 2178.95 | O36 | D2 | S | 1200 | |||||||
| 20011030 | 2212.90 | O36 | D2 | S | 960 | |||||||
| 20011031 | 2213.89 | O36 | D2 | S | 1120 | |||||||
| 20011201 | 2245.36 | O36 | D2 | S | 1600 | |||||||
| 20011202 | 2246.36 | O36 | D2 | S | 1200 | |||||||
| 20011227 | 2271.35 | O36 | D2 | S | 3000 | |||||||
| 20020122 | 2297.36 | O36 | D2 | S | 1200 | |||||||
| 20020124 | 2299.37 | O36 | D2 | S | 1080 | |||||||
| 20020131 | 2306.31 | O36 | D2 | S | 1800 | |||||||
| 20020206 | 2312.28 | O36 | D2 | S | 2160 | |||||||
| 20020207 | 2313.26 | O36 | D2 | S | 2160 | |||||||
| 20020224 | 2330.27 | O74 | D2 | S | 360 | |||||||
| 20020401 | 2366.31 | O36 | D2 | S | 1260 | |||||||
| 20020403 | 2368.22 | O36 | D2 | S | 2700 | |||||||
| 20020501 | 2396.11 | O36 | D2 | S | 2880 | |||||||
| 20020803 | 2489.97 | O36 | D2 | S | 900 | |||||||
| 20020804 | 2490.98 | O36 | D2 | S | 900 | |||||||
| 20020805 | 2492.04 | O36 | D2 | S | 900 | |||||||
| 20020806 | 2492.99 | O36 | D2 | S | 1260 | |||||||
| 20020807 | 2493.96 | O36 | D2 | S | 972 | |||||||
| 20030204 | 2675.33 | O36 | D2 | S | 1800 | |||||||
| 20030205 | 2676.31 | O36 | D2 | S | 1440 | |||||||
| 20030206 | 2677.25 | O36 | D2 | S | 1600 | |||||||
| 20030211 | 2682.33 | O36 | D2 | S | 3200 | |||||||
| 20030212 | 2683.29 | O36 | D2 | S | 2880 | |||||||
| 20030213 | 2684.32 | O36 | D2 | S | 2400 | |||||||
| 20030214 | 2685.31 | O36 | D2 | S | 4000 | |||||||
| 20030216 | 2687.34 | O36 | D2 | S | 2400 | |||||||
| 20030217 | 2688.30 | O36 | D2 | S | 2400 | |||||||
| 20030218 | 2689.34 | O36 | D2 | S | 2400 | |||||||
| 20030220 | 2691.28 | O36 | D2 | S | 3200 | |||||||
| 20030319 | 2718.26 | O36 | D2 | S | 9600 | |||||||
| 20030320 | 2719.23 | O36 | D2 | S | 10800 | |||||||
| 20030322 | 2721.19 | O36 | D2 | S | 9600 | |||||||
| 20030522 | 2782.12 | O36 | D2 | T | 4140 | |||||||
| 20030523 | 2783.02 | O36 | D2 | T | 3200 | |||||||
| 20030725 | 2845.97 | O36 | D2 | S | 700 | |||||||
| 20030727 | 2848.09 | O36 | D2 | S | 552 | |||||||
| 20030926 | 2908.96 | O36 | D2 | S | 1800 | |||||||
| 20030928 | 2910.92 | O36 | D2 | S | 1080 | |||||||
| 20030929 | 2911.92 | O36 | D2 | S | 960 | |||||||
| % polarization | ||||||
|---|---|---|---|---|---|---|
| 0.035 | 0.081 | 0.118 | 0.122 | |||
| 0.074 | 0.175 | 0.250 | 0.259 | |||
| 0.151 | 0.351 | 0.497 | 0.511 | |||
| 0.232 | 0.533 | 0.742 | 0.768 | |||
| 0.042 | 0.100 | 0.144 | 0.148 | |||
| 0.092 | 0.218 | 0.311 | 0.321 | |||
| 0.191 | 0.453 | 0.640 | 0.663 | |||
| 0.306 | 0.718 | 1.014 | 1.051 | |||
| 0.011 | 0.026 | 0.038 | 0.039 | |||
| 0.024 | 0.058 | 0.083 | 0.087 | |||
| 0.052 | 0.122 | 0.174 | 0.180 | |||
| 0.086 | 0.200 | 0.287 | 0.297 | |||
| 0.030 | 0.073 | 0.110 | 0.115 | |||
| 0.116 | 0.278 | 0.415 | 0.434 | |||
| 0.243 | 0.579 | 0.856 | 0.892 | |||
| 0.471 | 1.089 | 1.588 | 1.634 | |||
| 0.028 | 0.069 | 0.104 | 0.109 | |||
| 0.111 | 0.269 | 0.404 | 0.422 | |||
| 0.239 | 0.577 | 0.865 | 0.901 | |||
| 0.489 | 1.169 | 1.732 | 1.804 | |||
| 0.005 | 0.012 | 0.018 | 0.019 | |||
| 0.020 | 0.049 | 0.073 | 0.077 | |||
| 0.045 | 0.109 | 0.164 | 0.171 | |||
| 0.100 | 0.242 | 0.361 | 0.376 | |||