Imaging the Radio Photospheres of Mira Variables
Abstract
We have used the VLA at 43 GHz to image the radio continuum emission from Ceti, R Leo, and W Hya and to precisely locate their SiO maser emission with respect to the star. The radio continuum emission region for all three stars has a diameter close to 5.6 AU. These diameters are similar to those measured at infrared wavelengths in bands containing strong molecular opacity and about twice those measured in line-free regions of the infrared spectrum. Thus, the radio photosphere and the infrared molecular layer appear to be coextensive. The 43 GHz continuum emission is consistent with temperatures near 1600 K and opacity from H- free-free interactions. While the continuum image of Ceti appears nearly circular, both R Leo and W Hya display significant elongations. The SiO masers for all three stars show partial rings with diameters close to 8 AU.
1 Introduction
A typical oxygen-rich Mira variable has a radius, , defined by line-free regions of the spectrum, of about 1–2 AU. Surrounding the star is an extensive “molecular layer,” which extends to nearly 2 and can be opaque across most of the visible and infrared spectrum. The time-variable formation of metallic oxides in the molecular photosphere can explain the thousand-fold (8 mag) variations in the optical light curves of some Miras (Reid & Goldston, 2002). Also at about 2 one detects a “radio photosphere,” surrounded by an SiO maser emitting region. Beyond the SiO region dust grains form, radiation pressure accelerates the dust, transferring outward momentum to the gas and leading to significant mass loss.
Reid & Menten (1997a) published measurements made with the Very Large Array (VLA) of a sample of Mira-like variables ( Ceti, R Leo, W Hya, R Aql, Cyg, and R Cas). Their results revealed that the these stars exhibit a cm-wavelength spectral index of and nearly constant radio light curves (variation % about the mean). Also, they imaged the radio continuum of W Hya at 22 GHz and found the star precisely at the center of a ring of H2O masers with a radius of 015 (Reid & Menten, 1990).
The detection of a “radio photosphere” near provides a new observational tool to increase our understanding of the region between the star and the dust formation zone. For the physical conditions expected in the radio photosphere, free electrons, obtained mostly from the ionization of potassium and sodium, provide the dominant opacity through free-free interactions with neutral H and H2. Reid & Menten (1997a) proposed a simple physical model which can explain the radio frequency observations. At cm-wavelengths, unity optical depth is achieved at a radius of about 3 to 4 AU, where the density and temperature are cm-3 and K, respectively. This produces a flux density which is roughly twice that expected for black-body emission from the underlying star, as is observed.
In this paper, we report observations at 7 mm wavelength (43 GHz) in which we simultaneously imaged the radio photospheres and SiO maser emission from two Miras ( Ceti and R Leo) and one semi-regular variable (W Hya). These observations and supporting models constrain the physical and dynamical conditions between and
2 Observations & Data Analysis
The observations were made with the NRAO 111The National Radio Astronomy Observatory (NRAO) is operated by Associated Universities, Inc., under a cooperative agreement with the National Science Foundation. Very Large Array (VLA) under program AR446. Our goal was to measure directly the angular size of radio photospheres with the highest angular resolution afforded by the VLA. Our synthesized beam at 43 GHz in the A-configuration was full-width at half-maximum (FWHM), which well resolves a typical Mira to a distance of pc. Since radio frequency “seeing” is limited primarily by fluctuations of water vapor in the atmosphere and is rarely better than , we used a calibration scheme developed by us (Reid & Menten, 1990, 1997a) in which circumstellar masers provide a phase reference for the continuum data. This allows diffraction limited imaging to be achieved.
Between 2000 October 25 and November 6, we observed three stars: Ceti, R Leo, and W Hya. Optical stellar phases for the three stars were approximately 0.05, 0.55, and 0.25, based on examination of AAVSO visual magnitudes for several cycles before and after the observations.
The observations to measure stellar sizes were conducted in 4-IF continuum mode. The A-C IF pair (50 MHz bandwidth in right and left circular polarization) was centered at 43164.9 MHz, which is 43 MHz above the rest frequency of 43122.08 MHz of the SiO v, J=1–0 line. The B-D IF pair used a 1.563 MHz bandwidth centered on the SiO line at local standard-of-rest (LSR) velocities of 47.0 km s-1 for Ceti, 1.0 km s-1 for R Leo, and 42.0 km s-1 for W Hya.
The interferometer data were calibrated using the Astronomical Image Processing System (AIPS). Absolute flux density calibration was obtained from an observation of 3C286, assuming a flux density extrapolated from the formula given by Baars et al. (1977). Following the procedures described in detail in Reid & Menten (1997a), we used roughly hourly observations of a strong continuum source to update pointing, to remove the electronic phase differences among the bands and to monitor the slowly-varying amplitude response of the antennas. The narrow-band data, containing very intense SiO maser emission, were phase-only self-calibrated on each 10 sec integration. The resulting antenna–dependent phase corrections were then applied to the broad-band data containing the continuum emission from the star. Since the masers are observed simultaneously with the continuum data and come from essentially the same position on the sky, this calibration removes all significant atmospheric phase-fluctuations.
Once the data were “cross-self-calibrated,” both the narrow-band maser and broad-band continuum signals were imaged with the AIPS task IMAGR. Map resolutions and noise levels are given in Table 1. In order to simplify map analysis, CLEAN maps used a round restoring beam equal approximately to the geometric mean of the dirty beam’s major and minor axes. These maps are shown in left column of panels in Fig. 1.
In addition to images, we also analyzed the interferometer visibility data in the following manner. Firstly, we measured the position of peak continuum emission by fitting an elliptical Gaussian brightness distribution to the map. Next, we “shifted” the data to place the continuum peak at the interferometer phase-center. After time averaging the visibilities for 1 minute, we fitted the data in the (u,v)-plane with a uniform-brightness, elliptical-disk model. This fitting was done using MIRIAD analysis software. Parameters of these fits are given in Table 2.
Displaying the 2-dimensional (u,v)-plane data and model fits for weak sources is difficult. In order to obtain sufficient signal-to-noise ratio, the data need to be vector averaged over large portions of the irregularly sampled (u,v)-plane. This precludes, for example, plotting visibility amplitude versus projected baseline length along a narrow strip at given position angle in the (u,v)-plane. We have chosen to bin the data and plot the real part of the visibility versus baseline length. These plots appear in the right-hand panels of Fig. 1. For an elliptical source, this mixes data with differing visibilities, owing to the greater resolution of a source for a given baseline length if it is aligned with the source major axis than the minor axis. In order to indicate the magnitude of this effect, we have plotted the theoretical visibilities for circular sources with diameters equal to the major and minor axes of the fitted elliptical model.
We also observed the SiO maser emission at high spectral resolution with several scans in spectral-line mode interspersed among the dual-band continuum observations. We covered the entire SiO line emission with a bandwidth of 3.125 MHz and used 64 spectral channels, which provided a velocity resolution of 0.34 km s-1. The line data were self-calibrated by choosing a channel with strong emission as a reference, and the resulting phase and amplitude corrections were applied to the other channels. Because the maser emission was very strong ( Jy), we did not require bandpass calibration. From the line data we produced a spectral-line data cube, which we restored with a 20 mas FWHM Gaussian beam, taking advantage of the high signal-to-noise ratio and nearly point-like emission in each spectral channel to “super-resolve” by a factor of about two.
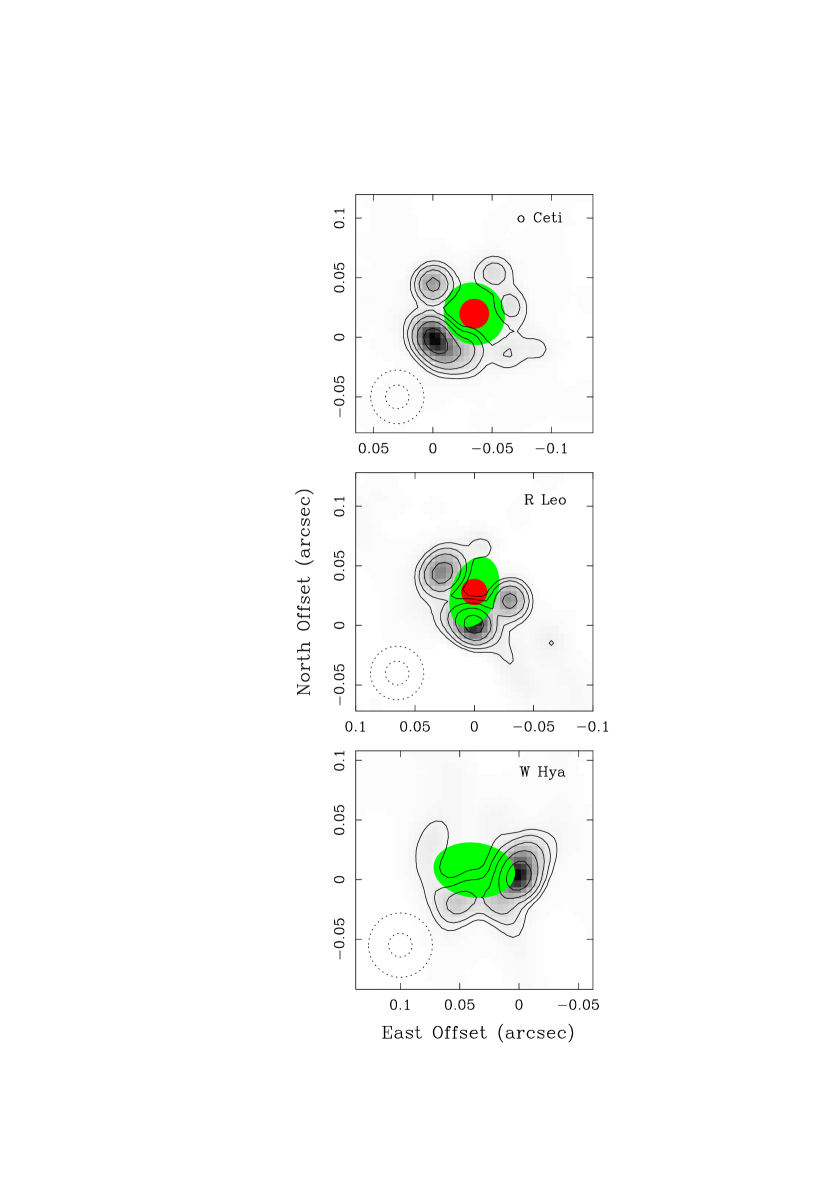
The continuum emission (in the 50 MHz A-C IF pair) and maser emission (in the 1.563 MHz B-D IF pair), which were observed simultaneiously, are automatically aligned by the calibration procedures to an accuracy of better than 1 mas. In order to align the maser emission from the spectral-line data, not observed simultaneously, with the continuum, we performed the following steps: 1) we produced a pseudo-continuum map from the line data, using spectral channels covering the velocities that were within the 1.563 MHz passband of the dual-band continuum setup; 2) we overlaid the pseduo-continuum map and on the map from the 1.563 MHz passband; and 3) we translated the pseduo-continuum map to achieve the best alignment by eye. Since the maps were nearly identical and contained unresolved spots with high signal-to-noise ratios, alignment of the continuum and maser emission to better than mas (or 10% of the restoring beam) was achieved. Based on this cross-registration, we show velocity-integrated SiO maser emission superposed on the continuum emission of the stars in Fig. 2. In order to avoid introducing excess noise in the velocity-integrated SiO maser maps, we set the flux density of all pixels with less than 1 Jy beam-1 to zero before summing the emission of the individual spectral channels.
3 Radio Photospheric Characteristics
3.1 Diameters
We clearly resolve the radio photospheres of all three stars. For Ceti, we find a nearly circular image with a uniform-disk diameter of about 52 mas (see Table 2). At a distance of 110 pc, based on the Period-Luminosity (PL) relation of Feast et al. (1989) and the photometry of Haniff, Scholz & Tuthill (1995), this corresponds to a radio diameter of 5.7 AU. Throughout this paper, we adopt the PL-based distances, which appear to be more accurate than Hipparcos parallaxes for these large, variable and irregularly bright stars (Reid & Menten, 1997a). We measure a mean diameter of 50 mas for R Leo, corresponding to 5.5 AU at a distance of 110 pc. W Hya displays a mean angular diameter of 58 mas, which at 95 pc distance implies a physical diameter of 5.5 AU. Thus, the radio-frequency mean diameters of all three stars are remarkably similar, averaging close to 5.6 AU.
The diameters of the radio photospheres are similar to those measured in the visible and infrared in narrow bands that contain strong molecular opacity. For example, in a 10-m-wide band centered at 710 m containing strong TiO absorption, Haniff, Scholz & Tuthill (1995) find (uniform-disk) angular diameters of 53, 45 and 66 mas for Ceti, R Leo and W Hya, respectively. Similarly, Perrin et al. (2004) infer a “molecular layer” diameter of 52 and 50 mas for Ceti and R Leo, respectively. Generally it is difficult to “see” through the molecular photosphere and down to . Using narrow bands placed in spectral regions with minimal molecular opacity, Perrin et al. (2004) find stellar diameters of 26 mas for Ceti and 22 mas for R Leo. Model-fit Rosseland mean diameters from observations using broader bands yield diameters that are % larger (Woodruff et al., 2004; Fedele et al., 2005). Thus, the radio and molecular layers occur at radii of , adopting the narrow-band stellar diameters.
3.2 Mira Binary
Mira A is Ceti, an M-type giant, and Mira B is possibly a low-mass main-sequence star (Ireland et al., 2007) or a white dwarf. Matthews & Karovska (2006) detected both stars in the Mira binary with the VLA. They found the 43 GHz flux density of Mira B is weaker than that of Ceti by a factor of . We well resolve the binary, which has a projected separation of mas, and fail to detect Mira B. Our limits are 0.4 and 0.7 mJy beam-1 for untapered and tapered maps with (geometric mean) interferometer beams of 50 and 250 mas, respectively. Were the radio emission from Mira B unresolved and at the mJy level seen by Matthews & Karovska, we would have detected it. Since the Matthews & Karovska B-configuration observations at 43 GHz had a beam size comparable to our tapered map, it appears that angular resolution alone cannot explain our failure to detect Mira B and that it must be time variable. Since we well resolve ( beams) the binary and Mira B is not detected, our Ceti results should not be significantly affected by the secondary.
3.3 Asymmetries
While Ceti’s image is circular to within %, we detect non-circular radio photospheres for R Leo and W Hya. The differences between the major and minor axes are significant at about the level. We are reasonably confident that the non-circular structures do not come from instrumental limitations for several reasons: 1) for R Leo the intrinsic interferometer beam is nearly round and for W Hya the image is elongated nearly perpendicular to the intrinsic interferometer beam; 2) analysis of the data both in the image and (u,v)-plane yield similar results; and 3) the plots of visibility versus (u,v)-distance for the elliptically shaped stars show scatter larger than expected for a circular source, but consistent with an elliptical source.
3.4 Physical Conditions
Both Ceti and R Leo have (uniform-disk) brightness temperatures near 1650 K. These temperatures are close to those expected for the radio photospheres (Reid & Menten, 1997a). We measure a somewhat higher brightness temperature of K for W Hya. Since the collisional ionization of metals, and hence the H- free-free opacity, is strongly temperature dependent below 2500 K, the higher measured brightness temperature of W Hya might suggest that the total density in the W Hya photosphere is lower than in Ceti or R Leo. However, the uncertainties in brightness temperature are fairly large, owing predominantly to the squared-dependence on the uncertainty in the size measurement, and all three stars could have similar temperatures. Our temperature measurements are consistent, within uncertainties, with our earlier measurement of brightness temperature of W Hya of K at a lower frequency of 22 GHz (Reid & Menten, 1997a).
The brightness temperatures of the radio photospheres of Ceti and R Leo are also similar to those inferred by Perrin et al. (2004) of about 2000 and 1600 K for the molecular layers of these stars. Spectroscopic observations of H2O in the infrared also indicate temperatures and densities close to those we previously measured and modeled. Matsuura et al. (2002) model their 2.5 to 4.0 m ISO telescope data with a hot (2000 K) layer close to the stellar photosphere (between 1 and 2 ) and a cool (1400 to 1000 K) layer between 2.5 and 4 . The total hydrogen densities in these layers are estimated to be cm-3. These layers roughly straddle the radio photosphere where we have previously found temperatures of about 1600 K and hydrogen densities of cm-3 (Reid & Menten, 1997a). Since both the radii, temperatures and densities measured in the radio and infrared agree, this provides added confidence in both measurements.
4 SiO Masers
The SiO masers in Ceti, R Leo and W Hya form partial rings with radii of about 40, 35 and 41 mas, respectively (Fig. 2). These radii were measured by visually overlaying circles of varying radii centered on the stellar continuum position and are probably accurate to %, limited mostly by the lack of complete maser rings. These partial rings are consistent with, but perhaps slightly larger than, the Very Long Baseline Array (VLBA) results by Cotton et al. (2004), who find radii at different epochs ranging from 30–38, 26–30, and 42 mas for Ceti, R Leo and W Hya, respectively, for the SiO v, J=1–0 transition . The differences in ring radii between our VLA images, which are sensitive to lower brightness emission, and the VLBA results, which have higher angular resolution and use a different approach to define the ring radii, are small. We note that Diamond & Kemball (2003), in their extensive VLBA monitoring of TX Cam, find lower brightness SiO masers radially outside of the brightest masers.
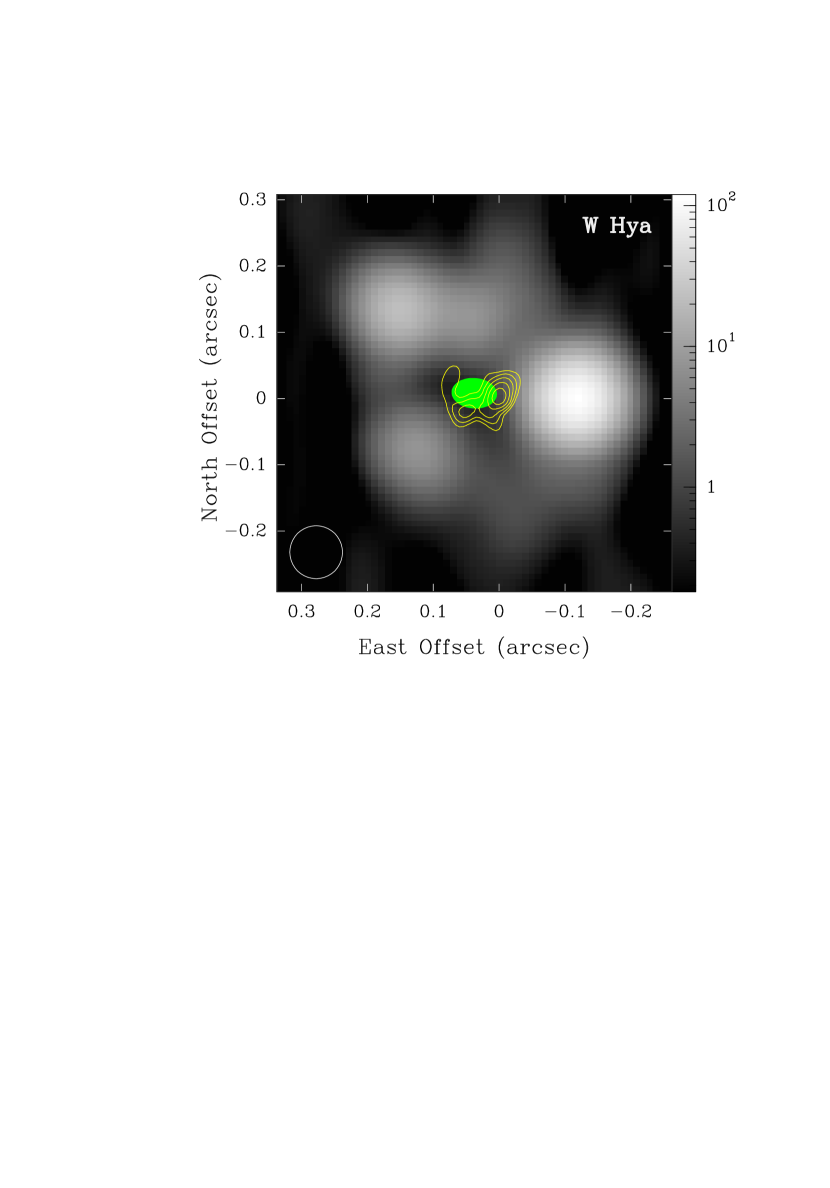
When we convert our ring diameters from angular to linear units, we find radii of 4.4, 3.8 and 3.9 AU, respectively. Thus, these three stars show very similar SiO masing radii close to 4 AU. Previous observations have also detected partial rings of SiO masers in Mira-like stars (Miyoshi et al., 1994; Greenhill et al., 1995; Boboltz & Marvel, 2000; Diamond & Kemball, 2003) and have usually assumed that the stars were near the center of the rings. However, for the first time, we are able to demonstrate that the maser rings are precisely centered on the stars. These results nicely complement our previous result that the H2O masers in W Hya also exhibit a partial ring and are precisely centered on the stellar continuum emission (Reid & Menten, 1990). We plot the integrated H2O maser emission from W Hya in Fig. 3, superposed on its SiO maser and radio continuum emission. The H2O maser ring had a radius of mas, which is about 3.7-times that of the SiO masers.
The simplest interpretation for the SiO masers is that they form in a spherical shell near radii of about 3 . If one adopts the somewhat smaller SiO radii from VLBA maps, which sample the higher brightness masers, and the larger stellar radii, from Rosseland mean opacities, the maser shells would have radii closer to 2 . The inner boundary of the SiO masers is determined either by densities cm-3, leading to thermalization of the level populations (Lockett & Elitzur, 1992), or by high radio-continuum opacity from H- free-free interactions (Reid & Menten, 1997a). The outer boundary occurs when SiO densities become too low for strong maser amplification. Note that in addition to the rapid decrease in total density with increasing radius in the extended atmosphere, the SiO density can fall even faster owing to silicate grain formation.
Proper motions of SiO masers in TX Cam by Diamond & Kemball (2003) indicate complex dynamics. Expansion at a speed of km s-1, where is the star’s distance, is the dominant motion. However, some SiO maser spots are also observed to move inwards at a few km s-1, suggesting a possible large-scale convective structure. Diamond & Kemball (2003) adopt a distance based on the period-luminosity and photometry compiled by Olivier, Whitelock & Marang (2001). An alternative distance estimate could come from the radius of the SiO maser ring, since we find all three of our stars have a ring radius near 4 AU. Adopting this ring radius for TX Cam, the measured mean angular radius of 16 mas gives a distance of 250 pc. At this distance the dominant SiO expansion speed would only be 4.5 km s-1. In any event, there are no indications of pervasive, fast-moving ( km s-1) shocks in the SiO masing region.
5 Discussion
A simple, consistent picture of the inner envelopes of oxygen-rich Mira variables is emerging from radio and infrared observations. Radio observations of stars like Ceti, R Leo and W Hya provide data which constrains the kinematics and physical conditions between and . Radio continuum emission comes predominantly from H- free-free interactions. An optical depth of unity is observed at and requires a temperature and density of K and cm-3, respectively (Reid & Menten, 1997a).
The radio photosphere corresponds very closely to the molecular layer, identified at infrared wavelengths. The molecular layer can be directly observed in lines of H2O and CO (Haniff, Scholz & Tuthill, 1995; Matsuura et al., 2002; Perrin et al., 2004). As the star cools cyclically, this region can become nearly opaque at visible wavelengths, owing to metallic oxide formation. This leads to dramatic changes in visible light as the temperature in the molecular photosphere at can be low enough for visible light to “fall off” the Wien side of the black body spectrum (Reid & Goldston, 2002).
SiO maser emission surrounds the radio/molecular layer and appears as partial rings with radii of to . These rings sometimes display significant ellipticity as, for example, shown in TX Cam by Diamond & Kemball (2003). SiO masers trace both outwardly and inwardly moving material, possibly indicative of large scale convection. Temperatures and densities inferred from SiO masers are K and cm-3. SiO maser proper motions suggest that outside of shocks are mostly damped and propagate at km s-1. This complements a similar conclusion, that strong, fast shocks are not found in the underlying radio photosphere, based on the observed nearly constant radio light curves (Reid & Menten, 1997a, b). Thus, while radio data indicate a dynamic region between and , there are no signs of strong shocks heating large portions of the atmosphere to K near as in some models of these stars (Willson, 2000).
The “radio photospheres” of Ceti and W Hya appear somewhat elongated. The non-circular structure we detect in the radio photospheres of two AGB stars may be of significance in understanding the highly elongated structures seen in planetary nebulae, following a post-AGB phase. Clearly second epoch images of the radio photospheres, after several pulsation cycles, would be very interesting. If the non-circular structures change significantly, either in shape or orientation, this would suggest a (non-radial) pulsation origin. Alternatively, should the structures be stable over time, this would suggest a possible rotational or magnetic field origin, which may play a role in creating asymmetric structures in planetary nebulae.
References
- Baars et al. (1977) Baars, J. W. M., Genzel, R., Pauliny-Toth, I. I. K & Witzel, A. 1977, A&A, 61, 99
- Boboltz & Marvel (2000) Boboltz, D. A. & Marvel, K. B. 2000, ApJ, 545, L149
- Cotton et al. (2004) Cotton, W. D. et al. 2004, A&A, 414, 275
- Dalgarno & Lane (1966) Dalgarno, A. & Lane, N. F. 1966, ApJ, 145, 623
- Diamond & Kemball (2003) Diamond, P. J. & Kemball, A. J. 2003, ApJ, 599, 1372
- Feast et al. (1989) Feast, M. W., Glass, I. S., Whitelock, P. A. & Catchpole, R. M. 1989, MNRAS, 241, 375
- Fedele et al. (2005) Fedele, D., Wittkowski, M., Paresce, F., Scholz, M., Wood, P. R. & Ciroi, S. 2005, A&A, 431, 1019
- Greenhill et al. (1995) Greenhill, L. J., Colomer, F., Moran, J. M., Backer, D. C., Danchi, W. C. & Bester, M. 1995, ApJ, 449, 365
- Haniff, Scholz & Tuthill (1995) Haniff, C. A., Scholz, M. & Tuthill, P. G. 1995, MNRAS, 276, 640
- Ireland et al. (2007) Ireland, M. J. et al. 2007, ApJ, 662, 651
- Lockett & Elitzur (1992) Lockett, P. & Elitzur, M. 1992, ApJ, 399, 704
- Matthews & Karovska (2006) Matthews, L. D. & Karovska, M. 2006, ApJ, 637, L49
- Matsuura et al. (2002) Matsuura, M., Yamamura, I., Cami, J., Onaka, T. & Murakami, H. 2002, A&A, 383, 972
- Miyoshi et al. (1994) Miyoshi, M., Matsumoto, K., Kameno, S., Takaba, H. & Iwata, T. 1994, Nature, 371, 395
- Olivier, Whitelock & Marang (2001) Olivier, E. A., Whitelock, P. & Marang, F. 2001, MNRAS, 326, 490
- Perrin et al. (2004) Perrin, G. et al. 2004, A&A, 426, 279
- Reid & Goldston (2002) Reid, M. J. & Goldston, J. E. 2002, ApJ, 568, 931
- Reid & Menten (1990) Reid, M. J. & Menten, K. M. 1990, ApJ, 360, L51
- Reid & Menten (1997a) Reid, M. J. & Menten, K. M. 1997a, ApJ, 476, 327
- Reid & Menten (1997b) Reid, M. J. & Menten, K. M. 1997b, Ap&SS, 251, 41
- Reid & Menten (2003) Reid, M. J. & Menten, K. M. 2003, in Mass-losing pulsating stars and their circumstellar matter, Astrophysics and Space Science Library, Vol. 283, eds. Y. Nakada, M. Honma and M. Seki. (Kluwer Academic Publishers, Dordrecht), p. 283
- Willson (2000) Willson, L. A. 2000, ARA&A, 38, 573
- Woodruff et al. (2004) Woodruff et al. 2004, A&A, 421, 703
| Star | P.A. | Continuum RMS Noise | Line RMS Noise | ||
|---|---|---|---|---|---|
| (mas) | (mas) | (deg.) | (mJy) | (mJy) | |
| Ceti ……… | 53 | 39 | 0.13 | 10 | |
| R Leo ……… | 61 | 39 | 0.14 | 15 | |
| W Hya ……… | 81 | 37 | 0.30 | 20 |
| Star | Distance | Opt. Phase | P.A. | SiO Radius | ||||
|---|---|---|---|---|---|---|---|---|
| (pc) | (mas) | (mas) | (deg.) | (mJy) | (K) | (mas) | ||
| Ceti ……… | 0.05 | |||||||
| R Leo ……… | 0.55 | |||||||
| W Hya ……… | 0.25 |
Note. — Distances are from Haniff, Scholz & Tuthill (1995) based on the PL relation of Feast et al. (1989). Stellar major, , and minor, , diameters and East-of-North position angles, P.A., are from best-fit, uniform-brightness (), elliptical-disk models. Flux density, , uncertainties do not include a roughly % uncertainty in the absolute flux density scale. SiO maser shell radii are estimated from the brightness peaks in Fig. 2.