Constraining supersymmetry from the satellite experiments
Abstract
In this paper we study the detectability of -rays from dark matter annihilation in the subhalos of the Milky Way by the satellite-based experiments, EGRET and GLAST. We work in the frame of supersymmetric extension of the standard model and assume the lightest neutralino being the dark matter particles. Based on the N-body simulation of the evolution of dark matter subhalos we first calculate the average intensity distribution of this new class of -ray sources by neutralino annihilation. It is possible to detect these -ray sources by EGRET and GLAST. Conversely, if these sources are not detected the nature of the dark matter particls will be constrained by these experiments, depending, however, on the uncertainties of the subhalo profile.
I introduction
In the third EGRET catalog 3cat unidentified -ray sources accounted for more than a half of the discrete sources detected by EGRET. Despite a great effort, most of them can not be associated with the known sources detected at low energies up to now. Most of the efforts in identifying these sources focused on the Galactic counterparts, such as young pulsars Hobbs , microquasars paredes , supernova remnants torres . At the same time, multiwavelength searches continue to look for counterparts in the -ray sources, such as blazars, supernova remnants and pulsars fegan . There are recent theoretical works trying to explain the unidentified sources as annihilating dark matter clumps within the Milky Way (MW) flix . These efforts try to solve the nature of dark matter.
The existence of cosmological dark matter has been firmly established by a multitude of observations, such as the observations of the rotation curves in spiral galaxies and velocity dispersion in elliptical galaxies, the X-ray emission and peculiar velocities of galaxies in the clusters of galaxies, the weak lensing effects, all indicating much steeper gravitational potentials than those inferred from the luminous matter. However, the nature of the non-baryonic dark matter is still unknown and remains one of the most outstanding puzzles in particle physics and cosmology.
Among a large amount of theoretical candidates, the most attractive scenario involves the weakly interacting massive particles (WIMPs). An appealing idea is that the WIMPs form the thermal relics of the early universe and naturally give rise to the relic abundance in the range of the observed values. The WIMPs are well motived theoretically by the physics beyond the standard model to solve the hierarchical problem between the weak scale and the Planck scale. In particular, the minimal supersymmetric extension of the standard model (MSSM) provides an excellent WIMP candidate as the lightest supersymmetric particle, usually the lightest neutralino, which are stable due to R-parity conservation jungman . The cosmological constraints on the supersymmetric (SUSY) parameter space have been extensively studied in the literature csusy .
The WIMPS can be detected on the present running or future experiments, either directly by measuring the recoil energy when WIMP scatters off the detector nuclei direct or indirectly by observing the annihilation products of the WIMPs, such as the antiprotons, positrons, -rays or neutrinos indirect . The rate of the WIMP annihilation is proportional to the number density square of the dark matter particles. Therefore the searches for the annihilation signals should aim at the regions with high matter densities, such as at the galactic center gc or the nearby subhalos subhalo ; kou ; bi . The existence of a wealth of subhalos throughout the galaxy halos is a generic prediction of the CDM paradigm of structure formation in the Universe. High resolution simulations show that for CDM scenario the large scale structure forms hierarchically by continuous merging of smaller halos and as the remnants of the merging process about 10% to 15% of the total mass of the halo is in the form of subhalos tormen98 ; klypin99 ; moore99 ; ghigna00 ; springel01 ; zentner03 ; delucia04 ; kravtsov04 . At the center of the subhalos there are high mass densities and therefore they provide good sites for the search of WIMP annihilation products.
However, the analysis in Refs. flix ; population shows that it seems most of the EGRET unidentified -ray sources are not produced by the dark matter annihilation. In flix by comparing the cumulative luminosity function of subhalos and EGRET unidentified sources the authors found at most unidentified sources are possibly subhalos. However, location coincidence and variability cut even exclude further of these candidates flix . In population assuming a similar population of subhalos between the Milky Way and M31 and using the upper limit of -rays from M31 the authors found it is highly unlikely that a large fraction of these unidentified EGRET sources can be from subhalos. Improving the upper limit may finally exclude this possibility population .
The strong constraints on the possible detectable subhalos from these works flix ; population will constrain the properties of dark matter particles. In the present work we assume that neutralino forms dark matter and work in the frame of supersymmetric extension of the standard model. Assuming that none of the unidentified EGRET sources is from dark matter annihilation we will study how the properties of neutralino are constrained resorting to the numerical simulation result of dark matter clumps distribution. The non-detection of subhalos finally shows a constraint on the SUSY parameter space.
The next generation satellite based experiment, GLAST glast , will greatly improve the sensitivity of EGRET. More -ray sources will be detected by GLAST. Detectability of -rays from the subhalos by GLAST has been studied in literature kou ; peirani ; kou06 ; pieri ; conrad ; kuhlen ; bertone ; baltz06 . Once such sources are detected, the follow-up study of the sources may measure the spectrum of the annihilated -rays or even detect the line emission baltz06 . These measurement will finally give strong implications on the properties of dark matter. However, there are also possibilities of null result for such searches, similar to the EGRET result or the null result of direct detection even though the direct detection has continuously improved sensitivities. In this case we would like to study how supersymmetry would be constrained.
It is well known that the flux of gamma rays from the neutralino annihilation in a clump is given by
| (1) |
where is annihilation cross section times relative velocity, is the differential flux in a single annihilation, is the mass of the dark matter particle, is the distance from the detector to the source. The flux depends on both the distribution of the dark matter and the particle nature of dark matter.
In the next section we first give the intensity distribution of the subhalo -ray sources according to the N-body simulation results. Then in Sec. III we present the constraints on the SUSY parameter space from non-detection of the subhalo -ray sources by EGRET and GLAST. We finally give a conclusion in Sec. IV.
II distribution of subhalos and their -ray intensities
In this section we first present some simulation results about the subhalos and then we calculate the intensities of the MW subhalos as -ray sources by neutralino annihilation.
N-body simulations show that the radial distribution of substructures is generally shallower than the density profile of the smooth background due to the tidal disruption of substructures which is most effective near the galactic center diemand . The relative number density of subhalos is approximately given by an isothermal profile with a core diemand
| (2) |
where is the relative number density at the scale radius , with being about times the halo virial radius . The result given above agrees well with that in another recent simulation by Gao et al. gao .
The differential mass function of substructures has an approximate power law distribution, , with diemand ; gao ; diemand07 . In Ref. diemand ; diemand07 both the cluster and galaxy substructure cumulative mass functions are found to be an power law, , with no dependence on the mass of the parent halo. A slight difference is found in a simulation by Gao et al. gao that the cluster substructure is more abundant than galaxy substructure since the cluster forms later and more substructures have survived the tidal disruption. The mass function for both scales are well fitted by . Taking the power index of the differential mass function greater than makes the fraction of the total mass enclosed in subhalos insensitive to the mass of the minimal subhalo we take. The mass fraction of subhalos estimated in the literature is around between 5 percent to 20 percent ghigna00 ; springel01 ; stoehr ; diemand07 . In this work we will take the differential index of and the mass fraction of substructures as 10 percent.
To calculate the -ray intensities from the dark matter clumps we first realize a MW-like halo with a population of subhalos due to the subhalo distribution function from simulation, which is given above. The mass of the substructures are taken randomly between , which is the lowest substructure mass the present simulations can resolve cut , and the maximal mass . The maximal mass of substructures is taken to be since the MW halo does not show recent mergers of satellites with masses larger then . The -ray flux is quite insensitive to the minimum subhalo mass since the flux from a single subhalo scales with its mass kou ; aloisio ; diemand07 .
However, due to the finite spatial resolution of the N-body simulations the distribution in Eq. (2) is an extrapolation of the subhalo distribution at large radius. The formula underestimates of the tidal effect which destroys most substructures near the Galactic Center (GC). We take the tidal effects into account under the “tidal approximation”, which assumes that all mass beyond the tidal radius is lost in a single orbit while keep its density profile inside the tidal radius intact.
The tidal radius of the substructure is defined as the radius at which the tidal forces of the host exceeds the self gravity of the substructure. Assuming that both the host and the substructure gravitational potential are given by point masses and considering the centrifugal force experienced by the substructure the tidal radius at the Jacobi limit is given by hayashi
| (3) |
where is the distance of the substructure to the GC, refers to the mass within .
The substructures with will be disrupted. The mass of a substructure is recalculated by subtracting the mass beyond the tidal radius in realizing the MW-like halos. After taking the tidal effects into account we find the substructures near the GC are disrupted completely.
II.1 concentration parameter
We adopt both the NFW nfw97 ; nfws and Moore moore ; moores profiles for the subhalos in our calculation, which can be written in a general form as
| (4) |
where and are the scale density and scale radius respectively. and are for the NFW and Moore profiles respectively.
The free parameters and can be determined by the mass and concentration parameter of the subhalo. The concentration parameter is defined as
| (5) |
where is the virial radius of the halo and is the radius at which the effective logarithmic slope of the profile is , i.e., . For the NFW profile we have , while for the Moore profile we have .
The concentration parameter is a crucial parameter in determining the ray fluxes from subhalos. From the definition of the concentration parameter in Eq. (5) and the annihilation flux in Eq. (1) we can easily get that the annihilation flux from a clump is proportional to with a flat function of . Therefore the annihilation flux is very sensitive to the concentration parameter. The concentration parameter is obtained by N-body simulations. However, due to the finite resolution of N-body simulations, numerical convergence has not been established, especially for the evolution of subhalos. Adopting different models the predicted detectable number of subhalos at GLAST (at 5 for 1 year exposure) spans from by Koushiappas et al. kou to at most about by Baltz et al. baltz06 . Recently Pieri et al. tried to classify different cases by modeling the subhalos concentration parameter and found the detectable number of subhalos at GLAST ranges from to pieri for different models they adopted. Another way for this kind of study is directly based on the simulation result, such as in the recent work by Diemand et al. diemand07 . In this work we will adopt different analytic models or the fit formulas based on simulation results about subhalos in the literature to discuss their detectability. Uncertainties of the simulation results are thus included in our study.
We first introduce a semi-analytic model to determine concentration parameter given by Bullock et al. bullock01 which is built based on their simulation result. In the model, at an epoch of redshift a typical collapsing mass is defined by , where is the linear rms density fluctuation on the comoving scale encompassing a mass , is the critical overdensity for collapsing at the spherical collapse model. The model assumes the typical collapsing mass is related to a fixed fraction of the virial mass of a halo . The concentration parameter of a halo with virial mass at redshift is then determined as . Both and are constants to fit the numerical simulations. A smaller corresponds to a smaller collapsing mass and early collapsing epoch when the Universe is denser and therefore a larger concentration parameter. Fig. 1 plots the concentration parameter at as a function of the virial mass of a halo according to the Bullock modelbullock01 .
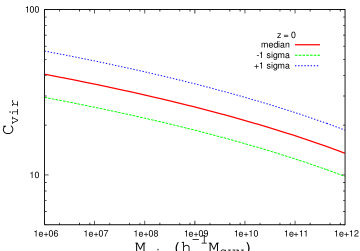
From Fig. 1 we can see that between the masses an experiential formula reflect the simulation result accurately. We expect that this power law relation should be very well followed, since subhalos form early at the epoch when the Universe is dominated by matter with approximate power-law power spectrum of fluctuationsbullock01 .
In the literature another widely adopted semi-analytical model for the concentration parameter is given by Eke, Navarro and Steinmetz (ENS) eke . We also adopt the ENS model for the CDM model with . The other two models we adopted are the simulation results by Reed et al reed and that by Bullock for the subhalos in dense environment bullock01 . We will show that these models predict very different annihilation fluxes. Especially for subhalos within the dense environment, simulation indicates it may have greater concentration than these of isolated halos bullock01 and therefore lead to larger annihilation flux.
II.2 -ray intensity of the subhalos
Once the profile parameters of each subhalo are determined and, in each realization of the MW-like halos, the distribution of subhalos is also known we can calculate the -ray fluxes from these subhalos. Then we can plot the number of sources as function of their intensities. By realizing one hundred such MW sized halos we give the averaged number of sources as a function of their intensities. We have fixed the property of neutralino by requiring the -ray flux of from the GC assuming a NFW profile. Fixing flux from the GC actually gives the relative intensities between the GC and each subhalo.
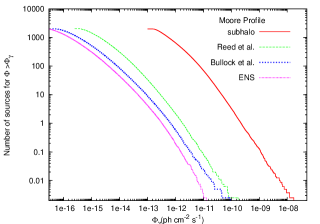
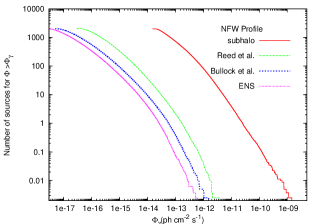
Fig. 2 gives the cumulative number of subhalos emitting -rays with fluxes greater than a value . In the left panel we plot the results for the Moore profile while the right panel is for the NFW profile. From Fig. 2 we can easily read the expected number of detectable subhalos if the sensitivity of a detector is given with the same field of view. For example, the sensitivity of GLAST at for year exposure reaches Morselli . For comparison we adopt the same particle factor as Pieri et al. pieri , which is about orders of magnitude than our particle factor adopted here and get the detectable subhalo number in NFW profile is from to . The maximal detectable number subhalos predicted by Pieri et al pieri is only about , however, which is given in a different scenario from the ‘subhalo’ case here. Our result is consistent with the result by Baltz et al. baltz06 . Even for this scenario and with the optimistic particle factor we have only about detectable subhalos at EGRET, whose sensitivity can only reach .
Fig. 2 shows that there is a large discrepancy for predictions based on different models. Especially the ‘subhalo’ model gives much greater prediction. The reason is directly related with the large concentration parameters for the subhalo scenario. It should be noted that the other three models actually describe distinct halos with small masses. A qualitative simulation result about the concentration parameter is that it is determined by the halo collapse time, as shown in the Bullock model. The reason of large concentration parameter for ‘subhalo’ is that in dense environment halos tend to collapse much earlier bullock01 . Tidal stripping may also lead to stronger mass dependence of concentration on the subhalo mass. Another reason is that a high density environment likely leads to extreme collapse histories of subhalos and frequent merger events which affect the final concentration (For more discussions see bullock01 ).
II.3 detector sensitivities
Before going on to the next section we first discuss the sensitivities of EGRET and GLAST. The detectability of a signal is defined by the ratio of the signal events to the fluctuation of the background. Since the background follows the Poisson statistics, its fluctuation has the amplitude proportional to . The significance of the detection is quantified by .
The signal events are given by
| (6) |
where is the fraction of signal events within the angular resolution of the instrument and the integration is for the energies above the threshold energy , within the angular resolution of the instrument and for the observational time. Generally the effective area is a function of energy and zenith angle. The is the flux of -rays from DM annihilation. We take GeV for both EGRET and GLAST. The EGRET has angular resolution of while GLAST has much better angular resolution of .
The corresponding expression for the background is similar to Eq. (6). Adopting the measured background flux , which is expected to get much better precision by GLAST and PAMELA, and if we know the effective area of the detectors and the identification efficiency for the charged particles (of hadronic and electronic background) and photons we can get the sensitivity of the detector bi . The ‘sensitivity’ means for some time exposure, for example, for one year, the minimal flux the source has in order to have a detection.
The sensitivity is not difficult to estimate for EGRET and GLAST, as given in bi . However, a careful simulation of the detector is beyond the present study. We will take the sensitivities of EGRET and GLAST directly from the literature Morselli , that is, and ph cm-2s-1 respectively. In Morselli the sensitivities of EGRET and GLAST are for one year of all sky survey with the diffuse gamma background from EGRET as , the typical background at high galactic latitudes. Considering background at different latitudes and longer obervation time will certainly change the sensitivity. However, the exact values of the detector sensitivities are not very important, since the constraints on the SUSY parameter space given in the following can be simply rescaled with the sensitivity. From Fig. 2 we can easily understand this: if sensitivity is lowered by a factor the particle factor can be probed is also lowered by the factor .
For GLAST we have calculated the similar result to that in Fig. 2 with better angular resolution. For Moore profile there is very small difference from Fig. 2, which means most annihilation takes place within the very small innermost region at the halo center. For the NFW profile there are difference for the number of the brightest -ray sources, which may be from subhalos near the Sun. For these nearby sources different angular resolution leads to different -ray fluxes when taking the NFW profile.
III constraints on the SUSY parameters
From the results in last section we can predict the number of -ray sources detectable in EGRET or GLAST for any SUSY models. Conversely, if no source is detected the SUSY models are constrained.
We will work in the frame of MSSM, the low energy effective description of the fundamental theory at the electroweak scale. By doing a random scan we give how the parameter space is constrained by these detectors.
However, there are more than one hundred free SUSY breaking parameters even for the R-parity conservative MSSM. A general practice in phenomenological studies is to assume some simple relations between the parameters and greatly reduce the number of free parameters. Following the assumptions in DarkSUSY darksusy we take seven free parameters in calculating dark matter production and annihilation, i.e., the higgsino mass parameter , the wino mass parameter , the mass of the CP-odd Higgs boson , the ratio of the Higgs Vacuum expectation values , the scalar fermion mass parameter , the trilinear soft breaking parameter and . All the sfermions have taken a common soft-breaking mass parameter ; all trilinear parameters are zero except those of the third family; the bino and wino have the mass relation, , coming from the unification of the gaugino mass at the grand unification scale. The simplification of the parameters actually does not decrease the generality of our discussion, since the seven parameters are the most relevant ones for our purpose. Including other parameters will not change our results much.
We perform a numerical random scan in the 7-dimensional supersymmetric parameter space using the package DarkSUSY darksusy . The ranges of the parameters are as following: , , , . The parameter space is constrained by the theoretical consistency requirement, such as the correct vacuum breaking pattern, the neutralino being the LSP and so on. The accelerator data constrains the parameter further from the spectrum requirement, the invisible Z-boson width and the branching ratio of darksusy .
The SUSY models are divided into two groups: those satisfy the constraint of dark matter relic density within 4 for mac and those do not satisfy, i.e., . The effect of coannihilation between the fermions is taken into account when calculating the relic density numerically. For the second group of models we assume the neutralino is produced by some nonthermal mechanism nonthermal to satisfy the observation.
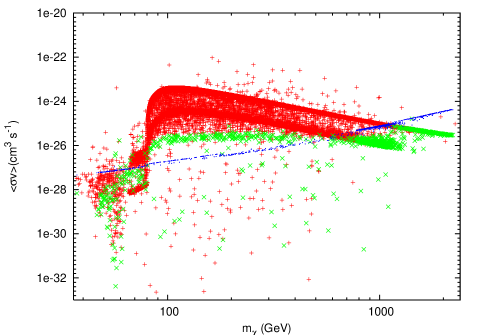
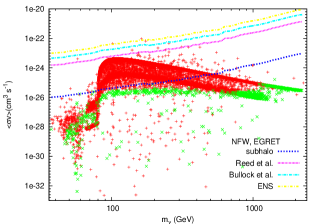
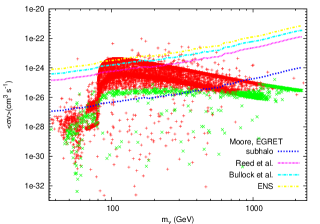
We then derive the constraints on the SUSY parameter space. Having known the sensitivities, according to the result in Fig. 2 we can get the detectable number of -ray sources in EGRET and GLAST for the SUSY model we take in last section. When we scan in the SUSY parameter space, we calculate the average detectable number of subhalos at EGRET and GLAST for each SUSY model. Then we scale the value of to a critical value that only one subhalo can be detected. The SUSY parameters with larger than the critical value of should be excluded by the experiments if null results are gotten. In Fig. 3 we show the critical values of according to the procedure above, which form a narrow strip. We would expect that the constraints should be divergent since the annihilation final states should be very different. However, according to Fig. 3 we know that the -ray spectra from different final states with same should be quite similar so that we get convergent result. In the following figures we use thick curves to represent these strips.
In Fig. 4 we show the constraints of EGRET on the SUSY parameter space if no unidentified -ray sources are from dark matter clumps. The left panel gives the constraints assuming NFW profile while the right is for the Moore profile. We notice for NFW profile only the ‘subhalo’ scenario can constrain the non-thermal SUSY models. For Moore profile the ‘subhalo’ scenario can also constrain a part of the thermal SUSY models. The other scenarios have quite weak constraints on the models by EGRET. For light neutralinos the constraints on are and for the NFW and Moore profiles respectively in the ‘subhalo’ scenario. For other models the constraints are and for NFW and Moore profiles respectively. We notice that the models with have a greater than those thermal models and therefore produce larger -ray fluxes. These models are easier to be ruled out.
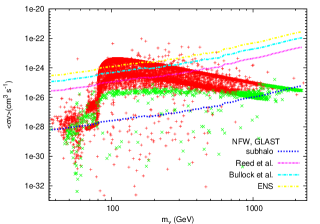
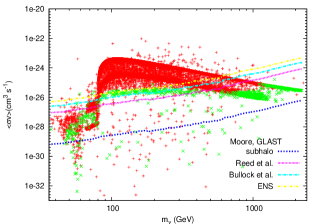
In Fig. 5 we show the similar constraints on SUSY by GLAST, which can give a much severer constraints on the parameter space than EGRET gives. For the Moore profile all scenarios can put constraint on the SUSY models. In this case a large fraction of the nonthermal parameter space will be ruled out. The constraints on for light neutralinos are now and for the NFW and Moore profiles respectively in the ‘subhalo’ scenario. For other models the constraints on reach and for NFW and Moore profiles respectively.
IV Discussions and Conclusion
Since the rate of dark matter annihilation is proportional to the DM density square, the Galactic center had been considered as the most promising site to search for the annihilation signals. The possibility of detecting dark matter annihilation from the GC has been extensively studied in literature gc . However, the GC is a very complex environment. The dark matter density profile near the GC is complicated due to the existence of baryonic matter and leads to difficulties in making theoretical calculations. For example, the SMBH can either steepen or flatten the slope of the DM profile at the innermost center of the halo depending on the evolution of the black hole ullio . Furthermore, the baryonic processes associated with the central supermassive black hole (SMBH) and the supernova remnant Sgr A∗ Zaharijas provide a strong -ray background, which has been detected by HESS gcg , to the signals of dark matter annihilation and make the detection very difficult Zaharijas . In Zaharijas it is found that in case of NFW profile GLAST can probe between and for light neutralinos, which is similar to the sensitivity by observing subhalos as shown in Fig. 5. However, considering the HESS detected -ray background only models with can be probed Zaharijas from the GC by GLAST. Therefore it becomes less sensitive to probe the GC than detecting subhalos now. For the case of Moore profile, sensitivity from GC observation is improved by two orders of magnitude, while only one order of magnitude improvement from subhalo observation. This means similar sensitivities will be achieved by observing the GC and subhalos.
On the contrary, subhalos provide a clean environment to search for the annihilation signals. Especially recent simulation shows that the DM profiles may not be universal. Smaller subhalos may have steeper central cusp reed ; jing . Reed et al. gave the cusp index for halos of to with a large scatter. In this case, if taking the GC the NFW profile and the subhalos the Moore profile, the -ray fluxes from the subhalos may even be greater than that from the GC.
We expect these sources can be detected by the satellite based experiments, such as EGRET and GLAST. Once such sources are detected we can learn a lot about the nature of dark matter particles by studying its luminosity and spectrum of the annihilation. However, study shows that most of the EGRET unidentified -ray sources should not be of dark matter origin flix ; population . In this work we study how the EGRET and GLAST can constrain the SUSY models if none of the subhalo -ray sources are detected in the two experiments.
We first realize one hundred MW-like halos with subhalos whose distribution is given according to the N-body simulation results. In each realization we calculate the -ray flux from the subhalos by fixing the particle factor. Then we give the average cumulative number of the subhalo -ray sources as function of their flux intensities. Once the sensitivity of detectors, such EGRET and GLAST, are known, we know the detectable number of this kind of -ray sources. By requiring the detectable number smaller than at EGRET and GLAST we put a constraint on the SUSY parameter space. Our result shows that the EGRET has already given a moderate constraint on the SUSY parameter space if we assume none of the unidentified -ray sources are from subhalos. The GLAST can greatly enhance the constraints. However, a large uncertainty comes from the simulation, especially the property of subhalos in a dense environment. Convergence of the subhalos property in the future high resolution simulation will lead to more precise constraint on the nature of dark matter particles.
Acknowledgements.
This work is supported by the NSF of China under the grant Nos. 10575111, 10773011 and supported in part by the Chinese Academy of Sciences under the grant No. KJCX3-SYW-N2.References
- (1) R.C. Hartman et al., Astrophys. J. 123, 79 (1999).
- (2) G. Hobbs et al., MNRAS 352, 1439 (2004).
- (3) J.M. Paredes, Mem. Soc. Astron. Ital. 73, 900 (2002).
- (4) D. F. Torres et al., Phys. Rep. 382, 303 (2003).
- (5) S.J. Fegan et al., Astrophys. J. 624, 638 (2005).
- (6) J. Flix, J.E. Taylor, M. Martinez, F. Prada, J. Silk , J. Cortina, astro-ph/0412419.
- (7) G. Jungman, M. Kamionkowski, K. Griest, Phys. Rept. 267, 195 (1996).
- (8) G. Belanger, F. Boudjema, S. Kraml, A. Pukhov, A. Semenov, Phys.Rev. D 73 (2006) 115007; A. Djouadi, M. Drees, J.-L. Kneur, JHEP 0603 (2006) 033; H. Baer, T. Krupovnickas, S. Profumo, P. Ullio, JHEP 0510 (2005) 020; H. Baer, A. Mustafayev, S. Profumo, A. Belyaev, X. Tata, JHEP 0507 (2005) 065; G. Belanger, S. Kraml, A. Pukhov, Phys. Rev. D72 (2005) 015003; B.C. Allanach, G.Belanger, F.Boudjema, A. Pukhov, JHEP 0412 (2004) 020; J. Ellis, K.A. Olive, Y. Santoso, V.C. Spanos, Phys. Lett. B 565 (2003) 176.
- (9) C. Munoz, Int. J. Mod. Phys. A. 19, 3093 (2004).
- (10) J. L. Feng, K. T. Matchev, F. Wilczek, Phys. Rev. D 63, 045024 (2001); G. Bertone, D. Hooper, J. Silk, Phys. Rept. 405, 279 (2005).
- (11) L. Bergstrom, P. Ullio, J. Buckley, Astropart. Phys. 9, 137 (1998); D. Horns, Phys. Lett. B 607, 225 (2005).
- (12) L. Bergström, J. Edsjö, P. Gondolo, P. Ullio, Phys. Rev. D 59, 043506 (1999); C. Calcaneo-Roldan, B. Moore, Phys.Rev. D 62, 123005 (2002); A.Tasitsiomi and A.V. Olinto, Phys.Rev. D 66, 083006 (2002); R. Aloisio, P. Blasi, A. V. Olinto, Astrophys. J. 601, 47 (2004); L. Pieri, E. Branchini, Phys. Rev. D 69, 043512 (2004); N.W. Evans, F. Ferrer, S. Sarkar, Phys.Rev. D 69, 123501 (2004).
- (13) S.M. Koushiappas, A.R. Zentner, T. P. Walker, Phys. Rev. D 69, 043501 (2004).
- (14) X.-J. Bi, Y.-Q. Guo, H.-B. Hu, X. Zhang, Nucl. Phys. B 775, 143 (2007); Xiao-Jun Bi, Nucl. Phys. B 741, 83 (2006).
- (15) G. Tormen, A. Diaferio, D. Syer, 1998, MNRAS, 299, 728.
- (16) A. Klypin, S. Gottlöber, A. V. Kravtsov, A. M. Khokhlov, 1999, ApJ, 516, 530; A. Klypin et al., ApJ, 522, 82 (1999).
- (17) B. Moore, S. Ghigna, F. Governato, G. Lake, T. Quinn, J. Stadel, P. Tozzi, 1999, ApJ, 524, L19.
- (18) S. Ghigna, B. Moore, F. Governato, G. Lake, T. Quinn, J. Stadel, 2000, ApJ, 544, 616.
- (19) V. Springel, S.D.M. White, G. Tormen, G. Kauffmann, MNRAS, 328, 726 (2001).
- (20) A. R. Zentner, J. S. Bullock, 2003, ApJ, 598, 49.
- (21) G. De Lucia, G. Kauffmann, V. Springel, S. D. M. White, B. Lanzoni, F. Stoehr, G. Tormen, N. Yoshida, 2004, MNRAS, 348, 333.
- (22) A. V. Kravtsov, O. Y. Gnedin, A. A. Klypin, 2004, ApJ, 609, 482.
- (23) J. M. Siegal-Gaskins, V. Pavlidou, A. V. Olinto, C. Brown, B. D. Fields, J. Phys. Conf. Ser. 60, 312 (2007).
- (24) A.Morselli et al., Proc. of the 32nd Rencontres de Moriond (1997).
- (25) S. Peirani, R. Mohayaee, J. A. de Freitas Pacheco, Phys. Rev. D 70, 043503 (2004).
- (26) S. M. Koushiappas, Phys. Rev. Lett. 97, 191301 (2006).
- (27) L. Pieri, G. Bertone, E Branchini, arXiv:0706.2101v2.
- (28) J. Conrad [GLAST-LAT Collaboration], arXiv:0706.0852.
- (29) M. Kuhlen, J. Diemand, P. Madau, arXiv:0704.0944.
- (30) G. Bertone, T. Bringmann, R. Rando, G. Busetto, A. Morselli, astro-ph/0612387.
- (31) E. A. Baltz, J. E. Taylor, L. L. Wai, arXiv:astro-ph/0610731v2.
- (32) J. Diemand, B. Moore, J. Stadel, MNRAS 352, 535 (2004).
- (33) L. Gao, S.D.M. White, A. Jenkins, F. Stoehr, V. Springel, MNRAS 355, 819 (2004).
- (34) J. Diemand, M. Kuhlen, P. Madau, Astrophys. J. 657, 262 (2007).
- (35) F. Stoehr, S.D.M. White, V. Springle, G. Tormen, N. Yoshida, MNRAS, 345, 1313 (2003).
- (36) The physical cutoff of the minimal substructure is given in A. M. Green, S. Hofmann and D. J. Schwarz, JCAP 0508, 003 (2005); MNRAS 353, L23 (2004); S. Hofmann, D. J. Schwarz and H. Stocker, Phys. Rev. D 64 083507 (2001).
- (37) R. Aloisio, P. Blasi, A. V. Olinto, Astrophys.J. 601, 47 (2004).
- (38) E. Hayashi, J. F. Navarro, J. E. Taylor, J. Stadel, T. Quinn, Astrophys.J. 584, 541 (2003).
- (39) J. F. Navarro, C. S. Frenk, and S. D. M. White, Mon. Not. R. Astron. Soc. 275, 56 (1995); J. F. Navarro, C. S. Frenk, and S. D. M. White, Astrophys. J. 462, 563 (1996); J. F. Navarro, C. S. Frenk, and S. D. M. White, Astrophys. J. 490, 493 (1997).
- (40) A. Huss, B. Jain, M. Steinmetz, Astrophys. J. 517, 64 (1999); J. E. Taylor, J. F. Navarro, Astrophys. J. 563, 483(2001); A. Dekel, J. Devor, G. Hetzroni, MNRAS 341, 326 (2003); A. Dekel, I. Arad, J. Devor, Y. Birnboim, Astrophys. J. 588, 680 (2003); C. Power, J. F. Navarro, A. Jenkins, C. S. Frenk, S. D. M. White, V. Springel, J. Stadel, and T. Quinn, MNRAS 338, 14 (2003).
- (41) B. Moore, F. Governato, T. Quinn, J. Stadel, & G. Lake, ApJ 499, 5 (1998); B. Moore, T. Quinn, F. Governato, J. Stadel, & G. Lake, MNRAS, 310, 1147 (1999).
- (42) S Ghigna, B. Moore, F. Governato, G. Lake, T. Quinn, J. Stadel, Astrophys. J. 544, 616 (2000); F. Governato, S. Ghigna, B. Moore, astro-ph/0105443; T. Fukushige, J. Makino, Astrophys. J. 557, 533 (2001); T. Fukushige, J. Makino, Astrophys. J. 588, 674 (2003).
- (43) J. S. Bullock, T. S. Kolatt, Y. Sigad, R. S. Somerville, A. V. Kravtsov, A. A. Klypin, J. R. Primack, A. Dekel, MNRAS 321, 559 (2001).
- (44) V.R. Eke, J.F. Navarro, M. Steinmetz, Astrophys. J. 554, 114 (2001).
- (45) D. Reed, F. Governato, L. Verde, J. Gardner, T. Quinn, J. Stadel, D. Merritt, G. Lake, MNRAS 357, 82 (2005), astro-ph/0312544.
- (46) A. Morselli, Int. J. Mod. Phys. A 17, 1829-1840 (2002).
- (47) P. Gondolo, J. Edsjo, P. Ullio, L. Bergstrom, M. Schelke, E.A. Baltz, JCAP 0407, 008 (2004), astro-ph/0406204.
- (48) M. Kamionkowski, arXiv:0706.2986v1.
- (49) R. Jeannerot, X. Zhang, R. Brandenberger, JHEP 9912, 003 (1999); W.B. Lin, D.H. Huang, X. Zhang, R. Brandenberger, Phys. Rev. Lett. 86, 954 (2001); M. Endo, F. Takahashi, Phys. Rev. D 74, 063502 (2006); G. Gelmini, P. Gondolo, A. Soldatenko, C. E. Yaguna, hep-ph/0610379.
- (50) P. Ullio, H.S. Zhao, Marc Kamionkowski, Phys. Rev. D 64, 043504 (2001).
- (51) Gabrijela Zaharijas, Dan Hooper, Phys.Rev. D73, 103501 (2006).
- (52) F. Aharonian, et al [H.E.S.S. Collaboration], Astron. Astrophys. 425, L13-L17 (2004), arXiv:astro-ph/0408145v2.
- (53) Y.P. Jing, Y. Suto, Astrophys. J. 529,L69 (2000); Astrophys. J. 574, 538 (2002).