Probing the Explosion Mechanism of Supernovae
by Radioactive Decay Gamma- and X-Rays
Abstract
Gamma- and X-rays resulting from radioactive decays provide a potentially powerful tool to investigate the explosion physics of supernovae, since the distribution and the amount of radioactive isotopes are strongly dependent on properties of the explosion. In this paper, expected features of these high energy emissions are presented for bipolar jet-induced explosion models, which are recently favored for very energetic supernovae and even for typical Type Ib/c supernovae. It is shown that combination of various observations, i.e., line-to-continuum ratio, photoelectric absorption cut-off energy, line profiles and luminosities, allows the unique determination of the explosion energy, the amount of radioactive 56Ni, the explosion geometry, and even the viewing orientation.
Subject headings:
gamma-rays and X-rays – radiative transfer – supernovae1. INTRODUCTION
At the supernova (SN) explosion, various heavy elements/isotopes are produced as a strong shock wave passes through the inner region of the progenitor star. Among these newly synthesized products, important is radioactive 56Ni (Clayton et al. 1969). The decay chain 56Ni 56Co 56Fe produces -ray lines with average energy per decay MeV (56Ni decay with an e-folding time of 8.8 days) or MeV (56Co decay with an e-folding time 113.7 days). These line -rays are degraded along their paths through the SN ejecta by pair production, compton scattering, and photoelectric absorption (e.g., Cassé & Lehoucq 1994 for a review). The absorbed energy is the source of the optical output of a SN in the case of Type Ib/c SNe (SNe Ib/c) (e.g., Maeda et al. 2003 for a review).
By looking at properties of these - and X-rays, it is expected that we can directly extract information on the distribution and the amount of 56Ni, which are closely related to the explosion mechanism. Such observations have been performed only for very nearby SN 1987A (Dotani et al. 1987; Sunyaev et al. 1987; Matz et al. 1988). Attempts to detect the high emission from distant SNe (e.g., at Mpc) have not been successful because of limited observational instruments in the past (Matz & Share 1990; Lichti et al. 1994; Morris et al. 1997; Leising et al. 1999). However, now that INTEGRAL and SUZAKU have been operated, and some new observatories are being planned (e.g., Takahashi et al. 2001), it is time to revisit theoretical prediction (e.g., McCray et al. 1987; Woosley et al. 1987; Shibazaki & Ebisuzaki 1988; Kumagai et al. 1989) taking into account recent developments in SN research, i.e., multidimensionality (see e.g., Maeda & Nomoto 2003, Maeda et al. 2006ab, and references therein).
Recently, multidimensional models for a supernova explosion become more and more popular. Especially, bipolar explosion models have been intensively studied in their explosion characteristics and nucleosynthetic features (e.g., Nagataki 2000; Maeda et al. 2002; Maeda & Nomoto 2003). There have been some observational evidence of such bipolar explosions – the HST image of SN II 1987A (Wang et al. 2002) and polarization measurements in SNe II/Ib/Ic (Wang et al. 2001; Kawabata et al. 2002; Leonard et al. 2002; Wang et al. 2003; Leonard et al. 2006).
To judge a validity of a model, we have to compare model predictions with observations in details. For this purpose, we have been developing SupernovA MUltidimensional RAdIation transfer code SAMURAI (Maeda et al. 2006ab; Maeda 2006; Tanaka et al. 2006). The code has been applied to very energetic supernova (hypernova) SN Ic 1998bw associated with a Gamma-Ray Burst. By comparing the model predictions with optical spectra and light curve of SN 1998bw in details, Maeda et al. (2006ab) concluded that SN 1998bw is the bipolar explosion viewed from the jet direction.
In this paper, we present the model prediction for radioactive decay - and X-rays from supernovae driven by bipolar jets. Details are presented in Maeda (2006) (see also Hungerford et al. 2003, 2005). Although the model has been applied to hypernovae, we believe that most of the model predictions apply even to usual SNe Ib/c which also show some evidence of asphericity (e.g., Wang et al. 2001).
2. METHOD AND MODELS
We use a fully time- and energy-dependent radiation transfer scheme to follow the high energy photons resulting from 56Ni/Co/Fe decay chain. This is done by using a Monte-Carlo method. Line -rays are produced according to the decay probabilities, then the photons are followed along their paths in which they suffer from pair creation, compton scattering, and photoelectric absorption in expanding 3D SN ejecta. The detail is described in Maeda (2006).
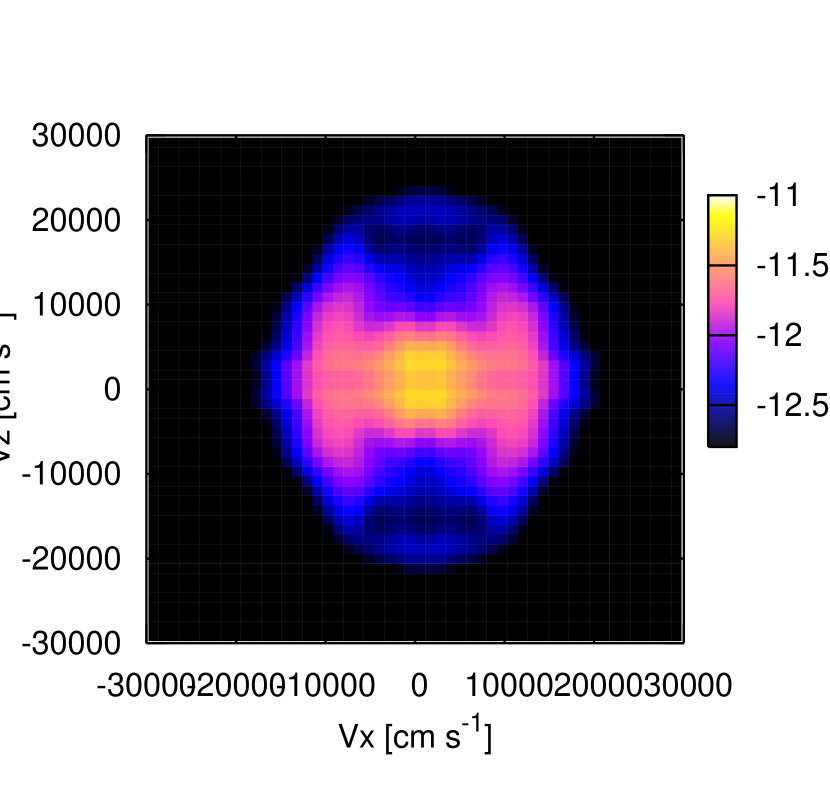
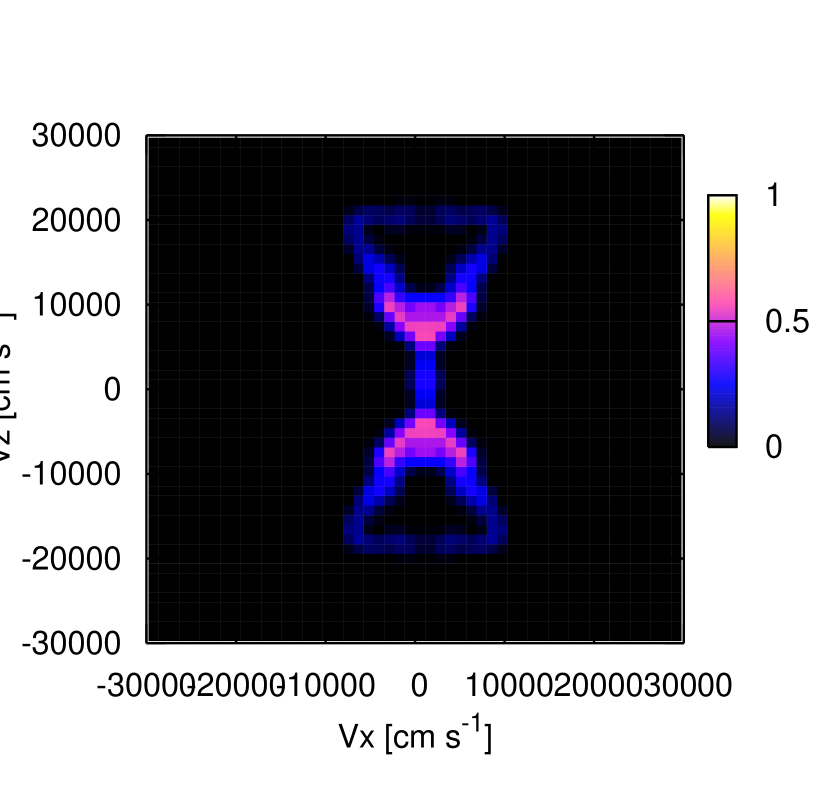
We adopt the bipolar model A from Maeda et al. (2006b), which successfully reproduces the optical observations of hypernova SN 1998bw. The hydrodynamic and nucleosynthetic features have been examined in detail in Maeda et al. (2002). For comparison, we also examine the spherical model S. The ejecta structure (density and 56Ni) is shown in Figure 1. In Model A, 56Ni is distributed preferentially along the jet axis because the materials in this direction experience high temperature (i.e., K) at the explosion. On the other hand, the density is enhanced in the equatorial plane (showing a disk-like structure), since only a weak shock wave pushes materials outward in the equatorial direction (Maeda et al. 2002; Maeda & Nomoto 2003).
3. RESULTS
3.1. Spectra
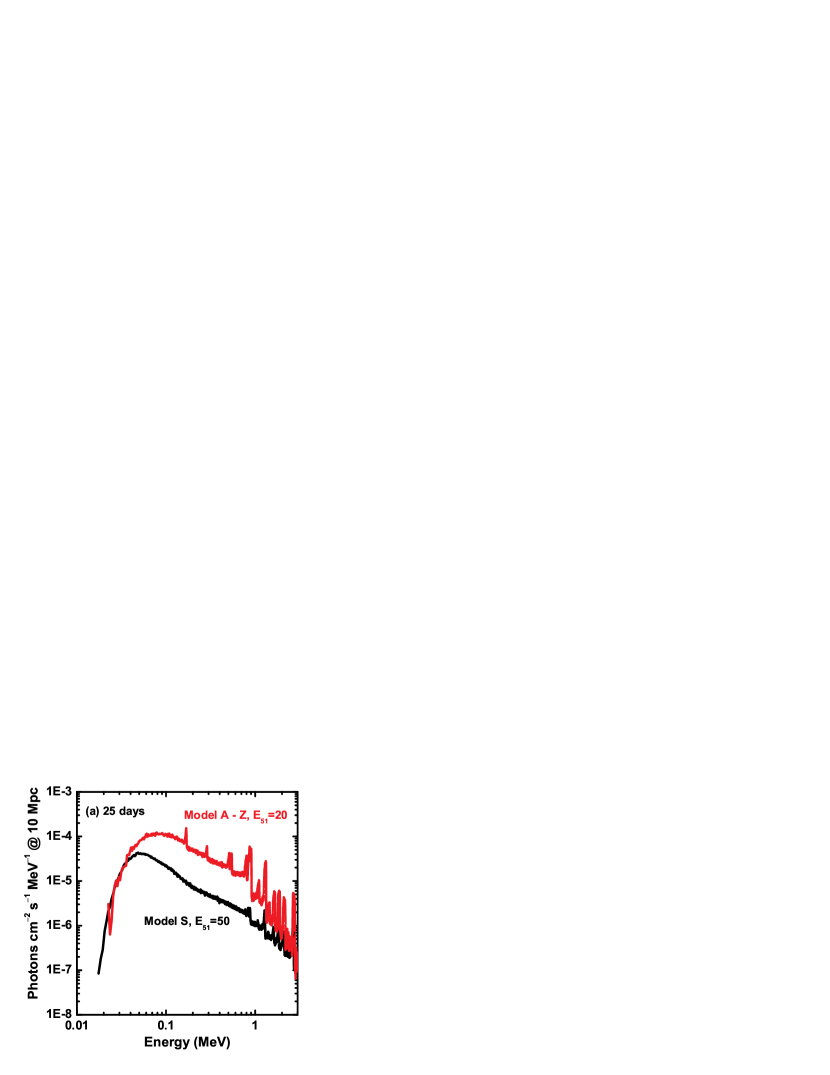
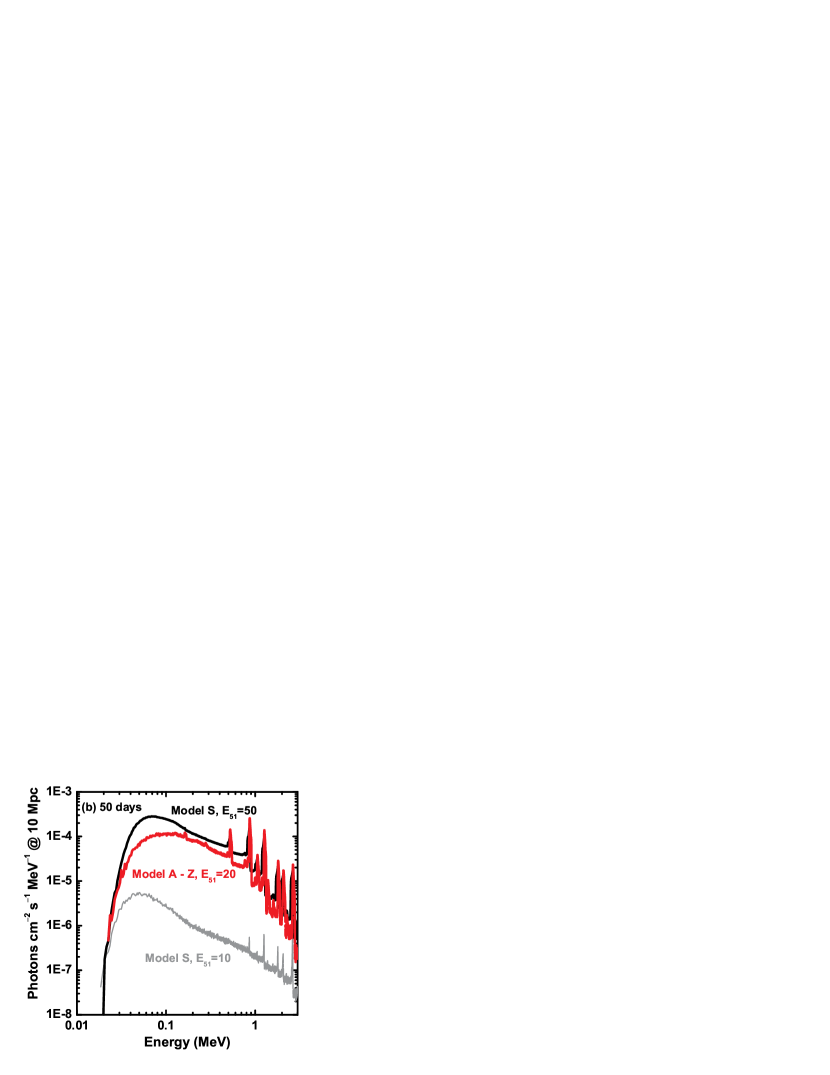
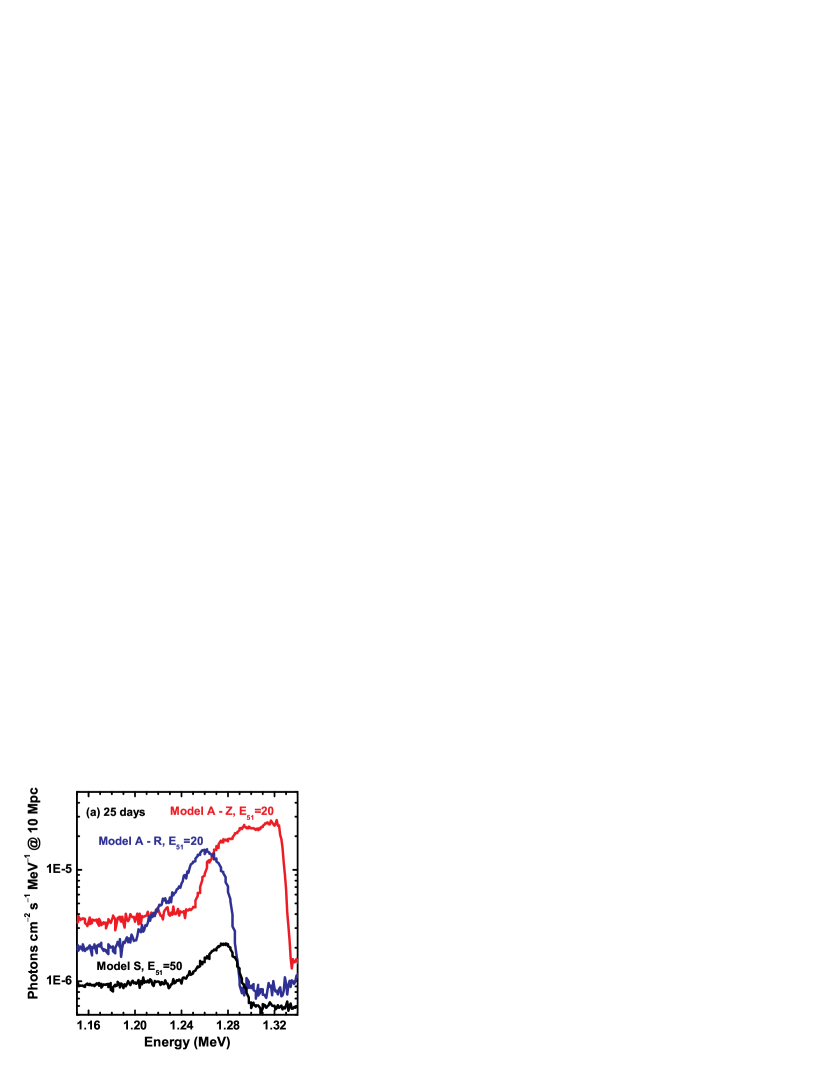
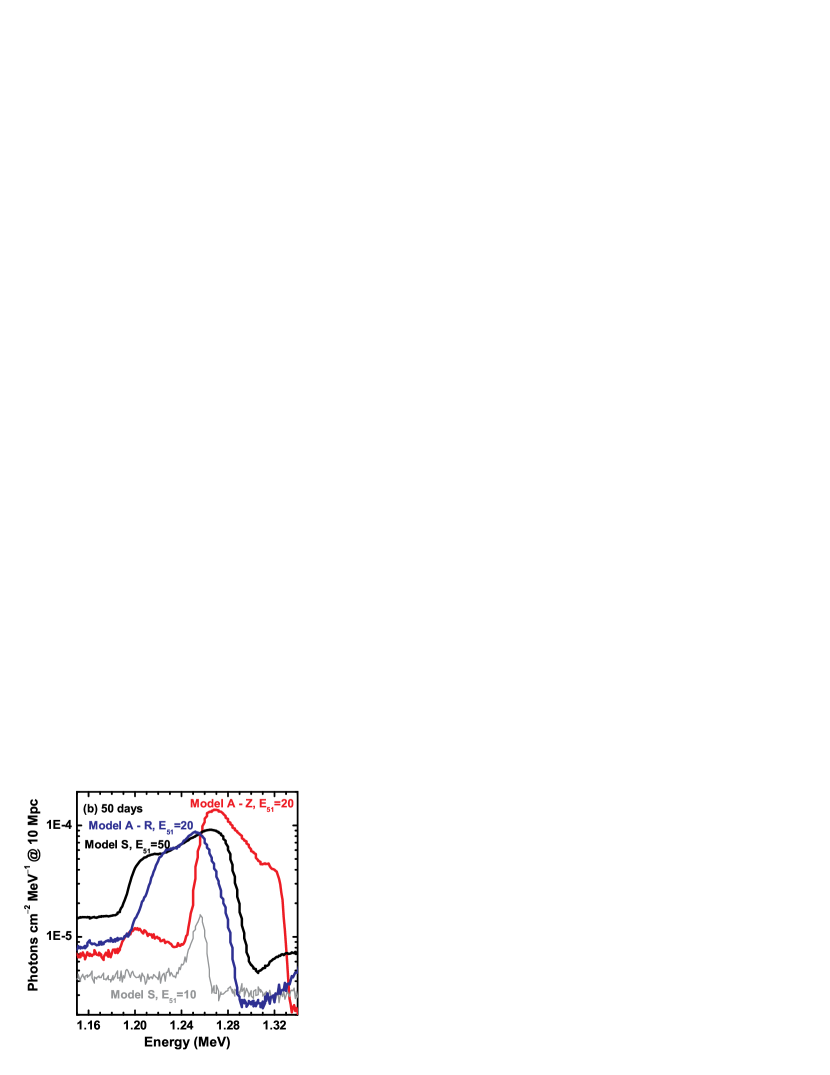
Figure 2 shows the high energy spectra at and days, which are obtained by our simulations. Hereafter, is the time after the explosion.
The aspherical model A has three unique features as compared to the spherical model S.
-
(1)
Large line-to-continuum ratio: Model A shows a large line-to-continuum ratio, especially early on. In Model A, the source of the high energy emission, i.e., 56Ni/Co, is abundantly present around the jet axis (-direction). In this direction, the density is small, thus the optical depth is small, as the consequence of the jet-induced explosion. Thus, few photons suffer from multiple compton scatterings which create the continuum in Model A. Since the situation does not change very much as time goes by, the line-to-continuum ratio does not show noticeable temporal evolution.
Also, the line-to-continuum ratio is not sensitive to the viewing orientation. Both observers in the - and -direction look at the same region, i.e., the 56Ni/Co-rich jet. The line-to-continuum ratio is determined by local physical conditions in the emitting region, which is same irrespective of the observer’s direction. Thus, it is nearly independent from the observer’s direction. An exception is a line profile, which is discussed in §3.2.
In Model S, a situation is different. The 56Ni/Co-rich region is surrounded by massive envelopes in Model S. The line photons experience many scatterings, creating the high level of the continuum. In Model S, the envelope becomes less and less optical thick due to the SN expansion, thus the continuum level becomes lower and lower as time goes by.
-
(2)
Large cut-off energy: The hard X-ray cut-off, which is created by photoelectric absorption, is at higher energy in Model A than Model S. In Model A, the last scattering point is close to the 56Ni-enhanced jet, thus the photoelectric absorption takes place in the Fe-rich materials. Since the situation does not change as time goes by, the cut-off energy does not show temporal evolution. This behavior is again insensitive to the observer’s direction.
On the other hand, Model S shows temporal evolution. Early on, the last scattering takes place near the surface where O is the dominant element. Later on, the last scattering point moves deeper to the inner region where Fe is the dominant element. Thus, the cut-off energy moves from lower to higher energy.
-
(3)
Early emergence: In Model A, escape of the high energy photons occurs earlier than in Model S if the kinetic energy of the expanding SN ejecta is the same. This is expected since 56Ni is produced along the axis where the optical depth is low in Model A.
3.2. Line Profiles
Line profiles are also different for models A and S. As an example, Figure 3 shows the line profiles of 56Co 1,238 keV line. Other lines have similar properties, but the line blending should be taken into account (e.g., 56Ni 812 keV and 56Co 847 keV).
Model A yields a blueshifted line if viewed from the jet (-) direction. In this case, an observer views the optically thin 56Ni/Co-rich region from the jet (-) direction, and the emission from the other hemisphere is blocked by the optically thick central region. The central region continues to be optically thick at days, thus the line keeps to be blueshifted.
If Model A is viewed from the -direction, then two 56Ni/Co-rich jets in both hemispheres can be seen. In this case, the emitting regions (the jets) are moving to the directions perpendicular to the observer. Thus, the line is centered at the rest wavelength when viewed from the -direction. The situation does not change as time goes by, thus the line center does not evolve as a function of time in Model A (irrespective of the observer’s direction).
However, the situation is different for Model S. Early on, only the outer region of the 56Ni/Co-rich region is seen, yielding the blueshifted line. As time goes by, the observer can look into the deeper region (because of the ejecta expansion and the density decrease), thus the line center continuously moves from the blue to the rest wavelength.
4. CONCLUSIONS AND DISCUSSIONS
| Features | Model S | Model A - Z | Model A - R |
|---|---|---|---|
| Line-to-ContaaThe line-to-continuum ratio, determined by compton scatterings. | Small | Large | Large |
| Cut-off EbbThe cut-off energy, determined by photoelectric absorptions. | Low | High | High |
| Evolution of spectraccThe evolution of the Line-to-continuum ratio and the cut-off energy. | Large | Small | Small |
| Line profileddThe line profile of isolated lines (especially at 1,238 keV). | Evolved | Blue | Rest |
| Evolution of LineseeTemporal evolution of the line profile. | Blue to Rest | Small | Small |
We have shown in this paper that expected observed features in the high energy emission are highly dependent on the geometry of the explosion. Models A and S have quite different characteristics, thus these model can be distinguished by observations of the high energy emission. Among the features, the line profile is very sensitive to the viewing orientation in Model A. Thus, if we can perform deep observations to detect the line profile, then even the viewing orientation can be distinguished. In addition, temporal evolution is very different for models A and S. The expected features are summarized in Table 1.
For the sensitivity of INTEGRAL ( in sec), we estimate that the maximum distances within which the -rays are detectable are kpc, Mpc, and Mpc for SNe II, canonical SNe Ib/c, and hypernovae, respectively. Since SN II 1987A, the nearest SNe for each type are SN II 2004dj ( Mps), SN Ic 1994I ( Mpc), and the hypernova SN Ic 2002ap ( Mpc). Thus, the sensitivity of INTEGRAL is unfortunately not enough to detect these core-collapse SNe in the pace of 1 per 2 decades, unless very nearby SNe like SN 1987A fortunately appears in the sky.
If new generation hard X- and -ray telescopes are designed to achieve a sensitivity magnitude or two better than the current instrument (Takahashi et al. 2001), then it is expected that the high energy emission from core-collapse SNe can be detected SN per year. This sensitivity will lead to a comprehensive study of the SN explosive physics through observing the high energy emission.
References
- (1) Cassé, M., & Lehoucq, R. 1994, in Supernovae, ed. S.A. Bludman et al. (Amsterdam: Elsvier), 589
- (2) Clayton, D.D., Colgate, S.A., & Fishman, G.J., 1969, ApJ, 155, 75
- (3) Dotani, T., Hayashida, K., Inoue, H., Itoh, M., & Koyama, K. 1987, Nature, 330, 230
- (4) Hungerford, A.L., Fryer, C.L., & Warren, M.S. 2003, ApJ, 594, 390
- (5) Hungerford, A.L., Fryer, C.L., & Rockefeller, G. 2005, ApJ, 635, 487
- (6) Kawabata, K.S., et al. 2002, ApJ, 580, L39
- (7) Kumagai, S., Shigeyama, T., Nomoto, K., Itoh, M., Nishiyama, J., & Tsuruta, S. 1989, ApJ, 345, 412
- (8) Leising, M.D., The, L.-S., Höflich, P., Kurfess, J.D., & Matz, S.M. 1999, BAAS, 31, 703
- (9) Leonard, D.C., Filippenko, A.V., Chornock, R., & Foley, R.J. 2002, PASP, 114, 1333
- (10) Leonard, D.C., et al. 2006, Nature, 440, 505
- (11) Lichti, G.G., et al. 1994, A&A, 292, 569
- (12) Maeda, K., Nakamura, T., Nomoto, K., Mazzali, P.A., Patat, F., & Hachisu, I. 2002, ApJ, 565, 405
- (13) Maeda, K., Mazzali, P.A., Deng, J., Nomoto, K., Yoshii, Y., Tomita, H., & Kobayashi, Y. 2003, ApJ, 593, 931
- (14) Maeda, K., & Nomoto, K., 2003, ApJ, 598, 1163
- (15) Maeda, K. 2006, ApJ, 644, 385
- (16) Maeda, K., Nomoto, K., Mazzali, P.A., & Deng, J. 2006a, ApJ, 640, 854
- (17) Maeda, K., Mazzali, P.A., & Nomoto, K. 2006b, ApJ, 645, 1331
- (18) Matz, S.M., Share, G.H., Leising, M.D., Chupp, E.L., & Vestrand, W.T. 1988, Nature, 331, 416
- (19) Matz, S.M., & Share, G.H. 1990, ApJ, 362, 235
- (20) McCray, R., Shull, J.M., & Sutherland, P. 1987, ApJ, 317, L73
- (21) Morris, D.J., et al. 1997, in AIP Conf. Proc. 410, Proc. 4th Compton Symp., ed. C.D. Dermer, M.S. Strickman, & J.D. Kurfess (New York: AIP), 1084
- (22) Nagataki, S. 2000, ApJS, 127, 141
- (23) Shibazaki, N., & Ebisuzaki, T. 1988, ApJ, 327, L9
- (24) Sunyaev, R.A., et al. 1987, Nature, 330, 227
- (25) Takahashi, T., Kamae, T., & Makishima, K. 2001, in ASP. Conf. Ser. 251, New Century of X-Ray Astronomy, ed. H. Inoue & H. Kunieda (San Francisco: ASP), 210
- (26) Tanaka, M., Mazzali, P.A., Maeda, K., & Nomoto, K. 2006, ApJ, 645, 470
- (27) Wang, L., Howell, D.A., Höflich, P., & Wheeler, J.C. 2001, ApJ, 550, 1030
- (28) Wang, L., et al. 2002, ApJ, 579, 671
- (29) Wang, L., Baade, P., Höflich, P., & Wheeler, J.C. 2003, ApJ, 592, 457
- (30) Woosley, S.E., Pinto, P.A., Martin, P.G., & Weaver, T.A. 1987, ApJ, 318, 664