11email: Volker.Beckmann@obs.unige.ch 22institutetext: Observatoire Astronomique de l’Université de Genève, Chemin des Maillettes 51, 1290 Sauverny, Switzerland 33institutetext: CSST, University of Maryland Baltimore County, 1000 Hilltop Circle, Baltimore, MD 21250, USA 44institutetext: INTEGRAL Science Operations Centre, European Space Astronomy Centre (ESAC), Apartado 50727, 28080 Madrid, Spain 55institutetext: Danish National Space Centre, Technical University of Denmark, Juliane Maries Vej 30, 2100 Copenhagen, Denmark 66institutetext: Laboratorio de Astrofísica Espacial y Física Fundamental (LAEFF-INTA), POB 50727, 28080 Madrid 77institutetext: INAF-Istituto di Astrofisica Spaziale e Fisica Cosmica di Roma, via Fosso del Cavaliere 100, I-00133 Roma, Italy 88institutetext: Dipartimento di Astronomia, Universita’ degli Studi di Bologna, Via Ranzani 1, I40127 Bologna, Italy 99institutetext: Centre d’Etude Spatiale des Rayonnements, CNRS/UPS, B.P. 4346, 31028 Toulouse Cedex 4, France 1010institutetext: Astrophysics Science Division, NASA Goddard Space Flight Center, Code 661, MD 20771, USA 1111institutetext: Space Research Institute, Russian Academy of Sciences, Profsoyuznaya 84/32, 117997 Moscow, Russia 1212institutetext: Observatory, PO Box 14, University of Helsinki, FIN-00014 University of Helsinki, Finland 1313institutetext: Max-Planck-Institut für extraterrestrische Physik, Gießenbachstraße, 85748 Garching, Germany
Cygnus X-3 transition from the ultrasoft to the hard state††thanks: Based on observations with INTEGRAL, an ESA project with instruments and science data centre funded by ESA member states (especially the PI countries: Denmark, France, Germany, Italy, Switzerland, Spain), Czech Republic and Poland, and with the participation of Russia and the USA
Abstract
Aims. The nature of Cygnus X-3 is still not understood well. This binary system might host a black hole or a neutron star. Recent observations by INTEGRAL have shown that Cygnus X-3 was again in an extremely ultrasoft state. Here we present our analysis of the transition from the ultrasoft state, dominated by blackbody radiation at soft X-rays plus non-thermal emission in the hard X-rays, to the low hard state.
Methods. INTEGRAL observed Cyg X-3 six times during three weeks in late May and early June 2007. Data from IBIS/ISGRI and JEM-X1 were analysed to show the spectral transition.
Results. During the ultrasoft state, the soft X-ray spectrum is well-described by an absorbed () black body model, whereas the X-ray spectrum above 20 keV appears to be extremely low and hard (). During the transition, the radio flux rises to a level of , and the soft X-ray emission drops by a factor of , while the hard X-ray emission rises by a factor of and becomes steeper (up to ).
Conclusions. The ultrasoft state apparently precedes the emission of a jet, which is apparent in the radio and hard X-ray domain.
Key Words.:
Stars: individual: Cyg X-3 – X-rays: binaries – X-rays: individuals: Cyg X-3 – Stars: Wolf-Rayet1 Introduction
The binary system Cygnus X-3 is one of the brightest objects in the X-ray sky. It was discovered by one of the first X-ray rocket experiments (Giacconi et al. 1967). Although one of the longest known and brightest X-ray sources, its nature is still not understood very well. The object is bright throughout the electromagnetic spectrum (e.g. McCollough et al. 1999) and is located in the Galactic plane at a distance of 9 kpc (Predehl et al. 2000). In this system, a donor star is orbiting a compact object in a close orbit. The nature of the compact object is still under debate, and it could be a black hole, an X-ray pulsar, or a neutron star with a low magnetic field. Chandra observations indicate that the masses of the donor star and the compact object are and , respectively (Stark & Saia 2003). Strong absorption features are observed throughout the spectrum, which leads to the assumption that the system is embedded in a dense wind coming from the donor, presumably a massive, nitrogen-rich Wolf-Rayet star with huge mass loss (van Keerkwijk et al. (1992)). The light curve of the system shows a 4.8hr quasi-sinosoidal modulation, present both in X-rays and infrared (Goldoni et al. (2003)).
Cygnus X-3 is also a bright radio source, with a quiescent flux , a flux of 0.1 to 1 Jy during minor flares, and more than 1 Jy in strong flares (McCollough et al. 1999). The radio emission during strong flares appears to be correlated to the hard X-ray emission, but anticorrelated with the soft X-rays, whereas the situation is inverted during quiescence (McCollough et al. (1999)). As the source shows radio-jet like structures during flares (Miller-Jones et al. 2004) and quasi-periodic oscillations (van der Klis & Jansen 1985), Cygnus X-3 might be a microquasar.
Cygnus X-3 was studied by INTEGRAL (Winkler et al. 2003) early during the mission (Vilhu et al. 2003). Lately, Cyg X-3 appeared again to be in an ultrasoft state with strong soft X-ray but weak hard X-ray emission (Soldi et al. 2007). Here we report on our detailed analysis of the ultrasoft state and its transition to the “normal” low hard state.
2 Data analysis
INTEGRAL (Winkler et al. (2003)) observed Cygnus X-3 several times after it reached the ultrasoft state in May 2007 (Soldi et al. (2007)). Data from the imager IBIS/ISGRI (Lebrun et al. (2003)) and the X-ray monitor JEM-X1 (Lund et al. (2003)) were analysed using the Offline Standard Analysis package OSA 6 provided by the ISDC (Courvoisier et al. (2003)). Table 1 gives a list of the observations performed.
| Revolution | Start time | Stop time | ISGRI exposure | significance |
|---|---|---|---|---|
| [U.T.] | [U.T.] | [sec] | ||
| 562 | 2007-05-21T09:45 | 2007-05-21T23:37 | 9557 | 5.2 |
| 563 | 2007-05-25T07:35 | 2007-05-26T21:43 | 51237 | 3.1 |
| 564 | 2007-05-27T08:53 | 2007-05-29T21:25 | 64319 | 5.8 |
| 567 | 2007-06-05T08:18 | 2007-06-07T21:35 | 39750 | 72.3 |
| 568 | 2007-06-08T08:08 | 2007-06-10T20:45 | 21750 | 56.9 |
| 569 | 2007-06-11T07:57 | 2007-06-12T02:40 | 21201 | 54.6 |
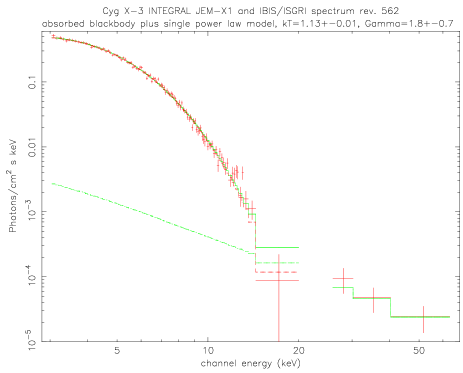
JEM-X1 covered the position of Cyg X-3 only during revolution 562 and detected the source within 6945s with a 175 sigma significance. The combined JEM-X1 and ISGRI spectrum in rev. 562 allows a detailed spectral modelling. The best-fit results are achieved for an absorbed () blackbody () plus power law with ( errors). The luminosity over the 2–60 keV range is , assuming a distance of 9 kpc (Predehl et al. 2000). With a flux in the 2–10 keV band of and only at 20-60 keV, Cyg X-3 was clearly in an ultrasoft state during this observation. The spectrum of revolution 562 is shown in Fig. 1.
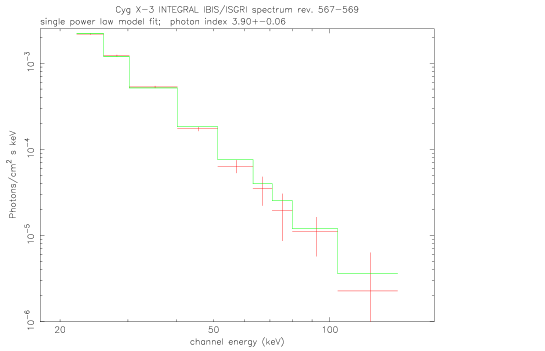
INTEGRAL observed the region several times over the following three weeks. The IBIS/ISGRI data can be fit in all cases with a single power-law model. The fluxes, photon indices, and luminosities based only on ISGRI data are given in Table 2. In addition, we list there the fluxes taken from RXTE/ASM in the 2–10 keV range. The ASM count rates, based on the quick-look results provided by the ASM/RXTE team, have been converted assuming a Crab-like spectrum where the Crab has a flux of (Kirsch et al. (2005)). It has to be taken into account, though, that the errors of the measurements are likely to be underestimated for the following reasons, as reported by the instrument team. A single elevation correction based on the 2–10 keV flux from the Crab nebula is used. This elevation correction, however, has a spectral dependence because of increased low-energy absorption in the thermal shields and counter windows. The sources of a different spectral shape than the Crab’s, then, may well have greater scatter. Second, the Cygnus region harbours the very bright and variable source Cyg X-1, which might contribute to additional systematic error in the ASM data. The results based on the INTEGRAL data revolution 567-569 have been combined as there were no differences within the error bars. In Fig.2 we show the IBIS/ISGRI spectrum of revolution 567-569, which shows that Cygnus X-3 is indeed in the low hard state again. The spectrum can be described by a single power-law model with photon index .
| Revolution | ASM flux (2-10 keV) | ||||
|---|---|---|---|---|---|
| ] | ] | ] | |||
| 562 | |||||
| 563 | |||||
| 564 | |||||
| 567-569 |
3 Discussion and conclusions
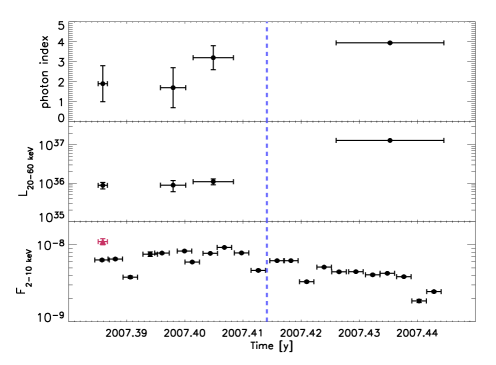
It is apparent that the transition from the ultrasoft state to the low hard state is accompanied by a steepening of the high-energy component. At the same time, the luminosity of this component has increased by a factor of . A radio observation within the transition phase on 2007-06-01 (Trushkin et al. 2007a) showed strong emission ( Jy), which indicates increased jet activity. The behaviour during this transition from the ultrasoft to low hard states is comparable to what was reported in January 2007 (Trushkin et al. 2007b). The ultrasoft state is apparent during spacecraft revolutions 562 and 563, with an energy output of in the 20 – 60 keV energy band. In revolution 564, we observed the onset of the transition, with a steeper spectral slope in the hard X-rays but still comparably low luminosity. Figure 3 shows the evolution of the spectral slope and of the luminosity in the 20–60 keV energy band with time. In revolution 567, the low hard state is reached and the ISGRI data can be modelled by a simple power law with . The low hard state has been measured in this energy range before, e.g. by RXTE/HEXTE (Choudhury & Rao 2002; Choudhury et al. 2002). The data with higher significance allow them to apply a more complex model, i.e. Comptonization of seed photons from a thermal multi-coloured accretion disk by a thermal Comptonizing plasma cloud (CompST; Sunyaev & Titarchuk (1980)) with electron temperature and a single power law with . Although the ISGRI data are described well by a simple power law with , we applied the more complex model for comparison reasons, which results in and . When freezing the power law to the value reported by Choudhury & Rao, the electron temperature becomes . Thus, to explain the observed ISGRI spectrum in terms of a Comptonization component plus a power law, a stronger Comptonization component is observed here than by RXTE/HEXTE in May 1998. It has to be kept in mind, though, that the ISGRI data of the low hard state alone are well-fit by a single power law and do not require more complex modelling.
The actual transition from the high soft to the low hard state took place during revolutions 565 and 566 as observed in the radio band. As we are missing the X-ray observation during this period, we cannot say whether the source has undergone an intermediate state as described in Szostek & Zdziarski (2004). The RXTE/ASM data show, however, that the transition has to be rather smooth, as the 2–10 keV flux decreases gradually from the ultrasoft state () to the low hard state ().
Szostek & Zdziarski (2004) suggest that the transition from the ultrasoft state to the low hard state is a transition in the hard X-rays from a jet-dominated phase to thermal Comptonization. In our observation, this would mean that we detect the emission of the jet in the ultrasoft state in the hard X-rays as indicated by . During the transition the jet becomes more and more diluted by the onset of the strong thermal Comptonization component, which we see in the steepening and brightening of the hard X-ray spectrum. Rajeev et al. (1994) interpreted the transition in terms of an increasing temperature of the black body component, which is at the same time decreasing in size and whose Comptonization region simultaneously is becoming more compact and more opaque. Finally, the hard X-ray spectrum of the low hard state can be fit by a model of almost pure Compton reflection (Hjalmarsdotter et al. 2004, 2007).
The true nature of the compact object in Cygnus X-3 still has to be determined. Hard X-ray observations, as provided by INTEGRAL and simultaneous radio observations, are essential in disentangling the four main components: the absorbing material detectable in soft X-rays, the thermal (blackbody) component, the jet, and the Comptonization component.
References
- (1)
- Choudhury & Rao (2002) Choudhury, M. & Rao, A. R. 2002, ApA, 23, 39
- Choudhury et al. (2002) Choudhury, M., Rao, A. R., Vadawale, S. V., Ishwara-Chandra, C. H. & Jain, A. K. 2002, A&A, 383, L35
- Courvoisier et al. (2003) Courvoisier, T.J.-L., Walter, R., Beckmann, V., et al. 2003, A&A, 411, L53
- Giacconi et al. (1967) Giacconi, R., Gorenstein, P., Gursky, H., & Waters, J. R. 1967, ApJ, 148, L119
- Goldoni et al. (2003) Goldoni, P., Bonnet-Bidaud, J. M., Falanga, M., & Goldwurm, A. 2003, A&A, 411, L399
- Hjalmarsdotter et al. (2004) Hjalmarsdotter, L., Zdziarski, A. A., Paizis, A., Beckmann, V. & Vilhu, O. 2004, proceedings of the 5th INTEGRAL workshop, Munich 2004, ESA SP-552
- Hjalmarsdotter et al. (2007) Hjalmarsdotter, L., Zdziarski, A. A., Larson, S., et al. 2007, MNRAS submitted, astro-ph/0707.2032
- Kirsch et al. (2005) Kirsch, M. G. F., Briel, U. G., Burrows, D., et al. 2005, SPIE, 5898, 22
- Lebrun et al. (2003) Lebrun, F., Leray, J. P., Lavocat, P., et al. 2003, A&A, 411, L141
- Lund et al. (2003) Lund, N., Budtz-Jorgensen, C., Westergaard, N. J., et al. 2003, A&A, 411, L231
- McCollough et al. (1999) McCollough, M. L., Robinson, C. R., Zhang, S. N., et al. 1999, ApJ, 517, 951
- Miller-Jones et al. (2004) Miller-Jones, J. C. A., Blundell, K. M., Rupen, M. P., et al. 2004, ApJ, 600, 368
- Predehl et al. (2000) Predehl, P., Burwitz, V., Paerels, F. & Trümper, J. 2000, A&A, 357, L25
- Rajeev et al. (1994) Rajeev, M. R., Chitnis, V. R., Rao, A. R., Singh, K. P. 1994, ApJ, 424, 376
- Soldi et al. (2007) Soldi, S., Beckmann, V., Courvoisier, T.J.-L. & Kreykenbohm, I. 2007, ATel, 1081
- Stark & Saia (2003) Stark, M. J. & Saia, M. 2003, ApJ, 587, L101
- Sunyaev & Titarchuk (1980) Sunyaev, R. A. & Titarchuk, L. G. 1980, A&A, 86, 121
- Szostek & Zdziarski (2004) Szostek, A. & Zdziarski, A. A. 2004, proc. of the Conference “X-Ray Timing 2003: Rossi and Beyond”, Cambridge, November 3-5, 2003, astro-ph/0401265
- (20) Trushkin, S. A., Bursov, N. N., & Nizhelskij, N. A. 2007a, ATel, 1092
- (21) Trushkin, S. A., Bursov, N. N., & Nizhelskij, N. A. 2007b, ATel, 984
- van der Klis & Jansen (1985) van der Klis, M. & Jansen, F. A. 1985, Nature, 313, 768
- van Keerkwijk et al. (1992) van Keerkwijk, M. H., Charles, P.A. & Geballe, T. R. 1991, Nature, 355, 703
- Vilhu et al. (2003) Vilhu, O., Hjalmarsdotter, L., Zdziarski, A. A., et al. 2003, A&A, 411, L405
- Winkler et al. (2003) Winkler, C., Courvoisier, T.J.-L., Di Cocco, G., et al. 2003, A&A, 411, L1