Supernova rates and stellar populations
Abstract
We discuss the results about the nature of type Ia Supernovae that can be derived by studying their rates in different stellar populations. While the evolution of SN photometry and spectra can constrain the explosion mechanism, the SN rate depends on the progenitor system. We review the current available data on rates as a function of parent galaxy color, morphology, star formation rate, radio luminosity and environment. By studying the variation of the rates with the color of the parent galaxy, a strong evidence was established that type Ia SNe come from both young and old stars. The dependence of the rates with the radio power of the parent galaxy is best reproduced by a bimodal distribution of delay time between the formation of the progenitor and its explosion as a SN. Cluster early-type galaxies show higher type Ia SN rate with respect to field galaxies, and this effect can be due either to traces of young stars or to differences in the delay time distribution.
keywords:
supernovae:general1 Introduction
Type Ia Supernovae are considered to be due the thermonuclear explosion of a C/O white dwarf (WD) in a binary system due to mass accretion from a secondary star. Such a conclusion follows from the a few fundamental arguments: explosion requires a degenerate system, such as a white dwarf; the presence of SNe Ia in old stellar systems means that at least some of their progenitors must come from old, low-mass stars; the lack of hydrogen in the SN spectra requires that the progenitor has lost its outer envelope; and, the released energy per unit mass is of the order of the energy output of the thermonuclear conversion of carbon or oxygen into iron. Considerable uncertainties about the explosion model remain within this broad framework, such as the structure and the composition of the exploding WD (He, C/O, or O/Ne), its mass at explosion (at, below, or above the Chandrasekar mass) and flame propagation (detonation, deflagration, or a combination of the two).
Large uncertainties also remain on the nature of the progenitor binary system, its evolution through one or more common envelope phases, and its configuration (single or double-degenerate) at the moment of the explosion (see [Yungelson (2005)] for a review). Solving the problem of the progenitor system is of great importance for modern cosmology as SNe dominate metal production, (e.g., [Matteucci & Greggio (1986)]), are expected to be important producer of high-redshift dust ([Maiolino et al. (2004a), Maiolino et al. (2004b), Bianchi & Schneider (2007)]), and are essential to understand the feedback process during galaxy formation (e.g., [Scannapieco et al. (2006)]).
While the primary observations to constrain the explosion models are the evolution of SN photometry and spectra, the study of the supernova rates in different types of galaxies gives strong informations about the progenitors. For example, soon after the introduction of the distinction between “type I” and “type II” SNe ([Minkowski (1941)]), [van den Bergh (1959)] pointed out that type IIs are frequent in late type galaxies “which suggests their affiliation with Baade’s population I”. On the contrary, type Is, are the only type observed in elliptical galaxies and this fact “suggests that they occur among old stars”. This conclusion is still often accepted, even if it is now known not to be generally valid: first, SN Ib/c used to be included in the broad class of “type I” SNe, and, second, it is now known that also a significant fraction of SNe Ia have young progenitors.

2 The delay time distribution
The key quantity to relate the type Ia SN rate to the parent stellar population is the delay time distribution (DTD), i.e., the distribution of the delays between the formation of a binary system and its explosion as a SN. In general, deriving an expected DTD from a progenitor model is not an easy task because many parameters are involved, such as the initial distribution of orbital parameters in the binary system, the distribution of mass ratio between primary and secondary star, the efficiency of mass loss during the common envelope phase, the efficiency of mass transfer from one star to the other, the amount of mass retained by the primary star during accretion. Also the uncertainties in the explosion model play a key role: for example, it is not known if it is necessary to reach the Chandrasekar mass to start the explosion of if it is enough to be in the sub-Chandrasekar regime.
Two basic models are present in the literature, the single-degenerate (SD) model, in which a white dwarf accretes hydrogen-rich mass from a non-degenerate secondary, and a double-degenerate (DD) model, where two white dwarfs merge after the emission of gravitational waves. In 1983, Greggio & Renzini computed the expected DTD for a single degenerate system, and such a computation was later refined and extended to the double-degenerate systems by many authors, as [Tornambè & Matteucci (1986), Tornambè (1989), Tutukov & Yungelson (1994), Yungelson & Livio (2000), Matteucci & Recchi (2001), Belczynski et al. (2005)] and [Greggio (2005)]. In many cases the results of these models are very different. In some cases, all the explosions are concentrated in a very narrow range of delay time (for example, in the [Yungelson & Livio (2000)] SD Chandrasekar-mass model, all the SNe explode between 0.6 and 1.5 Gyr), in other cases the explosion happens at any delay time (from 25 Myr to 12 Gyr, in the [Yungelson & Livio (2000)] DD model); in some models all happens soon after the formation (within 1 Gyr for the [Belczynski et al. (2005)] SD model), in other cases the first SNe explode after a very long time (more than 10 Gyr for the [Belczynski et al. (2005)] semidetached double white dwarf model); some distributions are smooth, as the analytic models by [Greggio (2005)], some others have multiple peaks ([Belczynski et al. (2005)]).
The observed SN rate is the convolution of DTD with the past star-formation history (SFH) of the galaxies. This latter function also determines the stellar population. As consequence, studying the SN rates in different parent galaxies can put strong constraints on the DTD.
In Figure 1 we show three representative DTDs that will be discussed later. First, we show the DTD theoretically derived by [Greggio & Renzini (1983)] (GR83), which is based on a single degenerate model; second, the empirical DTD derived by [Dahlen et al. (2004)] by fitting the evolution of the SN rate with redshift; third, a simplified version of the empirical DTD obtained by [Mannucci et al. (2006)] by discussing the dependence of the rates on redshift, colors of the parent galaxies and radio power of the hosts.

3 The Supernova rate per unit mass and the weak bimodality in type Ia SNe
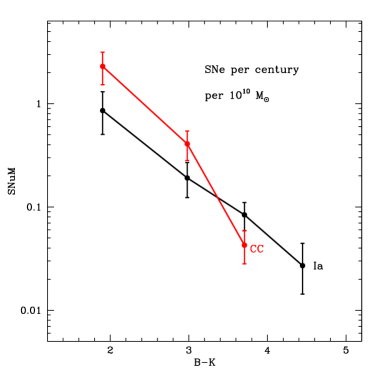
The most important observations to constrain the DTD are the SN rates per unit mass in galaxies of different types, as presented by [Mannucci et al. (2005)] (see Figure 2). Using the SN rate in [Cappellaro et al. (1999)], we found that the bluest galaxies, hosting the highest Star Formation Rates (SFRs), have SN Ia rates about 30 times larger than those in the reddest, quiescent galaxies. The higher rates in actively star-forming galaxies imply that a significant fraction of SNe must be due to young stars, while SNe from old stellar populations are also needed to reproduce the SN rate in quiescent galaxies. This lead [Mannucci et al. (2005)] to introduce the simplified two component model for the SN Ia rate (a part proportional to the stellar mass and another part to the SFR). These results were later confirmed by [Sullivan et al. (2006)], while [Scannapieco & Bildsten (2005)], [Matteucci et al. (2006)] and [Calura et al. (2007)] successfully applied this model to explain the chemical evolution of galaxies and galaxy clusters.
In the DTD formalism, these results can be explained only by a DTD spanning a wide range of delay times, with a peak at early time and a slow decrease afterward. This is shown in Figure 3, where the predictions of the three DTDs in Figure 1 are shown. It is evident that the GR83 and MDP06 DTDs, extending from below 108 to above 1010 years, reproduce the variation of the rates with the color of the parent galaxies. At variance, the D04 DTD, showing a narrow distribution peaked at about 3.5 Gyr, does not reproduce the global trend, neither the rate in the old galaxies (having ages much larger than 3.5 Gyr) nor the overproduction of SNe in active galaxies (having a significant fraction of young stars).
Such a result was recently confirmed by [Aubourg et al. (2007)]. They derived the SFH of 257 SDSS-DR5 galaxies containing SNe Ia, and demonstrated that a significant number of events are associated to stellar populations as young as years.

4 The rate in radio-loud galaxies and the strong bimodality in type Ia SNe
[Della Valle & Panagia(2003)] and [Della Valle et al. (2005)] studied the dependence of the SN Ia rate in early-type galaxies on the radio power of the host. They found that the rates in radio-loud galaxies is about a factor of 4 larger than in radio-quiet galaxies. This is interpreted as due to small episodes of accretion of gas or capture of small galaxies. Such events result in both fueling the central black hole, producing the radio activity, and in creating a new generation of stars, producing the increase in the SN rate. As the lifetime of the radio-activity is of the order of years, this observation can be used to constrain the DTD at such short delay times, once a model of galaxy stellar population is introduced.
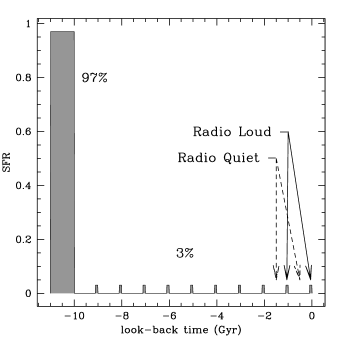
The difference between radio-loud and radio-quiet galaxies can be reproduced by the model of early-type galaxy shown in the right panel of Figure 4: most of the stars are formed in a remote past, about years ago, while a small minority of stars are created in a number of subsequent bursts. A galaxy appears radio-loud when is observed during the burst, radio-faint soon after, and radio-quiet during the quiescent inter-burst period. The abundance ratio between radio-loud and radio-quiet galaxies, about 0.1 in our sample, means that the duty cycle of the burst events is about 10%. As the duration of the radio-loud phase is about 108 years, in 1010 years the early-type galaxies are expected to have experienced 10 small bursts, i.e., 1 every 109 years.
This model naturally explains the fact that radio-loud and radio-quiet early-type galaxies have very similar (B–K) colors, a sensitive indicator of star formation and stellar age. This is shown in the left panel of Figure 4, where the two color distributions are compared. Only a small difference in the median of the two distributions might be present at any mass, i.e., the radio-loud galaxies appear to be 0.03-0.06 mag bluer than radio-quiet galaxies, and this could be the effect of last on-going burst of star formation.
The amount of mass in younger stars can be estimated from the (B–K) color, that is consistent with the value of (B–K)4.1 typical of old stellar populations. By using the [Bruzual & Charlot (2003)] model, we obtain that no more than 3% of stellar mass in total can be created in the 10 bursts (0.3% of mass each) if we assume negligible extinction, otherwise the predicted color would be too blue. The maximum mass in new stars can reach 5% assuming an average extinction of the new component of .
This model predicts that traces of small amounts of recent star formation should be present in most of the local early-type galaxies. This is actually the case: most ellipticals show very faint emission lines ([Sarzi et al. (2006), Haines et al. (2007)]), tidal tails ([van Dokkum (2005)]), dust lanes ([Colbert et al. (2001)]), HI gas ([Morganti et al. (2006)]), molecular gas ([Welch & Sage (2003)]), and very blue UV colors ([Schawinski et al. (2007)]). Furthermore, [Ferreras et al. (2006)] have found evidence for recent star formation, at the percent level, in ellipticals in compact groups, but not in field ellipticals. Even if the interpretation of most of these effects is matter of debate (for example, [Haines et al. (2007)] have found higher levels of present star formation in field rather than cluster early-type galaxies), they could be at least partially related to the higher SN Ia rate in cluster early-type galaxies and in radio-loud objects.

Using this model with a total fraction of new stars of 3%, we derive the results shown in figure 5. We see that the theoretical models by [Greggio & Renzini (1983)] predicts too few SNe in the first years (about 11%) to accurately fit figure 5. Also the D04 DTD is not adequate. The observed rates can be reproduced only by adding a “prompt” component (in this case modeled in terms of an exponentially declining distribution with 0.03 Gyr) to a “tardy” component (an other declining exponential with 3 Gyr), each one comprising 50% of the total number of events.
It should be noted that this strong bimodality is based on a small number of SNe (21) in early-type galaxies, and the results of oncoming larger SN searches are needed to confirm (or discard) this result.
5 Evolution of the SN rate with redshift
Constrains on the DTD can also be derived by comparing the redshift evolution of the SN rate with the cosmic SFH. This possibility was explored by many authors, as [Madau et al. (1998), Dahlen et al. (1999), Pain et al. (2002), Dahlen et al. (2004), Mannucci et al. (2005), Barris & Tonry (2006), Neill et al. (2006), Botticella et al. (2007)] and [Poznanski et al. (2007)]. Unfortunately, large uncertainties are present on both functions: (1) SN rates published by different groups often differ much more than the quoted errors, implying the presence of uncorrected systematics; (2) many different SFHs can be fitted to the present data (see [Hopkins & Beacom (2006)] and [Mannucci et al. (2007a)] for reviews of the available data). As a consequence, [Förster et al. (2006)] demonstrated that no strong conclusions on the DTD can now be reached by only using the cosmic evolution of the rate.
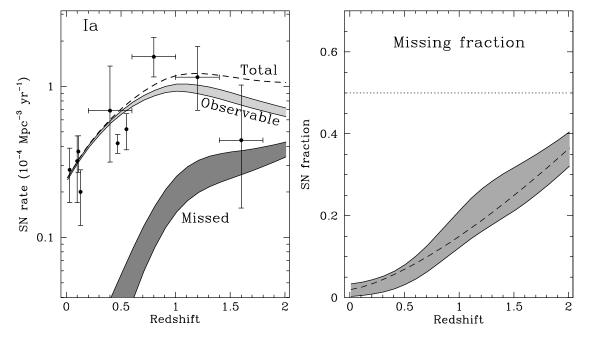
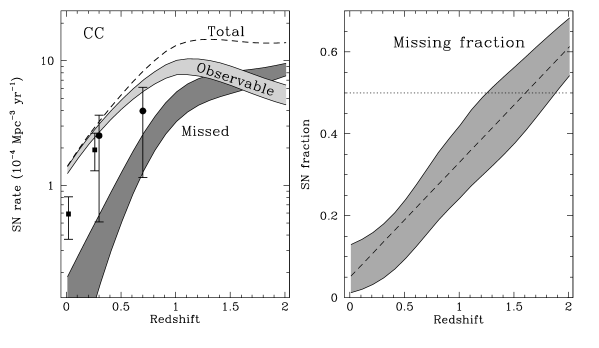
An additional complication is the amount of dust affecting both the SN searches and the determination of the SFH. Near-infrared and radio searches for core-collapse supernovae in the local universe ([Maiolino et al. (2002), Mannucci et al. (2003), Lonsdale et al. (2006), Mattila et al. (2007), Cresci et al. (2007)]) have shown that the vast majority of the events occurring in massive starbursts are missed by current optical searches because they explode in very dusty environments. Recent mid- and far-infrared observations (see [Pérez-González et al. (2005)] and references therein) have shown that the fraction of star-formation activity that takes place in very luminous dusty starbursts sharply increases with redshift and becomes the dominant star formation component at z0.5. As a consequence, an increasing fraction of SNe are expected to be missed by high-redshift optical searches. By making reasonable assumptions on the number of SNe that can be observed by optical and near-infrared searches in the different types of galaxies (see [Mannucci et al. (2007a)] for details) we obtain the results shown in figure 6. We estimate that 5–10% of the local core-collapse (CC) SNe are out of reach of the optical searches. The fraction of missing events rises sharply toward z=1, where about 30% of the CC SNe will be undetected. At z=2 the missing fraction will be about 60%. Correspondingly, for type Ia SNe, our computations provide missing fractions of 15% at z=1 and 35% at z=2. Such large corrections are crucially important to compare the observed SN rate with the expectations from the evolution of the cosmic star formation history, and to design the future SN searches at high redshifts.
6 SN rate in cluster and field galaxies
One effect preventing a good determination of the DTD is the complex SFH of most galaxies in the local universe. A possible solution to this problem is to measure the SN rate in galaxy clusters. In these systems, most of the stellar mass is contained in elliptical galaxies, whose stellar populations are dominated by old stars (see the discussion in section 3). In principle, this significant reduction in the uncertainty in the SFH is of great help in deriving the DTD.
The cluster SN rate is also of great importance to study the metallicity evolution of the universe. The gravitational potential well of galaxy clusters is deep enough to retain in the intracluster medium (ICM) all the metals which are produced in galactic or intergalactic SNe. As a result, the metallicity of the ICM is a good measure of the integrated past history of cluster star formation and metal production. As discussed by [Renzini et al. (1993)], the measured amount of iron is an order of magnitude too high to be produced by the SN Ia exploding at the current rate. The proposed explanations of this effect include the presence of higher SN rates in the past ([Matteucci et al. (2006)]), the contribution of the intracluster stellar population ([Zaritsky et al. (2004)]), and the existence of evolving properties of star formation processes ([Maoz & Gal-Yam (2004), Loewenstein (2006)]). [Calura et al. (2007)] used the observed cosmic evolution of iron abundances to constrain the history of SN explosion, iron formation and gas stripping in galaxy clusters. They found a good agreement with the observations, especially when the “two channel” model of SNe Ia by [Mannucci et al. (2005)] is used.
There are strong motivations for measuring the cluster rates of the other physical class of SNe, the core-collapse group. The CC SNe rate per unit mass is sensitive to the IMF, because the SN explosions are due to massive stars while most of the mass is locked in low-mass stars. As a consequence, the study the CC SN rate as a function of environment is a sensitive test for any systematic difference in IMF.
Prompted by all these reason, several groups have searched for SNe in galaxy clusters ([Crane et al. (1977), Barbon (1978), Norgaard-Nielsen et al.(1989), Gal-Yam et al. (2002), Gal-Yam et al. (2003), Germany et al. (2004), Sharon et al. (2007)]) but the results are still quite sparse and based on a small number of SNe. For this reason we used the SN sample described by [Cappellaro et al. (1999)], comprising 136 SNe, to measure the SN rate in galaxy clusters, as described in [Mannucci et al. (2007b)].
A galaxy is considered to be part of a cluster if its projected distance from a known cluster is below 1.5 Mpc, and if its velocity difference in below 1000 Km/sec ([Dressler et al. (1997), Hansen et al. (2005)]). Of the 8349 galaxies of the full sample, 1666 (about 20%) belongs to clusters. The expected strong morphological segregation is well recovered, with cluster having a a much larger fraction of early-type galaxies (53%) than the field (19%). Cluster galaxies host 44 SNe (32% of the total), and field galaxies the remaining 92.
The above classification has a number of weaknesses. First, we assume that all clusters have the same radial extent, even if this is known not to be true. Second, clusters show a galaxy density that smoothly decreases with radius rather than a sharp cutoff. Third, the cluster catalog is not complete and it is possible that some clusters are missing. All these effects are likely to produce some degree of misclassification in both directions. However, any missclassification can dilute or hide an existing difference in rates, but it is unlikely to produce an artificial difference in rates or enlarge a small difference.
Figure 7 shows the resulting SN rate per unit mass as a function of galaxy morphology for cluster and field galaxies, for both CC and Ia SNe.

6.1 Core-collapse supernovae
About 36% of the cluster SNe (16 out of 44) are CC, and this allows for
the first measurement of the CC rate in galaxy cluster.
As shown in the panel b
of Figure. 7, they are hosted by the cluster
spirals and irregular galaxies, and we do not find any significant
difference in CC SN rate between cluster and field galaxies.
As a consequence, we don’t detect any difference in the IMF in the two
environments.
It should be noted that two effects
are present that could hide any intrinsic difference: 1) our determination
of galaxy membership is not perfect, as discussed above,
and 2) in clusters,
the number of CC SNe per galaxy type is small,
and only large differences of the order of 50% or more
could be significantly detected.
6.2 Type Ia supernovae
Figure 7 shows that the sharp increase of the rate from early-type to late-type galaxies and irregulars is present both in clusters and in the field. All the rates are comparable in the two environments, with the exception of early-type galaxies.
Clusters, comprising 20% of all the early-type galaxies and 49% of the total “sensitivity” (i.e., the product of stellar mass times control time) for these galaxies, contains 15 out of the 20 SN Ia events in early-type galaxies, i.e., 75% of the total sample. As a consequence, they show a higher rate ( SNuM) than field early-type galaxies ( SNuM).
The statistical significance of the rate difference can be estimated in several ways. The most straightforward is to apply the test by considering that numbers of SNe are effected by Poisson errors. The null hypothesis, i.e., the hypothesis of no rate difference between cluster and field, would predict 9.9 SNe (instead of 15) in clusters and 10.1 (instead of 5) in the field. By applying the for 1 degree-of-freedom we obtain that the statistical significance of the difference is 97.5%.
Another way to compute the statistical significance of the difference is to consider the binomial distribution of the probability of a SN in an early-type galaxy to explode in the cluster or in the field. The probability of detecting 15 SNe or more in clusters having an intrinsic probability of 49% is 1.9%, i.e., we can exclude that such a number comes from a random distribution with a confidence level higher than 98.1%, in good agreement with the previous method.
As a consequence the difference is statistically significant but not at a level above any doubt. Also, the existence of possible low-level systematics (such as non complete corrections for the differences among the different searches in the [Cappellaro et al. (1999)] sample) means that a larger number of SNe in a more homogeneous sample of galaxies are needed to confirm or exclude such an effect.
We note that the cluster SN rate do not take into account the possible contribution from intergalactic SNe, which [Gal-Yam et al. (2003)] quantified in about 20% of the total. Such an extra rate should be added to the cluster rate and not to the field one, increasing the measured difference and its statistical significance.
In principle, the dependence of the rate with environment could be just an indirect effect due to the different distribution of cluster and field galaxies according to some other property of the galaxies more directly affecting the rates. In the following, we analyze three possibly important properties: stellar mass, morphology and radio activity.
Galaxy “downsizing”, i.e. the observation that less massive systems form their stars after and more slowly than more massive systems, has recently become the standard paradigm to describe galaxy formation. The dependence of the evolutionary paths of the galaxies on stellar mass rises the possibility that specific SN Ia rate in early-type galaxies also depends on this parameter. In our case, mass does not appear to be the main driver of the rate difference, for two reasons: 1) cluster and field galaxies have similar mass distributions, with differences limited to below 10%; 2) the distribution of the number of detected SNe with galaxy mass follows closely that of the “sensitivity”, i.e., galaxies of different mass have the same SN rate per unit mass.
At variance, both radio-power and morphology appear to affect the rate, with radio-loud and S0 galaxies being more prolific than radio-quiet and elliptical galaxies, respectively. Nevertheless, in both cases the environment plays a role: both E and S0 are more active in clusters, and both radio-loud and radio-quiet galaxies have higher rates in clusters than in the field. As a consequence the environments is another parameter that independently affects the rates.
The interpretation of this possible difference in type Ia SN rate between cluster and field early-type galaxies is not straightforward. As the observed rate is the convolution of the SFH with the DTD, the differences could be due to either of these functions.
[Mannucci et al. (2005)], [Sullivan et al. (2006)], and [Aubourg et al. (2007)] have shown that SN Ia rate has a strong dependence on the parent stellar population, with younger stars producing more SNe. The difference in SN rate could be related to this effect, i.e., to a higher level of recent star formation in cluster ellipticals. Only a very small amount of younger stars are needed, because the amplitude of the DTD at short times can be hundreds of times larger than at long times. As an example, the GR83 single-degenerate model has 300 more power at yr than at yr, and this means that a recent stellar population of 0.3% in mass can provide as many SNe as the remaining 99.7% of old stars. The MDP06 “two channel” model this ratio can be as large as a factor of 1000.
The presence of small amounts of young stars in early-type galaxies, and its larger presence in cluster galaxies, is not in contrast with observations. Actually, many ellipticals shows signs of recent interactions or activity, as discussed in section 4.
If this is the correct interpretation, the “prompt” population of SNe Ia would be associated to the explosion of CC SNe from the same young stellar populations. If a SN Ia is to explode within yr from the formation of its progenitor, the primary star of the progenitor binary system must have a mass above 5.5 M⊙ to allow for the formation of a white dwarf in such a short time. [Mannucci et al. (2006)] have shown that the observed rates of type Ia SNe implied that about 7% of all stars between 5.5 and 8 M⊙ explode as “prompt” SNe Ia, while the “tardy” population corresponds to a lower explosion efficiency, about 2%, and on a much longer timescale. For a Salpeter IMF and assuming that all the stars between 8 and 40 M⊙ end up at CC SNe, we expect 1.3 CC SNe for each “prompt” type Ia. Assuming that the difference between cluster and field early-type galaxies is due to the “prompt” SNe Ia, the rate of this population is of the order of 0.066-0.019=0.047 SNuM. Converting this rate in observed number, about 2 CC SNe are expected in the cluster early-type galaxies of our sample, consistent with our null detection at about 1.3 level. We conclude that the non detection of CC in the early-type galaxies belonging to our sample is consistent with the hypothesis of a “prompt” Ia component. We also note that a few well-classified CC SNe have been discovered in the recent past in prototypical Ellipticals, such as the type Ib SN 2000ds in NGC2768.
A second possible interpretation is that the higher rate in cluster early-type galaxies is related to differences in the DTD. If the stars in ellipticals are 9-12 Gyrs old (see, for example, [Mannucci et al. (2001)]), the SN rate is dominated by the tail of the DTD at long times. Differences in the environments could produce small differences in the shape of this function. For example, during a galaxy-galaxy encounter or merging, the small number of close gravitational interaction between a binary systems and a star of the other galaxy could sometime produce the shrinking of the separation of old binary systems. With simple order-of-magnitude considerations we estimate that such an effect is likely to give a small, but possibly non-negligible, contribution. Only a few percent of the binary systems give rise to a SN during a Hubble time, and only a small fraction of them explode more then 8 Gyr after formation. Therefore such a mechanism would be effective even if is it is able to shrink a small fraction of binary systems, of the order of 0.5%. It is also possible that new binary systems are created during the interaction, or that isolated white dwarf accreted gas of the other galaxy. These effects could be more efficient in clusters, where the volume density of the galaxies is larger.
An interesting possibility is also that the changes in the DTD are related to differences in metallicity between cluster and field early-type galaxies, as discussed by [Sánchez-Blázquez et al.(2006), Bernardi et al. (2006), Collobert et al.(2006)] and [Prieto et al.(2007)]. The differences between cluster and field galaxies presented by these authors are neither large nor always in the same direction. Nevertheless systematic, although not large, differences in metallicity could be present and produce significant changes in the DTD, for example, by affecting the efficiency of mass loss during the complex life of a binary system.
7 Summary and conclusions
We have reviewed the deep relations between SN rate and stellar populations. All the observations available for CC SNe confirm that these SNe derive from young massive stars. Nevertheless, the use of the CC SN rate as a measure of star formation requires a good knowledge of dust extinction which is expected to vary rapidly with cosmic time. Current observations of the SN rates in different classes of galaxies show that SNe Ia derive from both young and old stellar systems, and between 10% (weak bimodality) and 50% (strong bimodality) of the events must explode within yrs after formation. Whether this is due to the presence of two different channels of explosion (such as single- and double-degenerate) or to a bimodal distribution of some parameter of the exploding systems (such as the mass ratio between the two stars of the binary system) is currently not known.
Acknowledgements.
Most of the results described here were obtained in collaboration with N. Panagia, M. Della Valle, D. Maoz, K. Sharon, M. T. Botticella, and A. Gal-Yam, to whom I am deeply indebted.References
- [Aubourg et al. (2007)] Aubourg, E., Tojeiro, R., Jimenez, R., Heavens, A., Strauss, M. A., & Spergel, D. N., 2007, ApJ, in press (arXiv:0707.1328)
- [Barris & Tonry (2006)] Barris, B. J., & Tonry, J. L. 2006, ApJ, 637, 427
- [Bernardi et al. (2006)] Bernardi, M., Nichol, R. C., Sheth, R. K., Miller, C. J., & Brinkmann, J. 2006, AJ, 131, 1288
- [Bianchi & Schneider (2007)] Bianchi, S., & Schneider, R., 2007, MNRAS, in press (arXiv:0704.0586)
- [Barbon (1978)] Barbon, R. 1978, AJ, 83, 13
- [Belczynski et al. (2005)] Belczynski, K., Bulik, T., & Ruiter, A., 2005 ApJ, 629, 915
- [Botticella et al. (2007)] Botticella, M. T., et al., 2007, submitted.
- [Bruzual & Charlot (2003)] G. Bruzual & S. Charlot, 2003, MNRAS, 341, 33
- [Calura et al. (2007)] Calura, F., Matteucci, F., & Tozzi, P. 2007, MNRAS, in press.
- [Cappellaro et al. (1999)] Cappellaro, E., Evans, R., & Turatto, M., 1999, A&A, 351, 459
- [Colbert et al. (2001)] Colbert, J. W., et al., 2001, AJ, 121, 808
- [Crane et al. (1977)] Crane, P., Tammann, G. A., & Woltjer, L. 1977, Nature, 265, 124
- [Collobert et al.(2006)] Collobert, M., Sarzi, M., Davies, R. L., Kuntschner, H., & Colless, M. 2006, MNRAS, 370, 1213
- [Cresci et al. (2007)] Cresci, G., Mannucci, F., Della Valle, M., & Maiolino, R. 2007, A&A, in press (astro-ph/0610783)
- [Dahlen et al. (1999)] Dahlen, T., & Fransson, C., 1999 A&A, 350, 349
- [Dahlen et al. (2004)] Dahlen, T., et al. 2004, ApJ, 613, 189
- [Della Valle & Panagia(2003)] Della Valle, M., & Panagia, N. 2003, ApJl, 587, L71
- [Della Valle et al. (2005)] Della Valle, M., Panagia, N., Padovani, P., Cappellaro, E., Mannucci, F., Turatto, M., 2005, ApJ, 629, 750
- [Dressler et al. (1997)] Dressler, A., et al. 1997, ApJ, 490, 577
- [Ferreras et al. (2006)] Ferreras, I., Pasquali, A., de Carvalho, R. R., de la Rosa, I. G., & Lahav, O. 2006, MNRAS, 370, 828
- [Förster et al. (2006)] Förster, F., Wolf, C., Podsiadlowski, Ph, & Han, Z., 2006, MNRAS, 368, 1893
- [Gal-Yam et al. (2002)] Gal-Yam, A., Maoz, D., & Sharon, K. 2002, MNRAS, 332, 37
- [Gal-Yam et al. (2003)] Gal-Yam, A., Maoz, D., Guhathakurta, P., & Filippenko, A. V. 2003, AJ, 125, 1087
- [Gal-Yam & Maoz (2004)] Gal-Yam, A., & Maoz, D. 2004, MNRAS, 347, 942
- [Germany et al. (2004)] Germany, L. M., Reiss, D. J., Schmidt, B. P., Stubbs, C. W., & Suntzeff, N. B. 2004, A&A, 415, 863
- [Greggio & Renzini (1983)] Greggio, L., & Renzini, A., 1983, A&A, 118, 217
- [Greggio (2005)] Greggio, L., 2005, A&A, 441, 1055
- [Haines et al. (2007)] Haines, C. P., Gargiulo,A., & Merluzzi, P., 2007, MNRAS, in press (arXiv:0707.2361)
- [Hansen et al. (2005)] Hansen S. M., McKay T. A., Wechsler R. H., Annis J., Sheldon E. S., & Kimball A., 2005, ApJ, 633, 122
- [Hopkins & Beacom (2006)] Hopkins, A. M., & Beacom, J., F., 2006, ApJ, 651, 142
- [Lonsdale et al. (2006)] C. J. Lonsdale et al., 2006, ApJ, 647, 185
- [Loewenstein (2006)] Loewenstein, M. 2006, ApJ, 648, 230
- [Madau et al. (1998)] Madau, P., Della Valle, M. & Panagia, N., 1998, MNRAS, 297, 17
- [Maiolino et al. (2002)] Maiolino, R., Vanzi, L., Mannucci, F., Cresci, G., Ghinassi, F., Della Valle, M. 2002, A&A, 389, 84
- [Maiolino et al. (2004a)] Maiolino, R., Schneider, R., Oliva, E., Bianchi, S., Ferrara, A., Mannucci, F., Pedani, M., & Roca Sogorb, M. 2004a, Nature, 431, 533
- [Maiolino et al. (2004b)] Maiolino, R., Oliva, E., Ghinassi, F., Pedani, M., Mannucci, F., Mujica, R., & Juarez, Y. 2004b, A&A 420, 889
- [Mannucci et al. (2001)] Mannucci, F., Basile, F., Poggianti, B. M., Cimatti, A., Daddi, E., Pozzetti, L., & Vanzi, L. 2001, MNRAS, 326, 745
- [Mannucci et al. (2003)] Mannucci, F., Maiolino, R., Cresci, G, et al., 2003, A&A, 401, 519
- [Mannucci et al. (2005)] Mannucci, F., Della Valle, M., Panagia, N., et al., 2005, A&A, 433, 807
- [Mannucci et al. (2006)] Mannucci, F., Della Valle, M., & Panagia, N., 2006, MNRAS, 370, 773
- [Mannucci et al. (2007a)] Mannucci, F., Della Valle, M., & Panagia, N. 2007, MNRAS, 377, 1229
- [Mannucci et al. (2007b)] Mannucci, F., et al., 2007, MNRAS, submitted
- [Maoz & Gal-Yam (2004)] Maoz, D., & Gal-Yam, A. 2004, MNRAS, 347, 951
- [Matteucci & Recchi (2001)] Matteucci, F., & Recchi, S. 2001, ApJ, 558, 351
- [Matteucci & Greggio (1986)] Matteucci, F., & Greggio, L., 1986, A&A, 154, 279
- [Matteucci et al. (2006)] Matteucci, F., Panagia, N., Pipino, A., Mannucci, F., Recchi, S., & Della Valle, M. 2006, MNRAS, 372, 265
- [Mattila et al. (2007)] Mattila, S., et al. 2007, ApJL, 659, L9
- [Minkowski (1941)] R. Minkowski, 1941, PASP, 53, 224
- [Morganti et al. (2006)] Morganti, R., et al., 2006, MNRAS, 371, 157
- [Neill et al. (2006)] Neill, J. D., et al. 2006, AJ, 132, 1126
- [Norgaard-Nielsen et al.(1989)] Norgaard-Nielsen, H. U., Hansen, L., Jorgensen, H. E., Aragon Salamanca, A., & Ellis, R. S. 1989, Nature, 339, 523
- [Pain et al. (2002)] Pain, R., et al., 2002, ApJ, 577, 120
- [Pérez-González et al. (2005)] P. G. Pérez-González et al., 2005, ApJ, 630, 82
- [Prieto et al.(2007)] Prieto, J. L., Stanek, K. Z., & Beacom, J. F. 2007, ApJ, in press (arXiv:0707.0690)
- [Renzini et al. (1993)] Renzini, A., Ciotti, L., D’Ercole, A., & Pellegrini, S. 1993, ApJ, 419, 52
- [Poznanski et al. (2007)] Poznanski, D., et al., 2007, MNRAS, in press (arXiv:0707.0393)
- [Sánchez-Blázquez et al.(2006)] Sánchez-Blázquez, P., Gorgas, J., Cardiel, N., & González, J. J. 2006, A&A, 457, 809
- [Sarzi et al. (2006)] Sarzi, M., et al., 2006, MNRAS, 366, 1151
- [Sharon et al. (2007)] Sharon, K., Gal-Yam, A., Maoz, D., Filippenko, A. V., & Guhathakurta, P. 2007, ApJ, 660, 1165
- [Sullivan et al. (2006)] Sullivan, M., et al., 2006, ApJ, 648, 868
- [Scannapieco & Bildsten (2005)] Scannapieco, E., & Bildsten, L. 2005, ApJL, 629, L85
- [Scannapieco et al. (2006)] Scannapieco, C., Tissera, P. B., White, S. D. M., & Springel, V. 2006, MNRAS, 371, 1125
- [Schawinski et al. (2007)] K. Schawinski et al., 2007, ApJ, in press (astro-ph/0601036)
- [Sharon et al. (2006)] Sharon, K., et al. 2006, in ”The Multicoloured Landscape of Compact Objects and their Explosive Origins”, Cefalu, Italy, June 2006, to be published by AIP, Eds. L. Burderi et al. (astro-ph/0611920)
- [Sharon et al.(2007)] Sharon, K., Gal-Yam, A., Maoz, D., Filippenko, A. V., & Guhathakurta, P. 2007, ApJ, 660, 1165
- [Sullivan et al. (2006)] Sullivan, 2006
- [Tornambè & Matteucci (1986)] Tornambè, A., & Matteucci, F. 1986, MNRAS, 223, 69
- [Tornambè (1989)] Tornambè, A. 1989, MNRAS, 239, 771
- [Tutukov & Yungelson (1994)] Tutukov, A. V., & Yungelson, L. R. 1994, MNRAS, 268, 871
- [van den Bergh (1959)] S. van den Bergh, 1959, AnAp, 22, 123
- [van Dokkum (2005)] van Dokkum, P., 2005, AJ, 130, 264
- [Yungelson & Livio (2000)] Yungelson, L. R., & Livio, M., 2000, ApJ, 528, 108 (YL00)
- [Yungelson (2005)] Yungelson, L. R. 2005, Astrophysics and Space Science Library, 332, 163
- [Welch & Sage (2003)] Welch, G. A., & Sage, L. J., 2003, ApJ, 584, 260
- [Zaritsky et al. (2004)] Zaritsky, D., Gonzalez, A. H., & Zabludoff, A. I. 2004, ApJL, 613, L93