Type Ia and II supernovae contributions
to the metal enrichment
in intra-cluster medium observed with Suzaku
Abstract
We studied the properties of the intra-cluster medium (ICM) in two clusters of galaxies (AWM 7 and Abell 1060) and two groups (HCG 62 and NGC 507) with the X-ray Observatory Suzaku. Based on spatially resolved energy spectra, we measured for the first time precise cumulative ICM metal masses within 0.1 and . Comparing our results with supernova nucleosynthesis models, the number ratio of type II (SNe II) to type Ia (SNe Ia) is estimated to be , assuming the metal mass in the ICM is represented by the sum of products synthesized in SNe Ia and SNe II. Normalized by the K-band luminosities of present galaxies, and including the metals in stars, the integrated number of past SNe II explosions is estimated to be close to or somewhat higher than the star formation rate determined from Hubble Deep Field observations.
1 Introduction
The elemental abundance of the intra-cluster medium (ICM) gives us important clues for understanding the chemical history and evolution process of clusters of galaxies. Because clusters are the largest gravitationally bound systems in the universe, they are expected to confine all the metals provided by member galaxies since the cluster formed. The amount of each metal in the ICM is almost equal to the integrated sum of that synthesized by supernovae type Ia (SNe Ia) and type II (SNe II). The expected elemental products of each type have been intensively studied by several authors (Iwamoto et al., 1999; Nomoto et al., 2006). X-ray measurements of the mass of each element in the ICM enable us to examine the past occurrence numbers and the ratio of SNe II to SNe Ia. These numbers also reflect the past stellar initial mass function (IMF) and star formation rate (SFR) in clusters.
ASCA first measured metal distributions in the ICM (Mushotzky et al., 1996; Fukazawa et al., 1998, 2000), and Dupke & White (2000) and Baumgartner et al. (2005) investigated the contributions from SNe Ia and SNe II to the ICM. Recent X-ray observations with XMM-Newton determined the spatial distribution and elemental abundance pattern of the ICM metals (Matsushita et al., 2003, 2007b; Tamura et al., 2004; Böhringer et al., 2005; de Plaa et al., 2006, 2007; Werner et al., 2006). However, the abundance profiles in the outer regions of clusters are still poorly constrained, especially for O and Mg which are major SNe II products, because of the intense intrinsic Al-K backgrounds and the non-Gaussian line profiles of previous missions in the energy range below 1 keV. Based not only on the low and stable background but also on the good sensitivity to emission lines below keV of the Suzaku XIS (Koyama et al., 2007), a reliable determination of O and Mg abundances to cluster outer regions has become feasible (Matsushita et al., 2007a; Sato et al., 2007a).
We use km s-1 Mpc-1 = , , and the virial radius is assumed Mpc (Markevitch et al., 1998) in this paper. Errors are 90% confidence region for a single interesting parameter.
| Object | / / | Region | SNe Ia Model | / | /dof | |
|---|---|---|---|---|---|---|
| AWM 7 | 0.01724 | W7 | 12.6/3 | |||
| 3.5 keV | W7 | 15.9/3 | ||||
| 1.65 Mpc | WDD1 | 35.5/3 | ||||
| WDD2 | 20.5/3 | |||||
| A 1060 | 0.0114 | W7 | 4.5/3 | |||
| 3.0 keV | W7 | 8.5/3 | ||||
| 1.53 Mpc | WDD1 | 16.0/3 | ||||
| WDD2 | 10.2/3 | |||||
| NGC 507 | 0.01646 | W7 | 6.6/3 | |||
| 1.5 keV | W7 | 11.7/3 | ||||
| 1.08 Mpc | WDD1 | 22.0/3 | ||||
| WDD2 | 13.1/3 | |||||
| HCG 62 | 0.0145 | W7 | 4.2/3 | |||
| 1.5 keV | W7 | 3.0/3 | ||||
| 1.08 Mpc | WDD1 | 12.7/3 | ||||
| WDD2 | 4.8/3 |

2 Metal mass determination
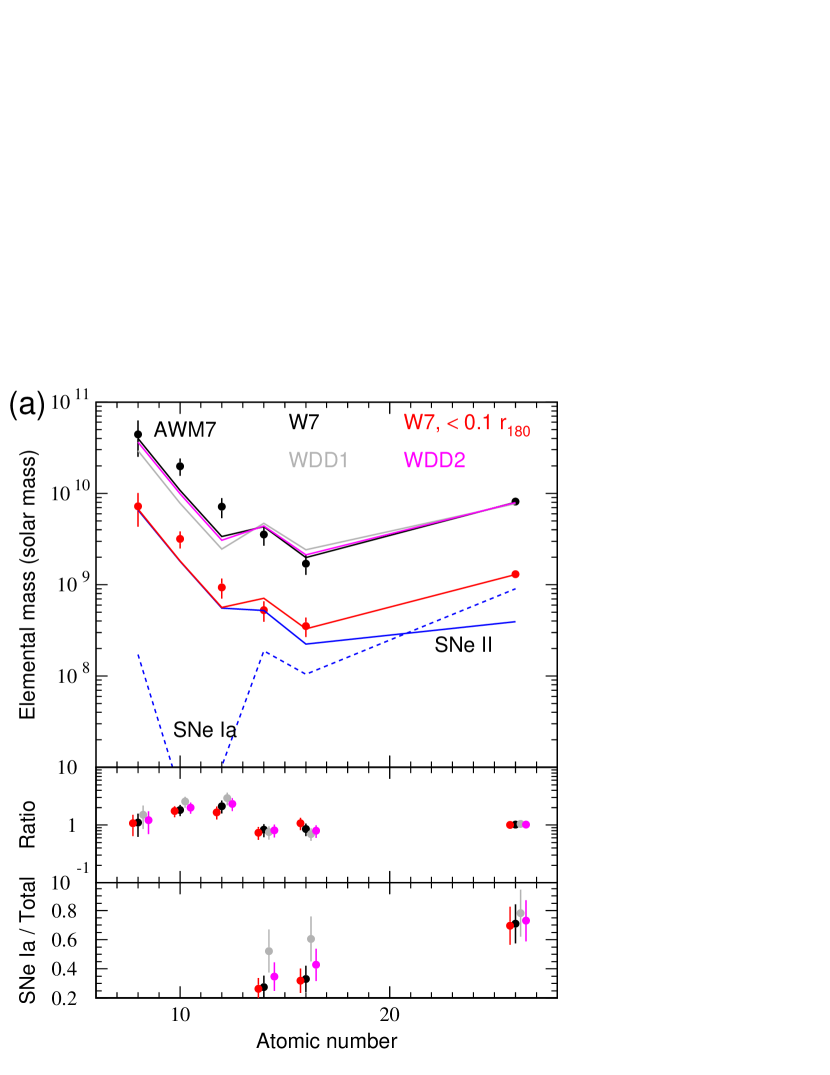
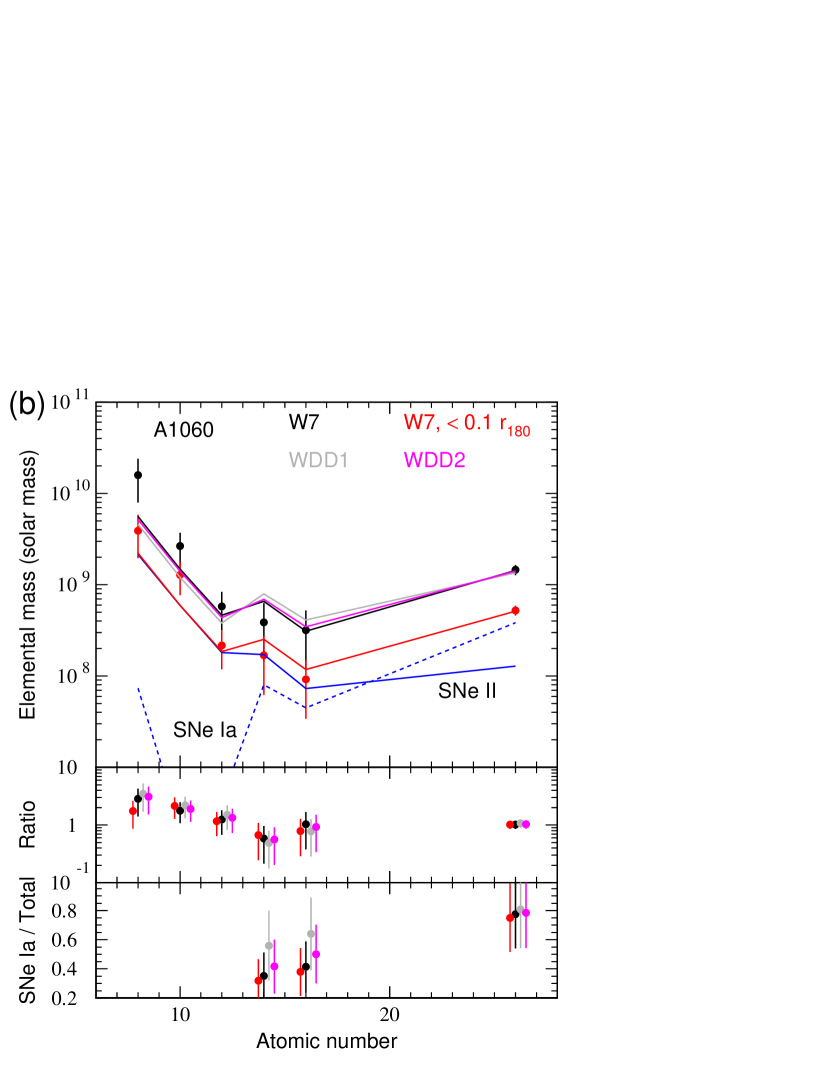
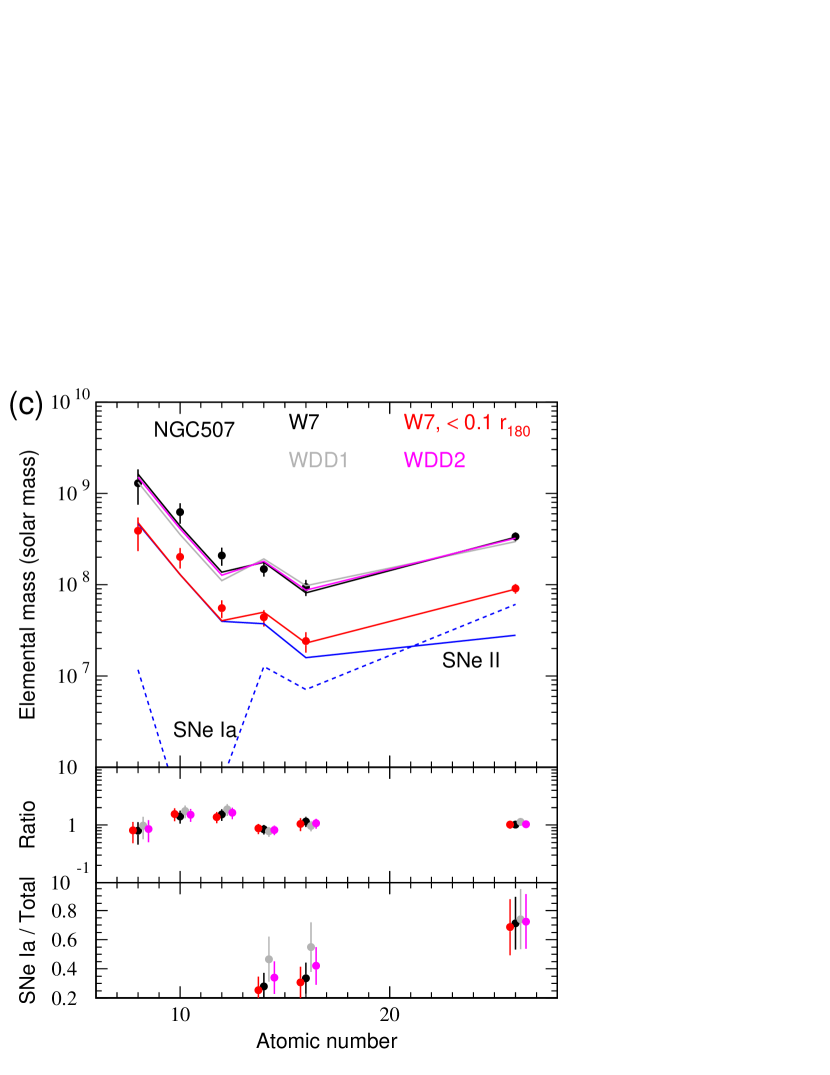
We selected two clusters, AWM 7 and Abell 1060 (hereafter A 1060), and two groups, HCG 62 and NGC 507, that were observed with Suzaku. Detailed information and the analysis method for each object are described in Sato et al. (2007a, b, c) and Tokoi et al. (2007). We excluded Ni and Ne abundances in our analysis in this paper since these two elements were not reliably determined due to the strong and complex Fe-L line emissions. For the first time, we determined the radial abundance profiles of O, Mg, Si, S and Fe, out to for each object. Note that the O abundance in the ICM is strongly affected by the foreground Galactic emission, because we cannot resolve the cluster and local lines. Combining the abundance profile obtained with Suzaku and the X-ray luminous gas mass profile with XMM-Newton, we calculated cumulative metal mass within and the whole observed region (table 1). Errors of the metal mass plotted in figure 1 are taken from the statistical errors of each elemental abundance in the spectral fits at .
3 Deconvolution of elemental mass patterns with SNe yields
3.1 Mass products by SNe Ia and II
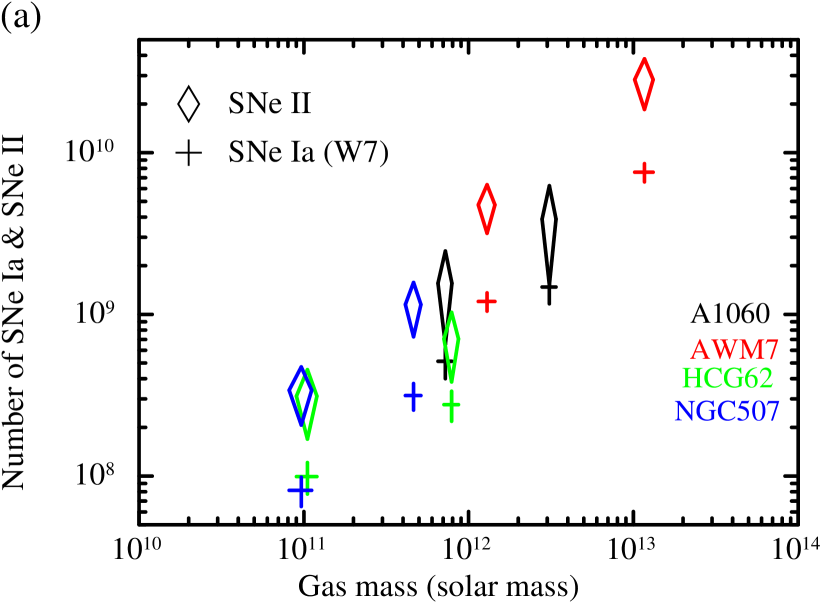
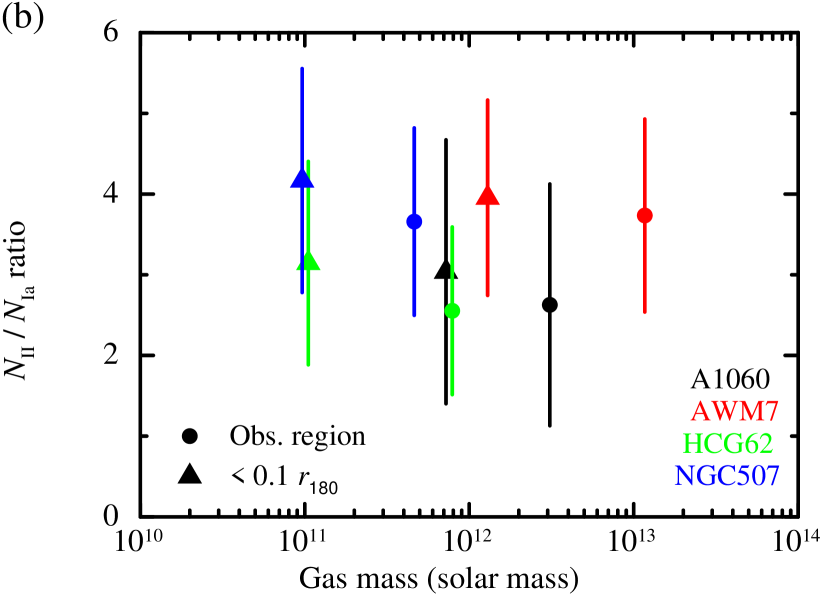
In order to examine the SNe Ia and SNe II contribution to the ICM metals, the elemental mass pattern of O, Mg, Si, S and Fe was examined within and the whole observed region. The mass patterns were fit by a combination of average SNe Ia and SNe II yields per supernova, as shown in figure 1. The fit parameters were chosen to be the integrated number of SNe Ia () and the number ratio of SNe II to SNe Ia (), because could be well constrained due to relatively small errors in the Fe abundance. The SNe Ia and II yields were taken from Iwamoto et al. (1999) and Nomoto et al. (2006), respectively. We assumed a Salpeter IMF for stellar masses from 10 to 50 with the progenitor metallicity of for SNe II, and W7, WDD1 or WDD2 models for SNe Ia. Table 1 and figure 2 summarizes the fit results.
All the objects exhibit similar features. The abundance patterns were better represented by the W7 SNe Ia yield model rather than WDD1. The number ratio of SNe II to SNe Ia with W7 is , while the ratio with WDD1 is . The WDD2 model gave quite similar results as W7. Almost 3/4 of the Fe and of the Si is synthesized by SNe Ia, in the W7 model, as demonstrated in lower panels of figure 1. We also examined the SNe II yields with in Nomoto et al. (2006), and the results tended to show smaller ratios by % and larger values. Somewhat earlier estimates of SNe II yields summarized in Iwamoto et al. (1999) are between and , but our values are almost the same with those of . The values in Table 1 imply that the fit to the data and the ratio behave in a similar manner for different supernova models between and .
We note that most of the fits were not formally acceptable based on the values in table 1. The 90% and 99% confidence values for 3 degrees of freedom are and 11.34, respectively. The models adapted here are probably too simplified, such as assumptions of uniform IMF and SNe yields at all times, spherical symmetry in the ICM, and rather crude treatment of the Galactic emission, etc. For example, a flatter slope of the IMF than Salpeter tends to yield a larger amount of O. It is notable that the observed amount of Mg is about twice as much as the model prediction for AWM7 and NGC 507, similar to the feature reported by Werner et al. (2006b) for M 87.
3.2 Comparison with other studies
de Plaa et al. (2007) also found that the number ratio of core-collapse SNe (SNe II+Ib+Ic) to SNe Ia (using W7) is , based on XMM-Newton observations of 22 clusters within for elements between Si and Ni. They also examined the fit including the average O and Ne abundances for two clusters observed with the XMM Reflection Grating Spectrometers (RGS), however RGS observations are limited to the central cluster region where the abundance is strongly affected by the cD galaxy. The number ratio of SNe II to SNe Ia they have obtained is consistent with our results.
Tsujimoto et al. (1995) determined that the number ratio of SNe II to SNe Ia for our Galaxy is based on stellar metallicity, while it is 3.3–5 for the Large and Small Magellanic Clouds. These results are slightly higher than those for our clusters and groups. It is plausible that spiral galaxies in the Local Group maintain star forming activity until recently. We also note that our results are derived for metals only in the ICM, therefore metals in member galaxies (including stars) which accounts for % of the total are not considered.
3.3 SNe II per unit galaxy luminosity
| (Mpc-3) | ( Mpc-3) | () | |
| HDF | 4.0 | 2.5 | |
| AWM 7∗ | 5.4 | 4.1 | |
| A 1060∗ | 5.1 | 1.6 | |
| ∗ For AWM 7 and A 1060, the number of SNe II is estimated from the metals of the ICM, not including the member galaxies and stars. | |||
Based on the luminosity function at high redshift, the star formation history of the universe has been studied. Madau et al. (1998) derived a simple stellar evolution model for field galaxies in the Hubble Deep Field (HDF). The SFR rises sharply, by about an order of magnitude, from the present to a peak value in the range 0.12–0.17 yr-1 Mpc-3 at . Mannucci et al. (2007) and Nagamine et al. (2006) also derived the cosmic star formation history from various observations, with no correction for dust extinction in cosmology of and .
If we assume the maximum SFR is 0.1 yr-1 Mpc-1 and integrate it over a Hubble time, the total produced stellar mass is Mpc-1. Supposing a Salpeter IMF between 10–50 , estimated number of SNe II per unit volume is Mpc-3 for field galaxies. When we scale our cluster results only by volume, the normalized numbers of SNe II within 0.1 for AWM 7 and A 1060 are and Mpc-3, respectively. These factors of discrepancies are primarily caused by the difference in the number of galaxies between the field and clusters. We therefore scale these results with the K-band luminosity density as summarized in table 2. Using an average luminosity density Mpc-3 in Cole et al. (2005), the normalized number of SNe II per unit galaxy luminosity is for field galaxies. The galaxy luminosity densities of AWM 7 and A 1060 are taken from the Two Micron All Sky Survey.111 The database address: http://www.ipac.caltech.edu/2mass/ As shown in table 2, the numbers of SNe II per unit luminosity in the clusters are quite consistent with the above value independently estimated from the star formation history. However, this estimate considers only the ICM metals, and inclusion of stellar metals would roughly double the required SNe II rate. Even though systematic uncertainty in this simple estimation may account for most of the factor of two difference, it is interesting that X-ray metals suggest incompleteness in the optical detection of distant star formation. Also, an environmental difference between fields and clusters may be of relevance.
References
- Baumgartner et al. (2005) Baumgartner, W. H., Loewenstein, M., Horner, D. J., & Mushotzky, R. F. 2005, ApJ, 620, 680
- Böhringer et al. (2005) Böhringer, H., Matsushita, K., Finoguenov, A., Xue, Y., & Churazov, E. 2005, Advances in Space Research, 36, 677
- Cole et al. (2005) Cole, S., et al. 2005, MNRAS, 362, 505
- de Plaa et al. (2007) de Plaa, J., Werner, N., Bleeker, J. A. M., Vink, J., Kaastra, J. S., & Méndez, M. 2007, A&A, 465, 345
- de Plaa et al. (2006) de Plaa, J., et al. 2006, A&A, 452, 397
- Dupke & White (2000) Dupke, R. A., & White, R. E., III 2000, ApJ, 528, 139
- Fukazawa et al. (2000) Fukazawa, Y., Makishima, K., Tamura, T., Nakazawa, K., Ezawa, H., Ikebe, Y., Kikuchi, K., & Ohashi, T. 2000, MNRAS, 313, 21
- Fukazawa et al. (1998) Fukazawa, Y., Makishima, K., Tamura, T., Ezawa, H., Xu, H., Ikebe, Y., Kikuchi, K., & Ohashi, T. 1998, PASJ, 50, 187
- Iwamoto et al. (1999) Iwamoto, K., Brachwitz, F., Nomoto, K., Kishimoto, N., Umeda, H., Hix, W. R., & Thielemann, F.-K. 1999, ApJS, 125, 439
- Koyama et al. (2007) Koyama, K., et al. 2007, PASJ, 59, 23
- Madau et al. (1998) Madau, P., Pozzetti, L., & Dickinson, M. 1998, ApJ, 498, 106
- Mannucci et al. (2007) Mannucci, F., Buttery, H., Maiolino, R., Marconi, A., & Pozzetti, L. 2007, A&A, 461, 423
- Markevitch et al. (1998) Markevitch, M., et al. 1998, ApJ, 503, 77
- Mushotzky et al. (1996) Mushotzky, R., Loewenstein, M., Arnaud, K. A., Tamura, T., Fukazawa, Y., Matsushita, K., Kikuchi, K., & Hatsukade, I. 1996, ApJ, 466, 686
- Matsushita et al. (2007a) Matsushita, K., et al. 2007a, PASJ, 59, 327
- Matsushita et al. (2007b) Matsushita, K., Böhringer, H., Takahashi, I., & Ikebe, Y. 2007b, A&A, 462, 953
- Matsushita et al. (2003) Matsushita, K., Finoguenov, A., Böhringer, H. 2003, A&A, 401, 443
- Nagamine et al. (2006) Nagamine, K., Ostriker, J. P., Fukugita, M., & Cen, R. 2006, ApJ, 653, 881
- Nomoto et al. (2006) Nomoto, K., Tominaga, N., Umeda, H., Kobayashi, C., & Maeda, K. 2006, Nuclear Physics A, 777, 424
- Sato et al. (2007a) Sato, K., et al. 2007a, PASJ, 59, 299
- Sato et al. (2007b) Sato, K., Matsushita, K., Ishisaki, Y., Yamasaki, N. Y., Ishida, M. Sasaki, S., & Ohashi, T., 2007b, PASJ in press, arXiv:0707.4342
- Sato et al. (2007c) Sato, K., et al. 2007c, in preparation
- Tamura et al. (2004) Tamura, T., Kaastra, J. S., den Herder, J. W. A., Bleeker, J. A. M., & Peterson, J. R. 2004, A&A, 420, 135
- Tokoi et al. (2007) Tokoi, K., et al. 2007, in preparation
- Tsujimoto et al. (1995) Tsujimoto, T., Nomoto, K., Yoshii, Y., Hashimoto, M., Yanagida, S., & Thielemann, F.-K. 1995, MNRAS, 277, 945
- Werner et al. (2006) Werner, N., de Plaa, J., Kaastra, J. S., Vink, J., Bleeker, J. A. M., Tamura, T., Peterson, J. R., & Verbunt, F. 2006a, A&A, 449, 475
- Werner et al. (2006b) Werner, N., Böhringer, H., Kaastra, J. S., de Plaa, J., Simionescu, A., & Vink, J. 2006b, A&A, 459, 353