The flow rate of granular materials through an orifice
Abstract
The flow rate of grains through large orifices is known to be dependent on its diameter to a power law. This relationship has been checked for big outlet sizes, whereas an empirical fitting parameter is needed to reproduce the behavior for small openings.
In this work, we provide experimental data and numerical simulations covering a wide span of outlet sizes, both in three and two dimensions. This allows us to show that the laws that are usually employed are satisfactory only if a small range of openings is considered. We propose a new law for the mass flow rate of grains that correctly reproduces the data for all the orifice sizes, including the behaviors for very large and very small outlet sizes.
I Introduction
The flow of granular materials through an orifice has been widely studied during decades due to the great interest for industrial applications ranging from silos to hoppers Nedderman1 ; Tuzun ; Savage ; Tighe . Contrary to the fluids, when a silo is discharged by gravity, the flow rate does not depend on the height of the granular layer. Indeed, when the thickness of the layer is greater than a value close to times the diameter of the silo, the pressure at the bottom of the silo saturates due to the Janssen effect and hence, the flow rate remains about constant. In a first order approximation it has also been shown that the flow rate is independent on the diameter of the silo if two conditions are fulfilled: is greater than 2.5 times the diameter of the outlet orifice and also greater than , where is the diameter of the particle Nedderman1 .
The most widely accepted law that predicts the flow rate of grains through an orifice and its dependence on different parameters was proposed by Beverloo et al. Beverloo1 and has the form:
| (1) |
where is the average mass discharge rate through the orifice, and are empirical discharge and shape coefficients respectively, is the apparent density, and is the acceleration of gravity. As may depend on the friction coefficient, sometimes this is explicitly stated by writing . Equation (1) is known as the Beverloo law and its validity has been tested for mono-sized granular samples with larger than 0.5 mm and big enough to avoid intermittencies in the flow due to jamming. This means that the flow rate of grains through orifices has been found to follow the Beverloo law only for , well beyond the critical value below which the flow can be interrupted due to the formation of arches or domes Zuriguel1 .
One of the most interesting issues concerning Eq. (1) is the dependence of the flow rate with a power of the diameter of the orifice. This relationship can be obtained by dimensional analysis and can be physically explained if it is assumed that the granular flow is driven by the behavior of grains near the outlet. Following this line of reasoning, it seems plausible to believe that, just above the outlet, there is a free-fall zone limited by an arch. Above the arch the grains are well packed and their velocities are negligible, whereas below the arch the particles accelerate freely under the influence of the gravity. If the characteristic size of this arch is somehow proportional to the radius of the orifice, the velocity of the grains through the outlet of the silo is the one corresponding to a particle falling without initial velocity from a distance proportional to the radius of the outlet. A primary consequence of this assumption is that the velocity of the grains is proportional to and therefore the flow rate proportional to . An equivalent equation to Eq. (1) can be easily derived for the two dimensional case and a flow dependence on the diameter of the silo of is obtained.
The Beverloo law, and particularly the power dependence of the flow rate on the diameter of the orifice, has been found to be robust for different kind of particles, independently of their packing fraction, density, surface properties or shape Hirshfeld ; Hirshfeld2 for . It is also remarkable that this equation can describe the flow rate of grains through orifices for different flow patterns developed inside the silo, i.e. massic flow, funnel flow or mixed flow. A modification has been implemented for the flow of powders when the size of the particle is smaller than 0.5 mm. In this case a term should be included in equation (1) to reproduce the effect of the pressure gradient generated by the air passing through the interstices between the grains. Other modifications have been developed to predict the solid discharge rate for binary mixtures Tuzun ; Humby and even the dense flow of air bubbles in a two dimensional silo Vandewalle .
Despite the above mentioned robustness of the Beverloo law and the fact that has been successfully used by engineers since 1961, the basic physical principles behind the flow of grains through an orifice remain elusive and the two empirical coefficients ( and ) are required to be determined experimentally for every single kind of grains and container properties. The value of , the so-called discharge coefficient, depends on the bulk density and it was found to be in a range of by Beverloo et al Beverloo1 . The shape coefficient is generally agreed to be dependent on the particle shape as well as the slope of the hopper. However the meaning and origin of the term has provoked a great controversy. The first and most widely accepted interpretation of this term was done by Brown and Richards BrownandRichards who claim that the centers of the particles cannot approach the edge of the orifice within a distance of . Therefore the particle centres must pass through a effective orifice of diameter . The value of has been found to be independent of the size of the particle Nedderman2 in a range of depending on the particle and hopper properties. Yet there are some exceptions, like the flow of sand, where the value of turns to be . However, Zhang and Rudolph Zhang claim that the only plausible value for is 1 and propose an alternative expression where a new term is introduced. The value of depends on and physically represents the effect on the flow rate of shear friction between flowing and non-flowing particles at the edges of the orifice.
The experimental and numerical studies where the flow rate has been found to be in a reasonably good agreement with the Beverloo fit are abundant in the literature. Yet it is difficult to find any work where the flow rate is measured covering, at least, two decades of outlet sizes. Some of the works deal with very big orifices in real silos where the value of has only a weak influence in the fit, whereas others explore the region of small orifices but do not reach high values of Hirshfeld2 . This fact may lead to a misinterpretation of the results as the fit may seem suitable just because the range of considered is not large enough and the values of and are chosen arbitrarily. In this work we will show that if the flow rate is measured for a wide range of orifice sizes, the equation (1) is not able to describe the whole behavior as different values of and must be used for big and small orifices. In order to solve this problem a new expression for the flow rate is proposed where the constant is altogether eliminated. The new equation is able to fit the experimental results of the flow rate for diameters of the orifice ranging from to times the diameter of the particle. Furthermore with this modification it is also reproduced the behavior of the flow rate for very small orifices, when the flow is not continuous due to arch formation. Its validity has been checked using different kind of particles in three and two dimensional experiments as well as in two dimensional molecular dynamics simulations.
The manuscript is organized as follows. In the first section a description of the experimental setup and simulation techniques is presented. The method used to measure the flow of grains is discussed for both big and small orifices. In the next section the numerical results in two dimensions and the experimental results in two and three dimensions are reported. Different fits of Eq. (1) will be displayed to stress that it is unable to fit the flow rate for the whole range of outlet sizes. Then, after measuring the deviations from the Beverloo proposal, we introduce a modification consisting on the elimination of the parameter and the correction of by a multiplicative term. Finally we show that this corrective factor may have its physical origin in a dependence of either the velocity or the apparent density near the outlet of the silo.
II Methods and materials
In order to investigate the flow through a small orifice under the action of gravity, two scaled silos have been built. One of them is cylindrical, and the other is two-dimensional (the beads are contained between two glass panes so as to provide direct optical access to the particles inside). Numerical simulations using molecular dynamics have also been performed. In the following subsections a description for the procedures used in each case is provided.
II.1 Three dimensional silo
The experimental setup for the three dimensional silo was described in detail in a former article Zuriguel2 . It consists of an scaled, automated cylindrical container with an orifice in the base. The silo is made of stainless steel, but vessels made of glass were also used whenever observation of the particles was required. The size of the silo is such that its finite size can be neglected. Moreover, the level of the granular matter contained in it was never allowed to descend below a certain level (about twice the silo diameter) to ensure that the pressure at the base was approximately constant due to the Janssen effect, as explained above. The piece forming the flat bottom of the silo is changeable. This allows us to modify the size of the outlet, which ranges from to mm. The granular material falls through the orifice and is collected in a box placed on a scales. Eventually the particles can get jammed. Let us call an avalanche the ensemble of particles fallen between two jamming events. The size of the avalanche is calculated by dividing the weight of the avalanche by the weight of one bead. The time that the particles have been flowing is measured by means of a microphone that registers the noise made by the falling grains. Thus, with our experimental setup we can obtain both the size of avalanches and its time span. After each avalanche, the system is unjammed by directing a compressed air jet to the silo outlet; with this device, the compaction fraction of the grains inside the silo is not altered.
We used spherical grains of different sizes and made of different materials. A summary of some of their relevant properties is shown in table 1.
| Material | (mm) | mass (mg) | |
|---|---|---|---|
| glass | 0,42 0,05 | 0,16 0,05 | 2,2 0,1 |
| glass | 1,04 0,01 | 1,3 0,4 | 2,4 0,1 |
| glass | 2,06 0,02 | 10,1 0,3 | 2,2 0,1 |
| glass | 3,04 0,02 | 34,7 0,4 | 2,4 0,1 |
| lead | 1,98 0,06 | 46,0 3,8 | 11,4 0,5 |
| lead | 3,0 0,1 | 150 14 | 10,9 0,5 |
| delrin | 3,00 0,02 | 18,9 0,3 | 1,34 0,05 |
Flow measurement was accomplished in two different ways depending on the features of the silo discharge. It has been shown that for big sizes of the outlet orifice the outpouring is almost continuous, while for a small orifice jamming events can occur. The border between the two regimes is sharply defined at , where is the ratio between the diameter of the outlet orifice and the diameter of the beads Zuriguel2 . For , the flow can be measured just by dividing the number of fallen beads by the time elapsed. As the flow is continuous, this measurement can be done at any moment with any number of beads (or elapsed time), and it gives consistent results. However, when , the flow was obtained by dividing the size of avalanches by their respective duration. In order to illustrate the difference between both cases, in Fig. 1 we show the measurements (number of fallen beads as a function of time) for two outlet orifices, one bigger than and other smaller.
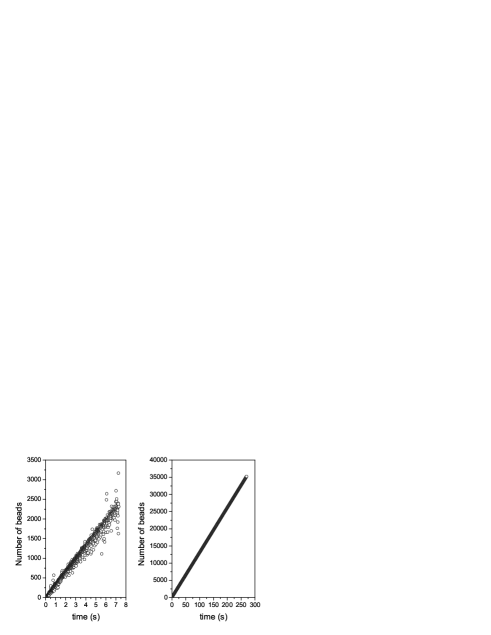
In both cases, a measurement of the mean flow is obtained from the slope of the straight line fitting the data. The main difference is that for fluctuations are not completely smoothed out as in the case . This is not due to a lack of resolution in the measurements but to the fact that at the involved time scales the flow fluctuations can not be neglected for short avalanches. For orifice sizes where both methods are feasible it has been checked that the measured flow rate does not depend on the procedure.
II.2 Two dimensional silo
A two dimensional silo consisting of two sheets of glass was also used. The silo is built so that the gap between the panes is a little bit larger than the diameter of the beads. In order to meet the stringent tolerances of these assembly, we only used stainless steel beads with a diameter , while the separation between the two glass sheets was . As the separation between walls is just a little bigger than the size of the particles, they only can arrange themselves in one layer. The setup therefore allows us to record the movement of individual particles using a high speed camera. The grains flow out of the silo through a slot in the base whose length can be changed at will. The automation and measuring devices are similar to those used in the three dimensional silo. A detailed description of this setup will be presented elsewhere.
The time span of the avalanches is registered with a photodetector at the silo exit. We placed optical fibers at both ends of the slit forming the outlet orifice; a light beam is emitted from one of them and the other collects it and feeds the photodetector, so a falling bead is detected when it blocks the light beam. The time resolution of this assembly (better than one millisecond) is smaller than the time that it takes for a particle to cross the light beam. The weight used also allows us to measure the avalanche size with a resolution of just one particle.
The width of the silo is larger than particle diameters, in order to prevent any influence of the lateral walls. As in the three dimensional case, the measurement of the flow was accomplished using two different methods, as described in the previous subsection, depending on whether the outlet gets jammed or not.
II.3 Numerical simulations
We have used soft particle molecular dynamics Schafer simulations of disks in two dimensions. In this method, we consider that a collision has taken place when two disks slightly overlap (the distance between their centers is smaller than the sum of their radii). A repulsive force, in the normal direction of the collision, proportional to the overlap, prevents the grains from traverse each other; besides, a term proportional to the relative velocity of the particles accounts for the dissipation of energy during the collision. A force perpendicular to the collision direction implements the Coulomb law of friction. Details of the algorithm can be found in Arevalo1 . The velocity-Verlet scheme along with neighbor lists Rapaport were used to integrate the equations of motion.
A simulation begins with disks placed on a regular lattice that are given random velocities taken from a gaussian distribution. The disks are allowed to fall under gravity through a hopper. Below the hopper there is a flat bottomed silo in which the grains are deposited. This is the preparation phase, which is aimed to break the correlations that the initial regular arrangements of the grains may induce in their dynamics. Once all the grains have settled in the flat silo and after most of the kinetic energy is dissipated, the outlet at the bottom is opened, allowing the grains to fall. The flow is measured by counting the number of beads that go out of the silo for each simulation step.
The walls of both the silo and the hopper used are constructed with grains. The interaction grain-grain is the same than the interaction grain-wall, but the latter keep their positions fixed. Thus the walls are rough and give rise to dissipative collisions.
The flat silo is grains diameter wide and the level reached by the grains is approximately twice that value when the silo is filled. During a simulation, the level of the grains is kept constant by reintroducing the exiting grains at the top of the silo. These grains are placed as close to the free surface as possible and with velocities similar to those of the exiting grains, so as not to perturb the flow. These conditions allow us to neglect any effect from the wall or filling method on the flow rate.
III Results
III.1 Validity of Beverloo’s law
Let us start with the presentation of the flow measurements as a function of in the three-dimensional silo. The experimental data are shown on figure 2. As different materials are included, we have taken the mass flow rate divided by the mass of one bead . By using , which is the number of beads fallen per unit time, all the data can be plotted together (as expected, shows only a slight dependency on the material from which the beads are made). Note that the size of the outlet orifice spans over almost two decades, from to . Besides, the results are a practical demonstration that the relevant parameter is indeed . The flow rate of beads made of different materials can thus be represented in the same graph without any additional concern.
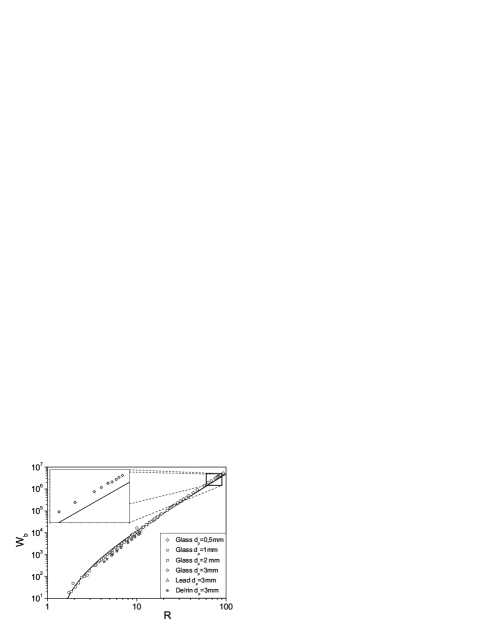
The best fit obtained with Eq. (1) is and is also represented in Fig. 2. Note that this fit fails for large , where it underestimates the flow rate (see the inset in Fig. 2). Indeed, the disagreement between the measured and the predicted flow rate amounts to about one million beads per second for (a relative error of 10% approximately). Note that the parameter merely shifts the fit along the horizontal axis. Depending on the particular value chosen, the fit will be closer to the data in a different zone of . If the range of is small, this may seem acceptable; but if a large range of exit orifices is considered, it becomes clear that Beverloo’s law is inadequate.
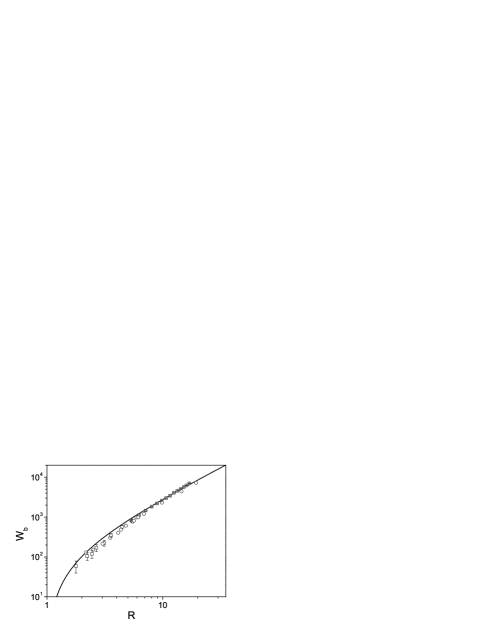
A different approach that can be tried is to consider large values of and fit Eq. (1) to the experimental data with . A different approach is to fit Eq. (1) for large with . In this case at least the asymptotic behavior for is recovered (see inset of Fig. 3). But then for small orifices this prediction and the experimental data do not agree: the flow rate is overestimated (see Fig. 3).

The same holds for the two-dimensional case, where the asymptotic behavior for large is now (Fig. 4). Note, however, that in this case we have explored a smaller range of . By varying the free parameters of Eq. (1), i.e. and , one can often get a seemingly acceptable result. Nevertheless, close inspection of the fit with reveals the same qualitative disagreement: Beverloo’s law with overestimates the flow for small . This can be more easily seen if a large range of is considered; but even for a smaller range of outlet sizes, such as in in Fig. 4, the overestimation is suggested for . In the same figure the result of the numerical simulation is displayed. The agreement with the experimental results is excellent for all the explored range.
In summary, the experimental results both in two and three dimensions as well as the numerical simulations in two dimensions clearly show a discrepancy with the values predicted by Eq. (1). If a small range of large outlet orifices is considered, the free parameters of Beverloo’s equation allow for a reasonably good fit. However if a large range of is included, the fit does not yield acceptable results.
III.2 Modification to Beverloo’s statement
In order to study more closely the discrepancy between the measured data in the three dimensional case and the values predicted by the Beverloo equation, we show in Fig. 5(a) vs. , where is the ratio between the measured flow and the value predicted by Beverloo’s law with , obtained from the fit shown in Fig. 3.
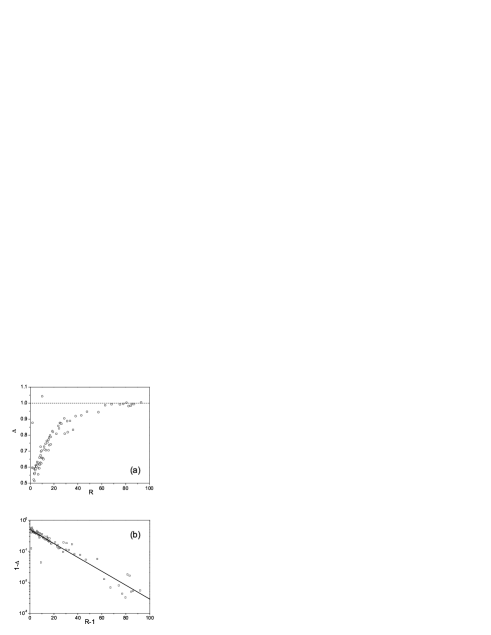
It can be seen that saturates in a non linear fashion. For large indeed , i.e. , as expected by construction. In order to check the exponential dependence, we plot vs. on a semilogarithmic scale (Fig. 5(b)). A fit is also provided showing the good general agreement of this functional dependence:
| (2) |
From the fit, one can obtain that .
We then propose another expression for the mass flow rate in number of beads per unit time , which stems from Eq. (1) after the inclusion of the correction factor :
| (3) |
Recall that the constants , and from Eq. (1) have been grouped into .
In Fig. 6 we show the fit of equation (3) to our experimental data. As can be seen, the match is very good in all the range of , which spans for almost two decades. It should be stressed that the proposed law fits the mass flow rate even for very small orifices (i.e. ), where the flow can be interrupted by jamming events.
In two dimensions, the functional dependence is the same as in three dimensions except for the exponent which is now (coefficients and are obviously different). In figure 7 we show the experimental data and the results for the numerical simulations along with the proposed fit.
The proposed functional dependence of the flow is more satisfactory than fitting the data by using the parameter . Let us recall that this parameter was introduced by Beverloo in order to fit the flow for small orifices. The way that this is usually done is the following. As in Eq. (1), then plotting vs. should give a straight line and the intercept with zero would provide the value for . This is carried out, for example, in ref. BrownandRichards2 . Our experimental data for the flow rate when the orifice is small (Fig. 8) provide a strong evidence that the intercept with zero is at, or very near to, : we have observed that grains flow until near that value. It should be noticed that if the flow rate is not measured for small this method can be misleading, as it depends on an unwarranted extrapolation. Indeed, the value of obtained depends on the range of used to perform the fit. For instance, the solid line in Fig. 8 is a linear fit obtained using just the points for , and the value obtained in this case is . Any value between and can be obtained with our data simply by considering just a suitable range of .
As explained above, the only plausible value for is unity. This is reasonable since must vanish for , and so one could just write , with . But then it is impossible to fit correctly the data using Eq. (1), as shown before (see Fig. 3). Yet the proposed equation (3) neatly fits the data for large values of and it gives the correct behavior for .
Furthermore, our data show that the so-called “empty annulus” effect is not evident at all. It is obvious that no bead can pass through the orifice in such a way that its center is separated by less than from the orifice border. Thus, the bead centers always pass through the orifice in a region which is effectively determined by a diameter . If anything beyond this obvious logic is considered, such as an “empty annulus” defined by with , then it should be checked that the flow vanishes for . We have found no hint of this; instead we find for values of often given in the literature.
In our proposal, embodied in Eq. (3), we have got rid of the parameter and we have instead introduced a correction term, namely, the parenthesis containing the exponential. One of the more appealing possibilities is that this correction term is related to the density of grains near the outlet. In both the experiments and the simulations the compaction fraction was the always the same at the beginning of the runs, and we have checked that it remains approximately unchanged during the discharge. But it may be different near the outlet orifice. As this measurement is difficult to obtain experimentally, we resort to numerical simulations in a two dimensional silo. The value of the density depends on the size of the region where numerical data are collected, and this should be so because there exist spatial density variations near the outlet. We show the results for the density in Fig. 9, where we plot the local compaction fraction in a zone close to the outlet orifice as a function of . The measurements for two regions of different size can be fit with a term just like the one proposed for the flow rate, i.e. . The only variation between the fits is a multiplicative factor. We can then conclude that the correction factor that we introduced is related to the density variation of the granular material near the outlet orifice.

Finally, we show the robustness of the proposed expression by displaying the residues of the best fit using both Eq. (1) and Eq. (3). The fit given by Beverloo is essentially flawed in the sense that it cannot reproduce faithfully the flow for an extended range of (so the residues are only small for one particular value of ). As mentioned above, it is remarkable that for the difference between the value given by Eq. (1) and the measured value amounts to about one million beads per second. On the contrary, the residues for Eq. (3) are consistently small.
IV Conclusions
In this paper we have looked into the behavior of the flow of granular materials during the discharge of a silo. We have checked that the flow does not depend significantly of the material from which the beads are made, and that the relevant control parameter is the ratio between the diameter of the orifice and the diameter of the beads. We have collected experimental data for the largest range of outlet sizes we have been able to find in the literature, which comprises about two decades in and six decades in .
Concerning the flow rate, the Beverloo expression provides the right asymptotic behavior for large . However, the Eq. (1) is not valid for a sizeable range of including small sizes of the outlet orifice, i.e. . In this case, the inclusion of the term in the flow equation, which was an arbitrary remedy for fitting the data, cannot account for the experimental results. We propose instead a more robust expression in which the flow depends on the product of times an exponential corrective factor. We have also shown that it fits neatly the data for a large range of , including very small orifices, in two and three dimensions.
In the new proposal for the mass flow rate, we have got rid of the factor and introduced instead a correction term which saturates exponentially with , so that the asymptotic behaviour is recovered for large . Apart from demonstrating that the concept of “empty annulus” is wrong and unable to explain the experimental results, we have provided an explanation for the correction introduced in terms of the local density variations near the outlet.
Acknowledgements.
This work has been partially supported by Project FIS 2005-03881 (Spanish Government) and PIUNA (Universidad de Navarra). C.M., J.M.P. and R.A. thank Asociación de Amigos de la Universidad de Navarra for a fellowship. A.J. thanks Fundación Ramón Areces for a fellowship.References
- (1) Nedderman R. M., Tüzün U., Savage S. B., and Houlsby G. T.: The flow of granular materials I: Discharge rates from hoppers. J. Chem. Eng. Sci. 37, 1597-1609 (1982).
- (2) Tüzün U., Houlsby G. T., Nedderman R. M. and Savage S. B.: The flow of granular materials II: Velocity distributions in slow flow. J. Chem. Eng. Sci. 37, 1691-1709 (1982).
- (3) Savage S. B., Nedderman R. M., Tüzün U. and Houlsby G. T.: The flow of granular materials III: rapid shear flows. J. Chem. Eng. Sci. 38, 189-195 (1983).
- (4) Tighe B.P. and Sperl M.: Pressure and motion of dry sand: translation of Hagen s paper from 1852. Granular Matter 9, 141-144 (2007).
- (5) Beverloo W. A., Leniger H. A. and Van de Velde J.: The flow of granular material through orifices. J. Chem. Eng. Sci. 15, 260-296 (1961).
- (6) Zuriguel I., Pugnaloni L. A., Garcimartín A. and Maza D.: Jamming during the discharge of grains from a silo described as a percolating transition. Phys. Rev. E (RC)68, 30301 (2003).
- (7) Zuriguel I., Garcimartí n A., Maza D., Pugnaloni L. A., and Pastor J. M.: Jamming during the discharge of granular matter from a silo. Phys. Rev. E 71, 051303 (2005)
- (8) Hirshfeld D., Radzyner Y. and Rapaport D. C.: Molecular dynamics studies of granular flow through an aperture. Phys. Rev. E 56, 4404-4415 (1997).
- (9) Hirshfeld D. and Rapaport D. C.: Granular flow from a silo: Discrete-particle simulations in three dimensions. Eur. Phys. J. E 4, 193 (2001).
- (10) Humby S., Tüzün U. and Yu A. B.: Prediction of hopper discharge rates of binary granular mixtures. J. Chem. Eng. Sci. 53 483-494 (1998).
- (11) Bertho Y., Becco C. and Vandewalle N.: Dense bubble flow in a silo: An unusual flow of a dispersed medium. Phys. Rev. E 73, (2006).
- (12) Brown R. L. and Richards J. C. (1970) Principles of Powder Mechanics. Oxford: Pergamon Press.
- (13) Nedderman R. M. and Laohakul C.: The thickness of the shear zone of flowing granular media. Powder. Technol. 25 91-100 (1980).
- (14) Zhang J. Y. and Rudolph V.: Effect of shear friction on solid flow through an orifice. Ind. Eng. Chem. Res. 30, 1977-1981 (1991).
- (15) Schäfer J., Dippel S. and Wolf D. E.: Force Schemes in Simulations of Granular Materials. J. Phys I(France), 6 5 (1996).
- (16) Arévalo R., Garcimartín A. and Maza D., J. Phys IV(France), to appear.
- (17) Rapaport D. C. (2004) The art of molecular dynamics simulation, Cambridge University Press.
- (18) Brown R. L. and Richards J. C.: Profile of flow of granules through apertures. Trans. Instn. Chem. Engrs. 38, 243-256 (1960).