A high-velocity transient outflow in Carinae
Abstract
We analyze velocity profiles of the X-ray spectral lines emitted by the Carinae ( Car) stellar binary at four epochs, just before the X-ray minimum (associated with periastron) and more than two years before the minimum ( apastron). The profiles are nicely resolved by the HETGS spectrometer on board Chandra. Far from periastron, we find symmetrical lines that are more or less centered at zero velocity. Closer to periastron, the lines broaden, shift towards the blue, and become visibly asymmetric. While the quiescent X-ray emission and slight ( km s-1) centroid shifts can be ascribed to the ordinary continuous binary wind interaction and to the orbital velocity of the secondary star, the observed high-velocity emission up to 2,000 km s-1 and the abrupt flares during which it occurs can not. This leads us to interpret the high-velocity flaring emission as due to a fast collimated outflow of ionized gas.
1 INTRODUCTION
Despite being studied for many years and in all wavebands, the Carinae system ( Car), best known for its spectacular nebula (Morse et al., 1998) that can be tracked back to the Great Eruption of 1840 (Davidson & Humphreys, 1997) is still much of a mystery. It is now believed to be a stellar binary system with a period of 5.54 years (Damineli, 1996). The primary star is one of the brightest and most massive ( 120 ) stars in our galaxy. Although the X-rays detected from Car can be largely explained by the collision of the two stellar winds (Corcoran et al., 2001a; Pittard & Corcoran, 2002), the 70 day X-ray minimum that is periodically observed around periastron is still not well-understood.
Currently, the mass loss rate of the primary exceeds yr-1 (Smith et al., 2003) and that of the secondary is an order of magnitude lower (Pittard & Corcoran, 2002). The wind of the secondary is much faster (few 1,000 km s-1, Pittard & Corcoran, 2002) than that of the primary ( 600 km s-1 and depending on latitude, Smith et al., 2003). The X-ray flux between 2 and 10 keV during the past 12 years is normally at a level of 5 erg s-1 cm-2, as expected from the collision of the two stellar winds (Usov, 1992; Corcoran et al., 2001a; Pittard & Corcoran, 2002; Akashi et al., 2006). The X-ray light curve is roughly constant throughout most of the orbit, but rises gradually by a factor of 3–4 upon approach to periastron at which time short flares appear (Corcoran et al., 1997), before it drops sharply and stays in an X-ray low state ( 10% of normal brightness) for approximately 70 days. The full X-ray light curve can be found in Corcoran (2005). Although absorption by the dense primary wind plays a certain role in attenuating the X-ray emission from Car, both spectral and temporal arguments have been put forward to reject absorption or an eclipse as the prime reason for this persisting low state (Hamaguchi et al., 2004; Soker, 2005; Akashi et al., 2006), which is unique to Car. It has been proposed that if the binary separation during periastron is small enough, the massive primary wind could smother the secondary wind and shut down the X-ray emission (Soker, 2005; Akashi et al., 2006). Recently, a detailed study of the broad-band X-ray behavior around the 2003 periastron passage was conducted by Hamaguchi et al. (2007), who claim the unchanged temperature during the X-ray minimum argues against accretion. However, if the X-ray emission during the minimum is due to the secondary’s residual fast polar wind (Akashi et al., 2006), it would indeed result in unchanged X-ray temperatures.
In this work, we wish to add to the temporal aspects of the Car tale a high-resolution X-ray spectroscopic dimension. This is achieved by using five deep archival exposures of Car with the High Energy Grating Spectrometer (HETGS) on board the Chandra X-ray Observatory (CXO), only the first of which has been published (Corcoran et al., 2001a, b). Theoretical variations of spectral line profiles in binary colliding wind systems have been modeled by Henley et al. (2003). The varying line profiles presented here for Car, however, do not follow these models, at least not in a straightforward way, as we explain in §3.
2 OBSERVATIONS AND RESULTS
The log of the Chandra observations is given in Table 1. Two observations (3745 and 3748) coincide with the short intense flares just before periastron. The exact orbital parameters of Car are not well determined, but we assume throughout this paper a period of 5.54 years (2024 days) and periastron to be at 2003-06-29. The X-ray low state, thus, occurs during = 0 – 0.035. The data were retrieved from the CXO archive and processed using standard software (CIAO version 3.2.2.). Chandra’s HEG and MEG (high and medium energy gratings) spectrometers operate simultaneously in the 3.5 – 7.5 Å band of interest here. Aiming at the highest possible kinematic resolution, the higher spectral resolving power of the HEG in this band (factor of 2) is favored over the slightly higher effective area of the MEG (factor of 2), especially since the co-added plus and minus 1st order HEG data are already of sufficiently high signal-to-noise ratio (S/N).
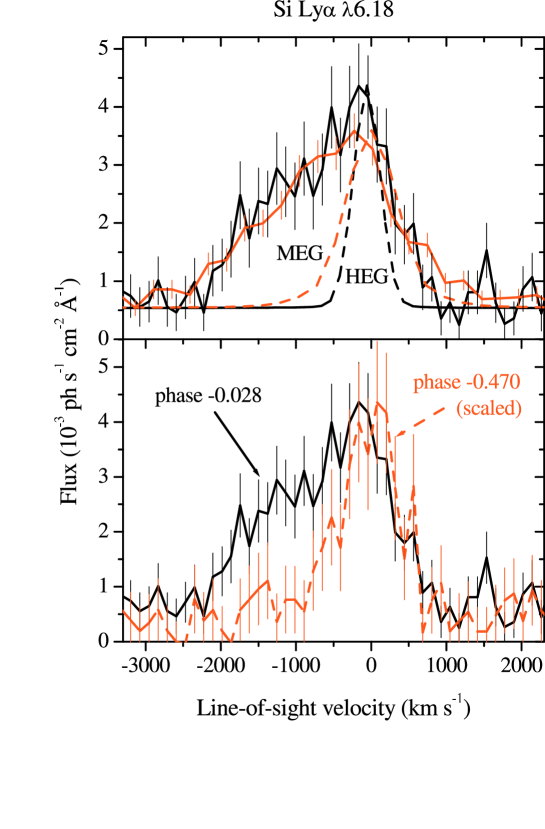
To reveal the dynamics of the X-ray gas, we transferred each spectral line profile to line-of-sight velocity space ( in km s-1) using the non-relativistic Doppler shift , where and represent the observed and rest-frame wavelengths of the line, respectively, and is the speed of light. Negative and positive velocities represent approaching and receding gas, respectively. Fig. 1 shows the broad and variable X-ray line profiles of Car demonstrated on the Si+13 Ly doublet at 6.18 Å. As expected, the MEG profile represents a smoothed version of the higher-resolution HEG profile. The observed line is much broader than the instrumental line spread function (also shown). Fig. 1 also demonstrates how the line profile varies dramatically from phase = –0.470 (Obs. 632) to = –0.028 (Obs. 3745). The early-phase ( = –0.470) line is centered around zero velocity with no significant emission beyond 700 km s-1. The line closer to periastron ( = –0.028) features high velocity gas up to 2000 km s-1.
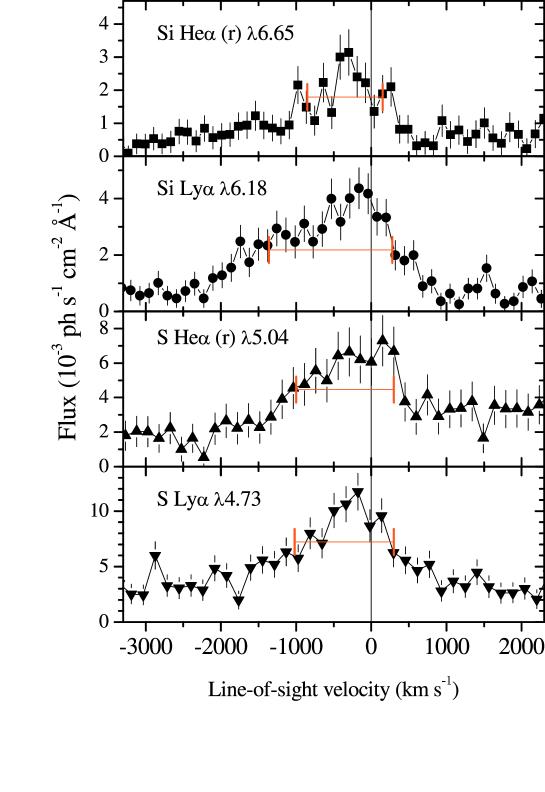
In each observation, the kinematic profiles of the bright spectral lines are fairly similar. This is demonstrated in Fig. 2, where the four best S/N lines of Obs. 3745 ( = –0.028) are shown. In order to elucidate how the line profiles vary as a function of phase, we co-added the profiles of nine bright lines in each observation, namely the Ly (1s-2p), He resonance (1s2-1s2p) and He forbidden (1s2-1s2s) lines of the Si, S, and Ar ions. The similarity of the profiles of these lines in a given observation (see also Henley, 2005, Figs. 4.9–4.12) justifies the co-adding procedure, which yields an average profile with improved S/N. The sufficiently large separation of the resonance to forbidden lines (3400 – 4100 km s-1) and the weak intensity of the intercombination lines in the He-like triplets ensure that the average profiles are not confused by blends. Individual Fe lines below 2 Å could not be included in this analysis, despite their high intensity, since the HETGS resolving power decreases strongly at these low wavelengths to the extent that the He-like Fe line complex is unresolved. The blue wing of the He Fe resonance line is consistent with, though not resolved as well as, the other line profiles presented here. The resulting mean profiles have been normalized (except for Obs. 3747) to facilitate the comparison and are presented in Fig. 3.
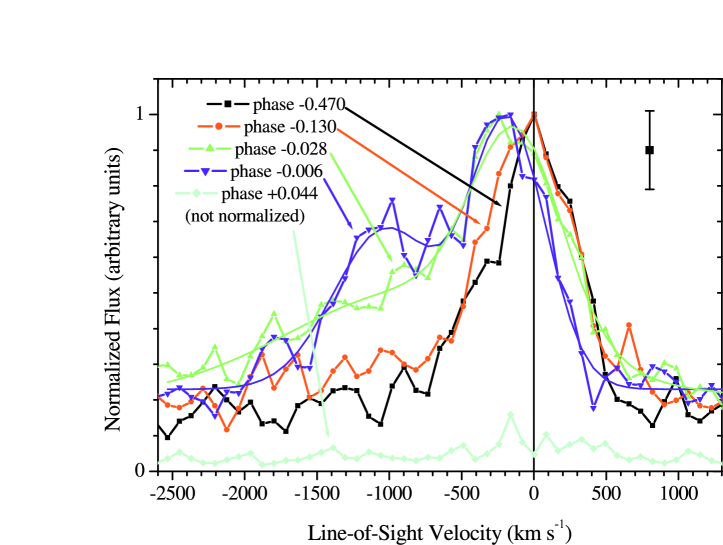
A clear trend can be seen in Fig. 3. Far from periastron, the line profile is relatively symmetric and narrow. Closer to periastron, bright components of gas moving towards us at velocities as high as –2,000 km s-1 start to develop. As the system further approaches periastron, the outflow dominates the line profile to the point where the bulk of the emission is clearly blue-shifted. After periastron, the emission lines are considerably weaker. Line profiles from a binary wind system are not expected to be Gaussian (Henley et al., 2003). Nevertheless, in order to get an idea of the line shifts and widths, we tried to fit Gaussians to the mean profiles in the –2,500 km s-1 to +1,300 km s-1 range (Fig. 3). The results are presented in Table 2. For the two late-phase observations ( = –0.028, –0.006) single Gaussians provide poor fits that can be significantly improved by adding a second component. This does not imply there are necessarily exactly two velocity components, but merely that the velocity distribution at these phases is more complex than Gaussian. The double-Gaussian best fits are plotted in Fig. 3. A second isolated peak at = –0.028 is not as conspicuous as at = –0.006. Hence the broad high-velocity component and the larger errors at = –0.028 (Table 2).
3 INTERPRETATION AND DISCUSSION
The colliding wind binary model, which is generally accepted for explaining the X-ray emission of Car, has several clear predictions regarding the spectral line profiles expected at different orbital phases. The Doppler shifts are the result of shocked gas flowing along the contact discontinuity (CD) surface and away from the stagnation point (SP). If the shock opening half-angle is between , the broadest line profiles are expected when the system is observed perpendicular to the line connecting the two stars, as the hottest gas formed around the SP flows directly towards and away from the observer. In this case, the lines are centered at zero velocity and are intrinsically symmetrical, but could be skewed by absorption of the far (red) emission. On the other hand, when the system is observed from behind one of the stars, shifted centroids are expected. If the system is observed from behind the weaker (stronger) wind, downstream shocked gas flows along the CD surface in the general direction of (opposite) the observer, producing blue- (red-) shifted centroids. The maximum velocities in this case would be less than those in the first (orthogonal) orientation. For a complete and detailed calculation of line profiles from colliding winds see Henley et al. (2003). In the following, however, we argue that the current line profiles observed at the different phases of the Car orbit are in contradiction, even qualitatively, with the simple colliding wind scenario.
If the major axis of the Car binary is perpendicular to our line of sight (Smith et al., 2004), the broadest profiles are expected at apastron (see above), but that is when the observed profiles are narrowest ( = –0.470). Also, with this geometry, the secondary would have to pass in front of the primary before periastron (c.f., Smith et al., 2004) to explain the blue-shifted centroids at = –0.028, –0.006, but that would produce symmetric (blue-shifted) profiles as absorption through the secondary wind is weak, while asymmetric profiles are observed. In any case, the lower velocities observed near apastron appear to rule out this orientation if the colliding wind geometry is to produce the observed X-ray line profiles.
Alternatively, if the projection of the line of sight on the orbital plane is along the major axis and the viewing angle at apastron is from behind the secondary (Corcoran et al., 2001a), the observed blue-shifts at could be ascribed to gas flowing from the SP towards the observer and the unobserved red wing of the line to absorption by the primary wind. However, according to this scenario, at apastron () one would expect blue-shifted centroids of at least a few 100 km s-1 due to downstream gas (see above), which are not observed. For an observer above the binary plane (), as seems to be the case in Car (Corcoran et al., 2001a), the problem becomes more severe (higher blue-shift is expected, but not observed). Indeed, Kashi & Soker (2007) showed that the X-ray line shifts with orbital phase can not be due to the change in orientation of the colliding winds region when the inclination of the orbital plane is considered (c.f., Corcoran, 2007).
Apparently, the naive wind-collision scenario alone is insufficient to explain the observed Doppler shifts of the X-ray line profiles of Car at all binary phases. Henley (2005) compared the same data with line profiles calculated from his hydrodynamical simulations and reached a similar conclusion. A recent attempt has been made by Henley et al. (2007) to propose yet another orientation. However, we note that the asymmetric line profiles are observed during strong peaks in the X-ray light curve. These peaks too can not be accounted for by the simple colliding wind models. As far as we understand, the high X-ray velocities remain unexplained and we ascribe them to a transient outflow that arises just before the onset of the X-ray minimum and is coincident with the X-ray flaring.
Kashi & Soker (2007) suggested orbital motion to be important before periastron. This could account for small X-ray line shifts, but not for the highest velocities observed. Utilizing the two-Gaussian fits in Table 2, however, we can confront the orbital solution of Kashi & Soker (2007) with the low-velocity fitted component (column 2 in Table 2). We assume an eccentricity of , stellar masses of , , and an observer above the orbital plane (), whose projection on the orbital plane is exactly behind the secondary at periastron. This geometry was invoked by Kashi & Soker (2007) to explain the shifts of the He I lines (but c.f., Corcoran et al., 2001a; Henley et al., 2007). The calculation shows that the orbital velocity of the X-ray gas is that of the secondary. We added –8 km s-1 to the model for the systemic velocity of Car (Smith, 2004). The resulting theoretical velocities of the X-ray gas as a function of phase are seen in Fig. 4 to formally agree with the observed Doppler shifts of the low-velocity component, except at = –0.006, where the model velocity is slightly smaller. Given the many uncertainties of the binary parameters, this discrepancy may not be significant.
The high-velocity X-ray emission (column 4 in Table 2), on the other hand, is not explained by the orbital motion and could be due to a transient collimated flow ejected from the immediate vicinity of the binary system. The peaks in the X-ray light curve hint that the outflow may be in the form of blobs. The unresolved hard X-ray Chandra images restrict the outflow to within 1016 cm of the center (0.5″, assuming the distance of 2.3 kpc). The appearance of the same charge states during all phases implies that the temperatures of the X-ray gas and line-emitting outflow remain in the range of = 2 – 5 keV. Hence, the outflow likely consists of gas shocked by the collision of the winds (as observed throughout the orbit) and is boosted near periastron. The widths of the major peaks seen in Figs. 2 and 3 suggest that the outflow is only moderately collimated to within . The compression of shocked gas provides a natural explanation for the short intermittent flares in the X-ray light curve. A collimated outflow from the secondary has also been suggested to explain the enhanced He II emission before periastron (Soker & Behar, 2006). Interestingly, both proper motion and Doppler shifts have been measured for high-velocity visible-light knots much further out from the center (Walborn et al., 1978; Meaburn et al., 1993). The optical knots were ejected more than a hundred years ago along the minor axis of the nebula (Meaburn et al., 1993). We would expect the present outflow to be directed along the major axis of the nebula although we have no pertinent information on its present direction with respect to the system’s geometry. As the massive Car primary is a short-lived star shedding considerable mass, it may be a supernova in the making. At the very least, it highlights the next periastron passage on 2009, January 12 as a faithfully scheduled experiment for the astrophysically common, but poorly understood phenomenon of collimated flows.
References
- Akashi et al. (2006) Aksahi, M., Soker, N. & Behar, E. 2006, ApJ, 644, 451.
- Corcoran (2005) Corcoran, M. F. 2005, AJ, 129, 2018.
- Corcoran et al. (1997) Corcoran, M. F., et al. 1997, Nature 390, 587.
- Corcoran et al. (2001a) Corcoran, M. F., Ishibashi, K., Swank, J. H. & Petre, R. 2001a ApJ, 547, 1034.
- Corcoran et al. (2001b) Corcoran, M. F., et al. 2001b, ApJ, 562, 1031.
- Corcoran (2007) Corcoran, M. F. 2007, in Massive Stars: Fundamental Parameters and Circumstellar Interactions, in press (astro-ph/0702457)
- Davidson & Humphreys (1997) Davidson, K. & Humphreys, R. M. 1997, Annu. Rev. Astron. Astrophys. 35, 1.
- Damineli (1996) Damineli, A. 1996, ApJ, 460, L49.
- Hamaguchi et al. (2004) Hamaguchi, K., Corcoran, M. F., Gull, T., White, N. E., Damineli, A., & Davidson, K. 2004 (astro-ph/0411271)
- Hamaguchi et al. (2007) Hamaguchi, K. et al. 2007, ApJ, 663, 522
- Henley et al. (2003) Henley, D. B., Stevens, I. R., & Pittard, J. M. 2003, MNRAS, 346, 773.
- Henley (2005) Henley, D. B. 2005, Ph.D. thesis, University of Birmingham, http://www.physast.uga.edu/dbh/thesis/
- Henley et al. (2007) Henley, D. B., ApJ, submitted, private communications
- Kashi & Soker (2007) Kashi, A. & Soker, N. 2007, NewA, 12, 590
- Meaburn et al. (1993) Meaburn, J. et al. 1993, A&A, 276, L21.
- Morse et al. (1998) Morse, J. A., et al., 1998, AJ, 116, 2443.
- Pittard & Corcoran (2002) Pittard J. M. & Corcoran, M. F. 2002, A&A, 383, 636.
- Smith (2004) Smith, N. 2004, MNRAS, 351, L15
- Smith et al. (2003) Smith, N., Davidson, K., Gull, T. R., Ishibashi, K. & Hillier, D. J. 2003, ApJ, 586, 432.
- Smith et al. (2004) Smith, N., Morse, J. A., Collins, N.R., & Gull, T. R. 2004, ApJ, 610, L105.
- Soker (2005) Soker, N. 2005, ApJ, 635, 540.
- Soker & Behar (2006) Soker, N. & Behar, E. 2006, ApJ, 652, 1563.
- Usov (1992) Usov, V. V. 1992, ApJ, 389, 635.
- Walborn et al. (1978) Walborn, N. R., Blanco, B. M. & Thackeray, A. D. 1978, ApJ, 219, 498.
| CXO archive | Start Time | Exposure | Assumed Orbital | 2–10 keV Flux |
|---|---|---|---|---|
| ID aa One additional observation was carried out during the X-ray minimum (ID 3746 at 2003-07-20 01:46:22) for which no useful spectrum could be obtained. | (ks) | Phase ()bb Phase is approximated based on the assumption of a 5.54 year (2024 day) orbit, where phase zero is set at 2003-06-29 and the X-ray low state occurs during phase 0 – 0.035. | (10-10 erg s-1 cm-2) | |
| 632 | 2000-11-19 02:46:40 | 90.69 | –0.470 | 0.50 |
| 3749 | 2002-10-16 08:08:49 | 93.96 | –0.130 | 0.98 |
| 3745 | 2003-05-02 11:56:16 | 97.29 | –0.028 | 2.2 |
| 3748 | 2003-06-16 05:35:28 | 100.1 | –0.006 | 0.97 |
| 3747 | 2003-09-26 22:45:53 | 72.16 | +0.044 | 0.48 |
| Assumed Phase () | FWHM1 | FWHM2 | / d.o.f aa Double-Gaussian fits to the profiles at = –0.470 and at = –0.130 yield an unconstrained second component. Single-Gaussian models for the profiles at = –0.028 and = –0.006 yield visibly inferior fits with / d.o.f of 1.16 and 1.02, respectively. | ||
|---|---|---|---|---|---|
| –0.470 | –25 25 | 710 60 | 0.36 | ||
| –0.130 | –50 20 | 730 40 | 0.43 | ||
| –0.028 | –110 30 | 730 100 | –830 110 | 2030 400 | 0.39 |
| –0.006 | –180 30 | 620 60 | –1030 30 | 840 90 | 0.68 |