Towards journalometrical analysis of a scientific periodical: a case study
Abstract
In this paper we use several approaches to analyse a scientific journal as a complex system and to make a possibly more complete description of its current state and evolution. Methods of complex networks theory, statistics, and queueing theory are used in this study. As a subject of the analysis we have chosen the journal “Condensed Matter Physics” (http://www.icmp.lviv.ua). In particular, based on the statistical data regarding the papers published in this journal since its foundation in 1993 up to now we have composed the co-authorship network and extracted its main quantitative characteristics. Further, we analyse the priorities of scientific trends reflected in the journal and its impact on the publications in other editions (the citation ratings). Moreover, to characterize an efficiency of the paper processing, we study the time dynamics of editorial processing in terms of queueing theory and human activity analysis.
Key words: complex systems, complex networks, co-authorship network, journal evaluation, human dynamics
PACS: 02.10.Ox, 02.50.-r, 07.05.Kf, 89.75.-k
1 Introduction
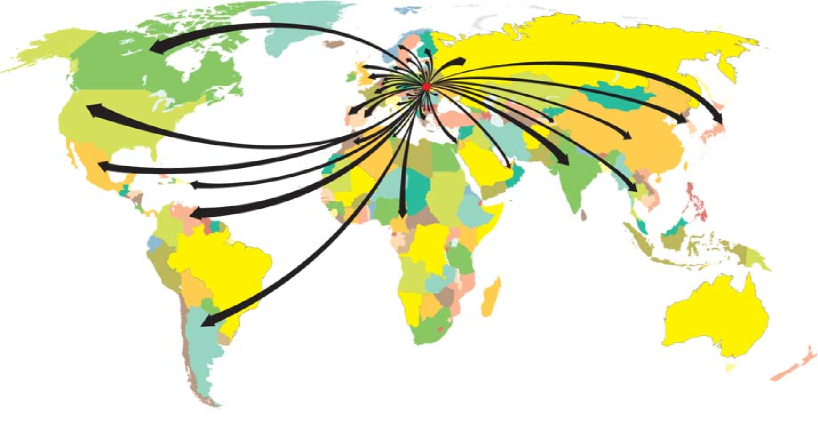
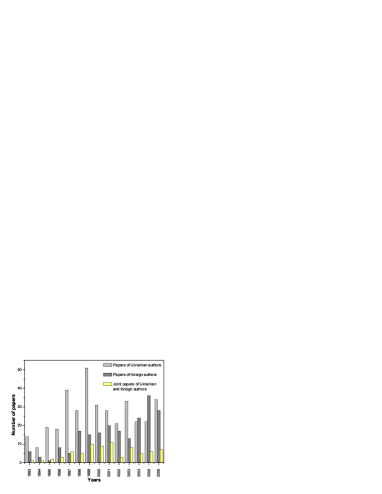
It is a honor and pleasure for us to contribute by our paper to the jubilant fiftieth issue of the journal “Condensed Matter Physics” (CMP) [1]. The history of this journal began in 1993 when it was founded by the Institute for Condensed Matter Physics of the National Academy of Sciences of Ukraine. Soon the journal transformed into an international periodical, which is currently recognized by the European Physical Society (since 2003) and is covered by ISI Master Journal List (since August, 2005). Since the time of its foundation, 671 papers by authors from 44 countries have been published in the journal, see figure 1. The jubilee of the CMP is a good incentive to present the results of the statistical analysis of its publications, paying attention to their different features, ranging from their content, collaboration trends of the authors to the efficiency of the paper processing procedure. Recently, a new term, journalometry, has appeared for the complex quantitative analysis of scientific periodicals [2]. In particular, this complex approach makes it possible to take into account different types of information about the journal, ranging from the quantitative to the qualitative ones [3].
Another reason for analysing the statistics of publications in a scientific journal is that such an analysis permits to shed light on different features of human activities as well as to quantify them. To give an example, applying a complex network theory [4] to the analysis of co-authorship of the papers published, one deals with a collaboration network, a subject of interest in social disciplines. Similar tools applied to the analysis of the distribution of references that appear in the papers published, lead to the so-called citation network, an example of information networks. Moreover, as we shall discuss in our paper, the analysis of distribution of the waiting times of the papers submitted to the journal is useful in understanding the origin of particular features of human dynamics [5, 6, 7, 8, 9, 10]. Although the analysed database allows us to make certain conclusions about the statistical properties of the values considered, one should be aware of the natural limitations imposed by the finiteness of data set – a typical situation, when a particular periodical is studied.
The structure of our paper is as follows. In the rest of this section we shall describe the database of CMP publications we constructed. Section 2 is devoted to the analysis of the content of papers published in CMP. First, we address the authors of the papers and construct the co-authorship network, measuring its main characteristics. Then, we briefly discuss the main thematic trends of the papers published and the way these papers are cited in other periodicals. In section 3 we approach the analysis of the journal from another viewpoint. Here, the subject of our analysis is not the content of a given paper but rather the way the paper is processed by the editorial board. In particular, we analyse the statistics of time intervals between submission of a paper and its acceptance and interpret the obtained results in terms of queuing theory. Conclusions and outcome are given in section Conclusions.
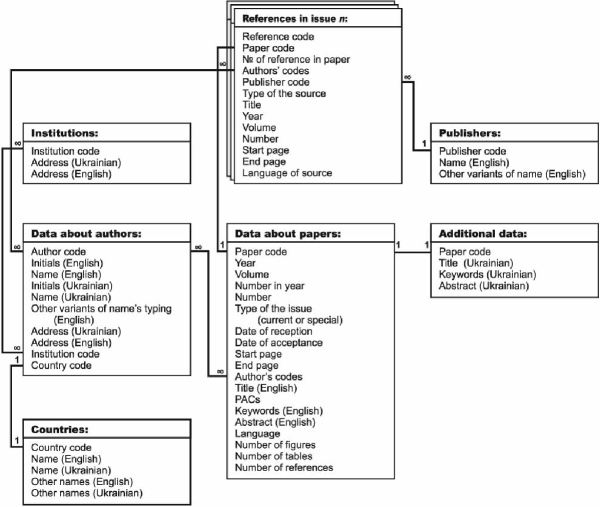
Before passing to a more detailed analysis of publications in CMP, let us briefly describe the structure of the database we used as well as display several general characteristics that follow from the database analysis. The structure of the database is shown in figure 2. It contains information about (i) the authors and their affiliation, (ii) the content of the papers published in CMP, as well as (iii) the data regarding the papers cited in CMP. In what follows, we shall make use of the two first parts of the database, the last one, (iii), will be considered elsewhere.
During the period analysed, 892 authors published 671 papers in 49 issues of CMP, 477 authors being from Ukraine (where the publishing institution is located) and 415 being from other countries. The international cooperation increased with time. More than a half of all papers during the last 3 years were written by at least one foreign author (figure 3). The decreasing rank of international co-authorship in CMP journal is as follows: Germany (39 common papers), Poland (27), Japan (23), Russia (22), USA (22), Austria (15), France(12) etc. However, the data from the ISI database (Web of Science, [11]) about the external citation of CMP journal between 1993 and 2006 showed111The analysis was performed in October, 2006 that the authors from other countries cited the papers from CMP in the following decreasing order: USA (13.45% of all citations), Germany (12.48%), France (9.75%), Italy (8.58%), Poland (8%), Austria (4.68%), England (4.1%), Russia (4.1%) etc.
The maximum number of all coauthors in CMP per one person is 25 and the most active author has 29 publications here. 67 authors had no coauthors in CMP at all.
Now, with the above described database at hand we shall perform a more detailed analysis of the statistical parameters of the CMP publications trying to find internal relationships between different parameters and their time dynamics.
2 Analysis of the content of the papers:
co-authorship and fields
of research
In this section, we shall analyse several features connected with the content of the papers published in CMP. Let us start from the analysis of the authorship of the papers. To this end it is reasonable to apply the tools of the complex networks theory [4], a field that originates from (and still may be considered as a part of) graph theory. Complex networks were paid much attention at the end of 1990-ies, when it appeared that many network-like structures that exist in nature or result from human activities possess remarkable properties which were not explained within the then available mathematical framework. The most striking ones were the so-called small-world and scale-free features. In many networks the average distance between any pair of nodes appeared to be very small compared to the network size (more precisely, the network is said to possess small-world properties when grows with slower than ). Correspondingly, if the node degree distribution of a network is governed by a power law, the network is said to be scale-free.
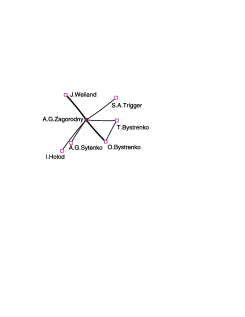
The co-authorship network we are going to consider is one of the examples of collaboration networks. In turn, the latter belong to a special kind of social networks which represent human collaboration patterns. Though social networks have a large history, the collaboration networks have a more precise definition of connectivity and much more data [12]. A special feature of collaboration networks is the possibility of documenting all the facts of collaboration. In a collaboration network, the particular individuals, groups of people or even organizations can be represented by nodes, which are connected by links (different types of interactions between people). An example of a co-authorship graph from CMP is given in figure 4. The nodes of the graph correspond to the authors and a link between two nodes means that the two scientists represented have coauthored a paper in CMP. Different ways of links weighting can be performed: in non-weighed networks link means at least one common paper for two authors; multiple lines or lines of different thickness can represent the number of common papers, as it is done in figure 4; in addition, the collaboration strength of a link can be considered (for example, the strength of collaboration between two authors is taken to be stronger than between three authors) [13]. The results of investigations of scientific co-authorship networks have been presented in numerous papers. Collaboration graphs for scientists were constructed for a variety of fields based on the large databases: MEDLINE (published papers on biomedical research), the Los Alamos e-Print Archive (preprints in theoretical physics), databases maintained by the Mathematical Reviews journal (mathematical papers), NCSTRL (preprints in computer science) [12, 13], SPIRES (papers and preprints in high-energy physics) [14] etc. The sizes of these databases range from 2 million papers to 13,000. The analysis showed that co-authorship networks have the features of scale-free small-worlds: they have a short mean distance between any two nodes, a large clustering coefficient, and node-degree distributions close to a power law. Actually, the distributions of such networks are well fitted by power laws with an exponential cutoff. One of the possible explanations of this cutoff is the finite set of data and the natural limitations on the active working lifetime of a professional scientist [12].
The general number of nodes in co-authorship networks varies between scientific fields, their wide or narrow specializations and periods of existence [12]. On the other hand, the average number of co-authors per one paper to a greater degree depends on its type (experimental or theoretical). Naturally, theoretical papers usually have a rather small numbers of coauthors, compared with the experimental papers [14]. Besides, in the experimental science the general number of collaborators is larger. As regards the CMP, we can clearly see the theoretical character of the journal: the average number of co-authors per paper is equal to 2 and its maximum value is 8.
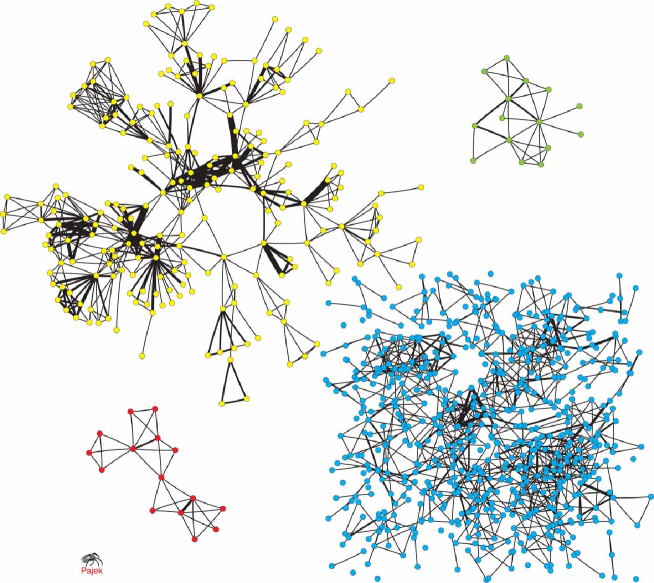
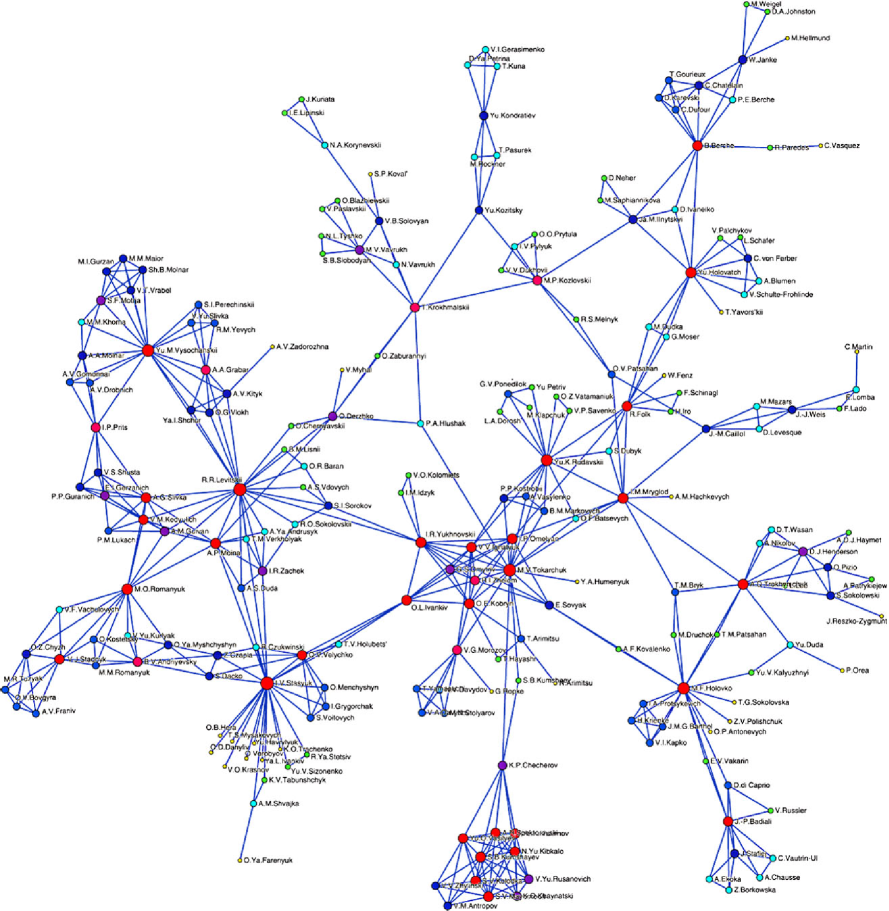
The co-authorship network based on the relatively small database consists of separate groups of connected nodes (clusters). These fragments of the network can group the authors that work in the same field of science. In each cluster every node can be reached from any other node. With the growth of the size of the network, separate clusters tend to join. At some moment, there appears a giant cluster which includes almost all the nodes (a giant component). The analysis of different co-authorship networks showed that the main cluster includes approximately 80% or 90% of all the nodes [12, 13]. The existence of such a cluster allows us to connect almost all the authors by one or several chains of intermediate collaborators. The high level of connectedness provides a fast spread of new scientific information and shows intensive private interactions between scientists. It is interesting that the second-largest connected cluster is far smaller than the largest one. In figure 5 we show the co-authorship network of the CMP journal. The intensity of each co-authorship, defined by the number of common papers, is shown by lines of different thickness. The main co-authorship cluster of the CMP journal is shown in figure 6.
Hight clustering is one of the main features of social networks. The clustering of co-authorship networks greatly depends on the number of papers with a few authors which automatically creates cycles. Special parameters of a network may characterize its clustering level. To proceed further, let us define the main observables used for a quantitative description of networks [4]. As noted before, the degree of a node is the number of the attached edges (see figure 4). The mean node degree characterizes the whole network:
| (1) |
where the summation is performed over all nodes of a network. For a non-weighed co-authorship network, the mean node degree is the average number of coauthors of a particular scientist. The node degree distribution provides a probability for a node to have a degree equal to . The form of the node degree distribution determines the network type. As noted above, the network is said to be scale-free when its node degree distribution follows a power-law:
| (2) |
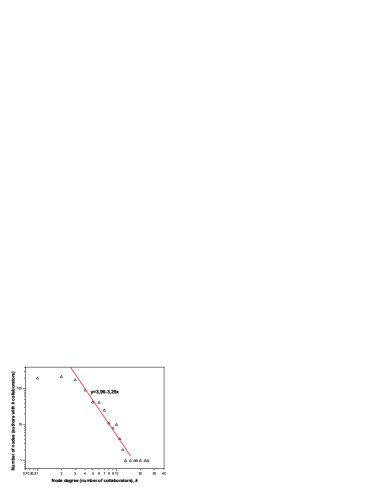
In our case the node degree distribution is the distribution of the number of collaborators of a scientist. The analysis of co-authorship based on biomedical, physical and mathematical databases showed that the corresponding distributions are fat-tailed [13]. The node degree distribution for the CMP journal is shown in figure 7. In spite of a small number of data points one definitely sees a tendency towards a power law behaviour (2) with an exponent . Therefore, we conclude that the corresponding network is scale-free.
The clustering coefficient of a node shows the probability of the nearest neighbours of this node to be connected. It is defined as:
| (3) |
where is the number of the existing connections between the nearest neighbors of the node of degree. Respectively, the mean clustering coefficient characterizing the whole network is defined as:
| (4) |
The clustering reflects a special way of network correlation. The clustering coefficient of a complete graph is equal to one, whereas the clustering coefficient of a tree is zero. For the Erdös-Rényi classical random graph (constituted by nodes randomly connected by links) the clustering coefficient is equal to:
| (5) |
Compared to a random graph, the scale-free networks have a significantly larger value of the mean clustering coefficient which proves their high correlation. In table 1 we give the mean value of the CMP journal co-authorship network compared to of the random graph of an equivalent size. The clustering coefficient, found for the co-authorship network in physics (based on the publication in Los Alamos E-print Archive [17]) between the years 1995 and 1999 is equal to 0.43 [13]; for its cond-mat part (2000–2005) [18]. The mathematical co-authorship network of the Mathematical Reviews journal has a clustering coefficient equal to 0.15 [13]. The smallest value of , 0.066, characterizes the biomedical field (1995–1999) [13]. The clustering coefficient of the CMP journal is (see table 1).
| Parameter | ||||||||
|---|---|---|---|---|---|---|---|---|
| Value | 892 | 1300 | 25 | 2.915 | 0.607 | 185.3 | 4.783 | 10 |
In any connected fragment of the co-authorship network it is possible to find the chains of intermediate collaborators between any two authors. The results of calculations show a very small lengths of the shortest paths between any two nodes: its average value is close to 6 [12]. The length of the shortest path between the nodes and is equal to the minimal number of links which should be passed to reach the from . For a connected network, the mean shortest path length is defined as:
| (6) |
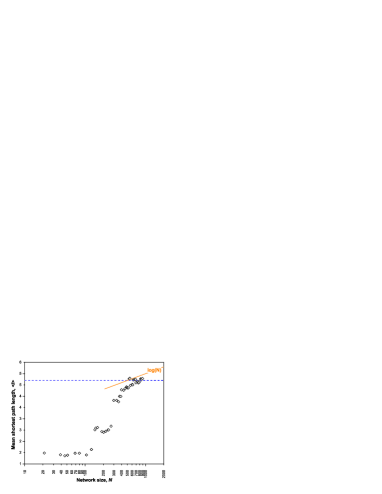
For well-connected networks the value of is not large: for the above mentioned database in physics [17] for all data and for its cond-mat part [12]. Measurements of the mean shortest path of the papers submitted during 2000–2005 to the cond-mat part of the Los Alamos E-print Archive resulted in the value [18]. Our value of for CMP does not differ essentially (see table 1). For small-world networks the value of scales logarithmically or slower with network size [4]. Figure 8 shows how changes with an increasing size of the CMP co-authorship network. Starting from a certain value of (approximately after ) new nodes continue to appear but the mean distance between them remains .
Another value that characterizes the network size is the maximal shortest path length, . For our network, the maximal shortest path connects the nodes of M.R. Tuzyak and M. Weigel, see table 1. Let us note that the average value of for collaboration networks discussed above is between 20 and 30 and it depends on the field of science [13]; for physics .
The problems connected with the shortest paths in collaboration networks were the subject of the analysis in [13]. It was shown that on average 64% of an individual’s shortest paths run through the best-connected of the nearest collaborators. This fact shows the existence of very important nodes in co-authorship networks, which can represent the most communicative and active scientists. Another interesting parameter is “transitivity” which shows the probability that two coauthors of a scientist have themselves coauthored a paper [13]. In other words, if two scientists have at least one common coauthor, they have a high probability of becoming coauthors in future.
| The name of the field | PACS number | Frequency |
|---|---|---|
| Statistical physics, thermodynamics, and nonlinear dynamical systems | 05 | 259 |
| Structure of solids and liquids; crystallography | 61 | 154 |
| Electronic structure of bulk materials | 71 | 139 |
| Equations of state, phase equilibria, and phase transitions | 64 | 124 |
| Dielectrics, piezoelectrics, and ferroelectrics and their properties | 77 | 116 |
| Magnetic properties and materials | 75 | 73 |
| Physical chemistry and chemical physics | 82 | 66 |
| Superconductivity | 74 | 58 |
| Surfaces and interfaces; thin films and low-dimensional systems (structure and nonelectronic properties) | 68 | 49 |
| Physics of plasmas and electric discharges | 52 | 39 |
A careful observation of the main co-authorship cluster of CMP (figure 6) makes it possible to single out its strongly-connected fragments. The possible reason for the existence of such connected groups is the common scientific interest of these authors. In other words, one can visually recognize the thematic trends of the CMP journal. Another numerical data showing the priority fields of research in the CMP is the statistics of PACS numbers. Table 2 represents the top of the 10 most frequent PACS number in the papers of the CMP journal. Finally, the data from the ISI database (Web of Science, [11]) regarding the external citations can show which thematic fields of the CMP journal are most useful for the scientists. The decreasing rank of subject categories that cited CMP: physics, condensed matter (33.92% of all citations), physics, mathematical (14.43%), physics, multidisciplinary (14.04%), physics, atomic, molecular & chemical (12.87%), chemistry, physical (10.72%), physics, applied (9.75%), physics, fluids & plasmas (9.36%), materials science, multidisciplinary (7.21%), electrochemistry (5.26%), chemistry, analytical (2.92%), polymer science (2.53%).
3 Analysis of papers processing
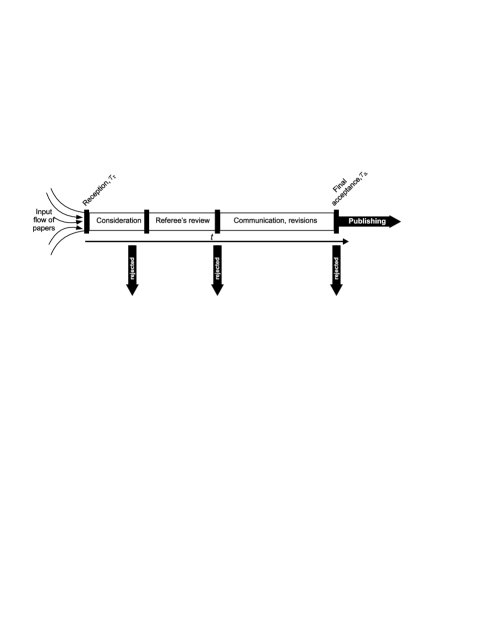
In this section, we approach the analysis of the CMP journal from quite a different point of view. Here, the subject of the study will be the way the papers submitted to CMP are processed by the editorial board. A schematic process of editorial processing is shown in figure 9. Upon submission and consideration by one of the editors, the paper is sent to the reviewers, then revised (if necessary) and, finally, accepted. On each of the above stages the paper may be rejected. However, typically the information concerning the rejected papers is not publicly available. Therefore, we define the waiting time of a paper, , as the difference between the dates of the paper final acceptance, , and the paper reception :
| (7) |
Both and are often displayed in the paper. Therefore, the features to be analysed for the CMP may be also checked for other periodicals [10]. We shall be interested in the distribution of the papers submitted to the CMP.
The distribution of waiting times during different kinds of human activities (sending letters, e-mail communication, web-browsing, loaning books in a library, etc.) has been a subject of recent interest [5, 6, 7, 8, 9]. In particular, it was found that different forms of human activities are characterized by a waiting time distribution in the form of a power law:
| (8) |
Moreover, the dynamics of different processes appear to be governed by different values of the exponent . The value governs the waiting time distribution for web-browsing, e-mail communication and library loans [7, 8]; for sending letters (obtained concerning the analysis of correspondence of Einstein, Darwin, and Freud) [6, 8]; for stock broker activities [8]. To explain this phenomenon, a model of the queuing process based on the priority principle has been used [5, 6, 8]. Note, however, the existing disagreement between the predictions of [5, 6, 7, 8] on the one hand, and the assumption of a log-normal distribution for e-mail communication patterns [9], on the other hand.
In a recent study [10] we proposed to analyse the forms of waiting time distributions to characterize editorial processing of scientific papers. To simplify the analysis we represented each process of editorial consideration, referee review, communication between the participants and the modification of materials being one service action. The analysis of the waiting time distributions of 2667 and 2692 papers published, respectively, in the journals “Physica A: Statistical Mechanics and its Applications” (during the period 1975 – 2006) and “Physica B: Condensed Matter” (during the period 1988 – early 2007) lead to the conclusions about two possible forms of the distribution [10]:
- •
- •
Both distributions predict the same behaviour , differing only in the functional form of the exponential correction.
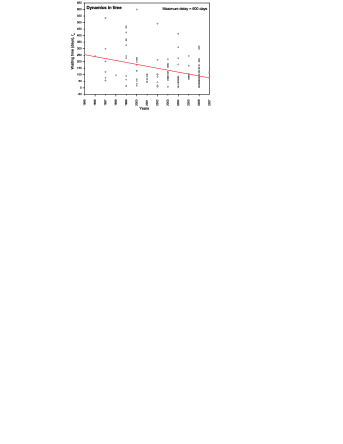
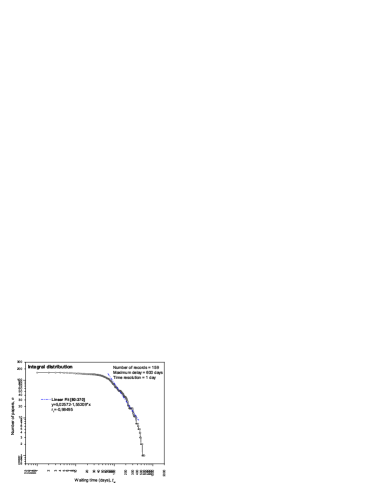
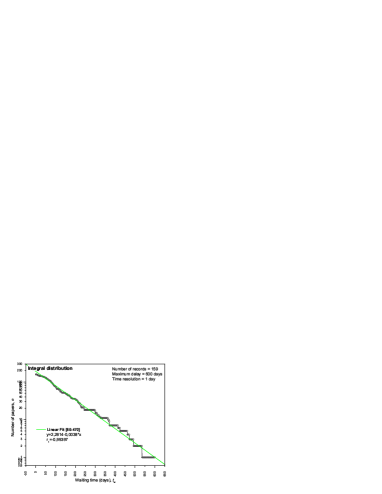
In figure 10 by the solid line we display the time dynamics of the average waiting time of the papers submitted to the CMP during the period 1995–2007. Different data points correspond to waiting times of different papers. The maximal time of the paper processing is equal to days (volume 9, No. 1(21), p. 175–182), the minimal one is equal to 4 days (volume 7, No. 4, p. 829–844; volume 7, No. 4, p. 845–858). As one can see from the figure, the mean waiting time tends to decrease. Unfortunately, only 159 out of all the papers published in CMP contain the information on the dates of the papers final acceptance, , and the paper reception . Because of the poor statistics our results show a significant data fluctuation. To obtain a smoother curve, we analysed the corresponding integral distribution:
| (11) |
The corresponding curves (without normalization) are shown in figure 11 in the double logarithmic and log-linear scales. A better linear fit (the absolute value of Pearson’s coefficient is closer to 1) on a log-linear scale suggests a rather exponential behaviour of the integral distribution curve.
Conclusions
In this paper we have analysed the statistical properties of different data that may be used in characterizing a scientific periodical. In our “case study” we have chosen the journal “Condensed Matter Physics”. Our analysis consisted of two parts. In the first part we examined the features connected with the content of the papers, whereas the subject of the second part was the paper processing by the editorial board. By the content of the paper we mean all the information contained in the text (authors, affiliations, fields of research, etc). From different characteristics that may be extracted in order to quantify the content, we paid special attention to the authors and their collaboration as well as to the main thematic trends of the papers. To this end, we have analysed the CMP co-authorship network using the methods of complex networks theory. Besides, we made use of the ISI database to extract the data regarding the citations of the papers published in CMP. In the second part, where the paper processing was analysed, each paper was considered without paying attention to its content. We were rather interested in the statistics of waiting times of the submitted papers.
The main results obtained in our analysis are given in sections 2 and 3. To summarize some of them, let us mention that the co-authorship network of the CMP journal and the main cluster of authors were considered. We concluded about the scale-free nature of this network as well as its great level of connectivity. Moreover, a very positive tendency of the improving international collaboration is observed. External ratings and evaluations should be also taken into consideration in the full complex journal analysis. This information can be obtained from different international information services and databases such as: Thomson ISI (Web of Science) [11], Scopus [19] and others. Mainly, they include the external citation data which can be the base of the most known quantitative criteria for the evaluation of scientific efficiency. Another result is connected with the study of the editorial board’s activities. The editorial processing of incoming papers can be considered as a process of human activity. Analyzing the statistics of waiting times of the papers we can find a promising decrease of this parameter for CMP journal during the observed period.
Of course, our study does not cover the analysis of all the data that may be considered on the basis of the database constructed. To give an example, we did not touch upon the analysis of citation and co-citation networks, etc. Nevertheless, we think that our study might be useful as far as the external evaluation of the journal is considered. Moreover, some of the numerical data given in our paper can help to evolve a strategy to improve the work of the editorial board.
Acknowledgements
O.M. thanks the Johannes Kepler Universität Linz (Austria) for the possibility of getting information from the ISI database and to Ihor Mryglod for the help rendered. We acknowledge useful discussions with Christian von Ferber and Reinhard Folk.
References
- 1. The ISSN number of the journal “Condensed Matter Physics” is ISSN 1607–324X and the http address reads: http://www.icmp.lviv.ua/journal/index.html
- 2. Jeannin P., Devillard J. Towards a demographic approach to scientific journals, Scientometrics, 1994, 30, 83–95. Note however that this reference analyses an evolution of a set of scientific journals, whereas in our analysis we are rather interested in ’measuring’ a single journal.
- 3. Garfield E. How ISI selects journals for coverage: Quantitative and qualitative considerations. Current contents, 1990, No. 22, 5–13.
- 4. Albert R., Barabási A.-L. Statistical mechanics of complex networks, Rev. Mod. Phys., 2002, 74, 47; Dorogovtsev S.N., Mendes J.F.F. Evolution of networks, Adv. Phys., 2002, 51, 1079; Newman M.E.J. The Structure and Function of Complex Networks, SIAM Review, 2003, 45, 167; Dorogovtsev S.N., Mendes S.N. Evolution of Networks: From Biological Nets to the Internet and WWW. Oxford University Press, Oxford, 2003; Holovatch Yu., Olemskoi O., von Ferber C., Holovatch T., Mryglod O., Olemskoi I., Palchykov V. Complex networks, J. Phys. Stud., 2006, 10, in press (in Ukrainian).
- 5. Barabási A. The origin of bursts and heavy tails in human dynamics, Nature, 2005, 435, 207–211.
- 6. Olivera J.G., Barabási A. Darwin and Einstein correspondence patterns, Nature, 2005, 437, 1251.
- 7. Johansen A. Probing human response times, Physica A, 2004, 338, No. 1–2, 286–291.
- 8. Vazquez A., Oliveira J.G., Dezso Z., Goh K.-I., Kondor I., Barabasi A. Modeling bursts and heavy tails in human dynamics. Phys. Rev. E, 2006, 73, 036127.
- 9. Stouffer D.B., Malmgren R.D., Amaral L.A.N. Log-normal statistics in e-mail communication patterns, arXiv:physics/0605027, v1 3 May 2006.
- 10. Mryglod O., Holovatch Yu. The patterns of natural human dynamics at tasks execution in queue: statistics of waiting times for scientific articles. – In: MECO32, Poland, La̧dek Zdrój, April 16–18, 2007, and unpublished.
- 11. The product of Thomson Scientific, Web of Science: http://scientific.thomson.com/products/wos/
- 12. Newman M.E.J. The structure of scientific collaboration networks, Proc. of the Nat. Acad. of Sciences, USA, 2001, 98, No. 2, 404–409.
- 13. Newman M.E.J. Coauthorship networks and patterns of scientific collaboration, Proc. of the Nat. Acad. of Sciences, USA, 2004, 101, 5200–5205.
- 14. Lehmann S. Spires on the Building of Science: Complex Networks and Scientific Excellence. Cand. Scient. Thesis, 2003. The Niels Bohr Institute.
- 15. A. Vlado. Pajek: Program for large network analysis. http://vlado.fmf.unilj. si/pub/networks/pajek/.
- 16. V.-P. Makinen. Himmeli: Graph drawing software. http://www.artemis.kll.helsinki.fi/himmeli/.
- 17. ArXiv.org: open access to 420,559 e-prints in Physics, Mathematics, Computer Science and Quantitative Biology, http://arxiv.org/
- 18. Cardillo A., Scellato S., Latora V. A topological analysis of scientific co-authorship networks, Physica A, 2006, 372, 333–339.
- 19. http://www.scopus.com/