New results on the Roper resonance and the partial wave
Abstract
Properties of the Roper resonance, the first scalar excitation of the
nucleon, are determined. Pole positions and residues of the
partial wave are studied in a combined analysis of pion- and
photo-induced reactions. We find the Roper pole at
MeV and an elasticity of .
The largest decay coupling is found for the
(--wave).
The analysis is based on new data on for
photons in the energy range from the two-pion threshold to 820 MeV
from TAPS at Mainz and from 0.4 to 1.3 GeV from Crystal Barrel at
Bonn and includes further data from other experiments. The partial
wave analysis excludes the possibility that the Roper resonance is
split into two states with different partial decay
widths.
PACS:
11.80.Et, 13.30.-a, 13.40.-f, 13.60.Le
,
,
,
,
,
,
,
,
,
,
,
,
,
,
,
,
,
,
,
,
,
,
,
,
,
,
,
,
,
,
,
,
,
,
,
,
,
,
,
,
,
,
,
,
,
,
,
,
,
,
,
,
,
,
,
,
,
,
,
,
,
, and
The lowest-mass excitation of the nucleon, the Roper resonance with spin and parity , and the second scalar nucleon excitation [1], remain to be the most enigmatic states in baryon spectroscopy. In the bag model [2] and in the Skyrme model [3], the Roper resonance was interpreted as surface oscillation, also called breathing mode. In quark models, two low-mass scalar excitations of the nucleon are predicted. Using a linear confining potential and one-gluon-exchange [4] or instanton-induced interactions [5], a level ordering is calculated in which the mass of the exceeds the mass of the negative-parity state by 80 MeV; experiments find it MeV below. The spacing between the two scalar excitations is predicted to be MeV [4, 5, 6] while experiments find 270 MeV [1]. When one-gluon exchange interactions are replaced by exchanges of Goldstone bosons, the mass can well be reproduced [7], the mass was not calculated. Lattice gauge calculations indicate that the first scalar excitation of the nucleon should be expected above [8]. Compared to model and lattice predictions, the mass of the Roper resonance is too small; compared to other low-mass resonances, its width too large.
These problems would not occur if were the first radial scalar excitation of the proton. The Roper resonance can then be interpreted within a coupled-channel meson exchange model based on an effective chiral-symmetric Lagrangian [9]; no genuine (3 quark) resonance was needed to fit phase shifts and inelasticities, in agreement with [10]. Motivated by the dependence of the Roper helicity amplitude which would seem to suggest a hybrid nature [11], Capstick and Page [12] calculated masses of baryonic hybrids. Their masses were, however, too large to interpret the Roper resonance as a hybrid. The , a baryon with positive strangeness, which may have been observed in low-statistics photo-production experiments [13, 14, 15, 16], made the Roper resonance [17] and/or the [18] to viable pentaquark candidates. The existence of a very narrow state in the mass region 1650-1750 MeV was investigated in [19]. The fading evidence for [20, 21] makes this interpretation less attractive. Morsch and Zupranski [22] suggested the Roper mass region might house two resonances, one at 1390 MeV with a small elastic width and large coupling to , and a second one at higher mass – around 1460 MeV – with a large elastic width and small coupling. The former resonance was found to be produced in scattering, and in -proton scattering using an beam of GeV kinetic energy; the latter resonance was suggested to be excited by . The two resonances may have rather different wave functions [23]. Studies of the reaction suggested that the low-energy tail of the Roper resonance might decay to both and [24]. Obviously, the partial wave is not sufficiently constrained by precision data and supports very different interpretations.
In this letter, we present data on of the A2-TAPS collaboration at the Mainz Microtron (MAMI) electron accelerator [25] and of the CB-ELSA collaboration at the Bonn ELectron Stretcher Accelerator (ELSA) [26]. The Bonn set up and the analysis method was described briefly in the preceding paper [27]. Here we give only a short summary of the TAPS setup, for more details see [28]. Earlier data taken at MAMI [29, 30] have smaller statistics and are not discussed here.
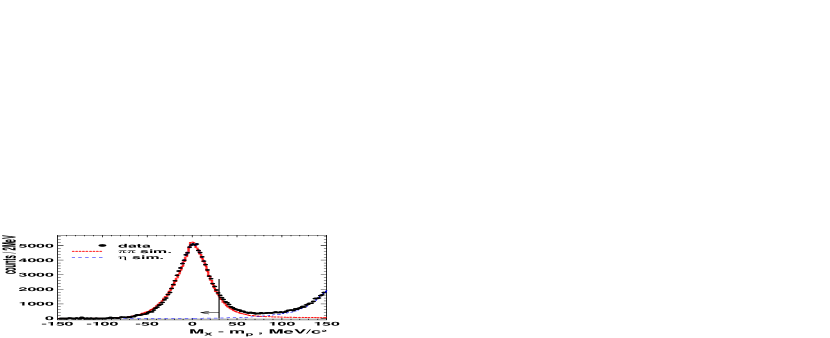
The photon energy at MAMI covered the range 285–820 MeV. The photon energies were measured in the Glasgow tagged photon facility [31] with an average energy resolution of 2 MeV. The TAPS detector [32, 33] consisted of six blocks each with 62 hexagonally shaped BaF2 crystals arranged in an 88 matrix and a forward wall with 138 BaF2 crystals arranged in a 1114 rectangle. This setup covered 40% of . The reaction channel was identified by constructing the 4-momenta of the two neutral pions from their decays; proton detection was not required in the analysis. The mesons were detected via their decay and identified by their invariant mass. The mass of the missing particle was calculated from the four-momenta of the pions, and the beam energy using the mass of the target proton. The resulting distribution is shown in Fig. 1a and demonstrates the unambiguous identification of the reaction . At incident beam energies above the production threshold of MeV, a possible background from the decay with one undetected can be cleanly separated from the reaction of interest (see Fig. 1a). Further details are given in [34].

In Fig. 1b the total cross section is displayed. Two peaks due to the second and third resonance region are observed, with peaks at and MeV. There is good general agreement between the three data sets. The GRAAL data [35] fall off at high masses more rapidly than the CB-ELSA data. At low energies, the TAPS data fall below the CB-ELSA data while the peak cross sections of all 3 experiments agree reasonably well. The discrepancies show the difficulties of extracting total cross sections when the full phase space is not covered by the detector. Note that the extrapolation was done differently: the CB-ELSA and the A2-TAPS collaborations used the result of this partial wave analysis; the GRAAL collaboration used a simulation based on and phase space. The inclusion of both, CB-ELSA and TAPS data, provides an additional tool to estimate the systematic error of the experimental data. The fit curves in Fig. 1b are discussed below.
 |
 |
 |
 |
 |
 |
The total cross section gives only a very superficial view of the reaction. Fig. 2a shows the experimental Dalitz plots, Fig. 2b,c the and mass distributions. The solid line represents the result of a fit, the dashed line represents the distribution of reconstructed phase space events. The projections are not corrected for detection efficiency to allow the reader to compare data and fit directly. From the mass distributions we conclude that the isobar plays an important role in the two-pion photoproduction dynamics. The mass distributions are featureless but show strong deviations from phase space.
Even the Dalitz plot and the projections do not carry the full information on the reaction dynamics. The full sensitivity of the data can only be exploited using an event-based likelihood fit. The data presented here were subjected to a partial wave analysis based on the Bonn-Gatchina approach [36, 37]. Compared to a previous analysis [38, 39], several new data sets are included in this analysis. A list of additional data and a description of the partial wave analysis method can be found in [40]. In the case of two-particle final states (including and ), angular distributions are fitted; three-body final states like and [41] undergo an event-based likelihood fit.
| 1 | Figs. 1,2 | this work | |
|---|---|---|---|
| 2 | Figs. 3-5 | [42, 43, 44, 45] | |
| 3 | Fig. 6 | [46] | |
| 4 | Fig. 7 | [47] |
The reactions most relevant for the present analysis are collected in Table 1. The elastic scattering [46] amplitude provides a strong constraint for partial decay widths of resonances in this partial wave. The inclusion of data on [42, 43, 44, 45] and on [47] over-constrains resonance properties: the three partial decay widths, , , and , of the Roper resonance have to describe its properties in four reactions. In addition, the partial widths define the number of events ascribed to the Roper resonance in the reactions above. Their sum must equal the total width since the only missing channel, , is expected to provide a very small contribution due to the small available phase space. We believe that the tight constraints due to the use of four different reactions defines the Roper mass, width, and coupling constants with much higher reliability than analyses of individual reactions can do. The background amplitudes in the four reactions are treated independently. The data and the quality of the description are shown in Figs. 1-7.
We started the partial wave analysis from the solution given in [38, 39]. Including the new data, we found good compatibility for masses and widths of the contributing resonances. The new description of single photoproduction is shown in Fig. 3. In Figs. 5 and 5 we present a comparison of fit and data on target asymmetry and on the proton recoil polarization from different experiments [48]. Inclusion of the latter data had an impact on the size of couplings but did not change the pole positions; the properties of the Roper resonance were nearly unaffected. The figures (not the fits) are restricted to the mass range below 1800 MeV.

The data provide new information on the
N decay modes. The amplitude gives the largest
contribution to this data (see Fig. 1b). Its
interference with , constructive at 1500 MeV,
destructive at 1600 MeV, generates the dip between the two
peaks in the total cross section.
The has a
large coupling to . In the main solution,
decays into in a relative wave.
There is however a second solution with very similar likelihood in
which the decays proceed via


 |
 |
 |
-wave. This ambiguity results in different contributions of all partial waves as shown in Fig. 1b. The interference between and background contributions is responsible for the shallow dent in solution 2 of the contribution visible in Fig. 1b.
The importance of the --wave was already hinted at by Murphy and Laget (quoted by the GRAAL collaboration in [35]), although in a very different framework based on an effective isobaric Lagrangian. In the Laget model, the Roper resonance provided the largest contribution to , followed by the partial wave while was very weak. The Valencia model [49, 50] is limited to GeV; it predicted strong contributions of and small and contributions. Our analysis finds a very strong contribution. However, the dominant orbital angular momentum in the decay is ambiguous giving rise to two acceptable solutions. Both solutions are fully compatible with the elastic scattering amplitude (see Fig. 5 in [41]). The analysis presented here is constrained by a large number of data sets and exploits all two-particle correlations within the final state. These technical differences may very well be a reason for the discrepant results.
The amplitude for elastic scattering is written in the form of a K-matrix containing three constants, describing non-resonant contributions to elastic and inelastic reactions, and a series of poles representing resonant contributions. The photoproduction amplitude is written as a K-matrix in P-vector approach (which neglects loops in the rescattering series). The photoproduction amplitude has the same poles as the scattering matrix. One constant each is introduced for reaction (1) and (2) in Table 1 describing direct and production. The constants, pole positions and couplings to a final state are free parameters of the fit. The Born term is described by a pole at the proton mass. At least two poles were required, with pole positions at 1370 and 1850 MeV, respectively. In Fig. 6a,b we show the amplitude for the two-pole solution. The data are well described.
As a next step, we introduced a second pole in the Roper region, a pion-induced resonance R and a second photo-induced R’. This attempt failed. The fit reduced the elastic width to the minimal allowed value of 50 MeV; the overall probability of the fit became unacceptable. The resulting elastic amplitude is shown in Fig. 6a,b as dashed line. We did not find any meaningful solution where the Roper region could comprise two resonances.
In [38, 39], no evidence for was found. The increased sensitivity due to new data encouraged us to introduce a third pole in the amplitude. Fig. 6c,d show the result of this fit. A small improvement due to is observed, and also other data sets are slightly better described. The parameters of the resonance are not well defined, the pole position is found in the 1580 to 1700 MeV mass range.
Introduction of the as third pole changes the properties. In the two-pole solution, the resonance is narrow ( MeV), in the three-pole solution, the and a MeV wide resonance interfere to reproduce the structure. Data with polarized photons and protons will hopefully clarify existence and properties of these additional resonances. Further poles are expected at larger masses. Introducing such a pole does not lead to a significant improvement of the fit.
The properties of the resonance determined here are listed in Table 2. From the K-matrix poles and their couplings, the poles of the scattering matrix T were deduced. The speed plot gives MeV. The Breit-Wigner parameters are deduced by the following method. The helicity coupling and the coupling constant for a given decay mode are calculated as residues of the T-matrix pole in the corresponding complex plane. These are complex numbers. The partial decay widths are calculated from the coupling constants and the available phase space including centrifugal barrier factor and Blatt-Weisskopf corrections [36]. These partial widths (including the missing width) are scaled by a common factor to reproduce the T-matrix pole position. The errors cover the range of a large variety of different PWA solutions.
| M | = | MeV | Mpole | = | MeV | |
| = | MeV | = | MeV | |||
| = | MeV | = | ||||
| = | MeV | = | ||||
| = | MeV | = | ||||
| T-matrix: GeV | ||||||
The fractional yields of resonant and non-resonant parts are of course ill-defined quantities. To allow the reader to appreciate better the meaning of the results, we have set to zero the resonant or non-resonant part of the amplitude and calculated the corresponding cross sections, integrated over the Roper region (1300-1500 MeV). Interferences are neglected. The results on the different photoproduction reactions are presented in Table 3. Resonant and non-resonant contributions are comparatively large and interfere destructively to yield the observed wave.
| Reaction | (%) | (%) | (%) |
|---|---|---|---|
This is different in pion scattering. The largest contribution to the final state goes via the resonance. The complicated interference between resonant and non-resonant amplitudes may be the reason why the Roper resonance is so difficult to identify in photoproduction reactions.
| (MeV/c) | 472 | 551 | 655 |
|---|---|---|---|
The properties of the Roper derived here are mostly consistent with previous determinations. Pole position and Breit-Wigner mass and width fall into the range of values given by the Particle Data Group (PDG [1]),
| MeV; | MeV | |||
| MeV; | MeV |
but are defined more precisely here. The helicity coupling agrees with the PDG mean value but from the variety of different solutions we estimate a larger error. Note that our helicity amplitude is defined in the complex plane at the pole position of the Roper. The elastic width () is compatible with previous findings (60-70%). Its decay fraction into () is not in conflict with the PDG mean value (20-30%); only the partial decay width deviates significantly from PDG. We find while PDG gives 5-10%.
Due to its larger phase space, decays into are more frequent than those into even though the latter decay mode provides the largest coupling. For a radial excitation, this is not unexpected: about 50% of all resonances decay into J/, more than 25% of resonances decay via [1]. The large value of might therefore support the interpretation of the Roper resonance as radial excitation.
An alternative interpretation of the decay is offered by Hernandez, Oset and Vicente-Vacas [51] who take into account the re-scattering of the two final state pions. The authors of [51] do not fit data; instead they show that they can reproduce qualitatively the phenomenology of decays by rescattering thus avoiding the need to introduce a genuine amplitude.
In this letter, we have presented new data on photoproduction of two neutral pions in the energy range from the 2 production threshold up to a photon energy of 820 MeV (Mainz) and up to 1300 MeV (Bonn) and reported results from a partial wave analysis of this and of related reactions.
The focus of this letter is the Roper resonance. We show that the data are incompatible with the conjecture that conflicting results on its properties could originate from the presence of two similar resonances and their interference, where both are in the wave and both fall into the 1300 to 1500 MeV mass region. Due to the fact that the Roper properties are over-constrained by the data, we can rule out this possibility. The decay pattern is consistent with an interpretation of the Roper resonance as first radial excitation of the nucleon.
Acknowledgements
We would like to thank the technical staff of the ELSA and MAMI machine groups and of all the participating institutions of their invaluable contributions to the success of the experiment. We acknowledge financial support from the Deutsche Forschungsgemeinschaft (DFG) within the SFB/TR16 and from the Schweizerische Nationalfond. The collaboration with St. Petersburg received funds from DFG and RFBR. U.Thoma thanks for an Emmy Noether grant from the DFG. A.V. Sarantsev acknowledges support from RSSF.
References
- [1] W.M. Yao et al., J. Phys. G 33 (2006) 1.
- [2] U.G. Meißner, J.W. Durso, Nucl. Phys. A 430 (1984) 670.
- [3] C. Hajduk, B. Schwesinger, Phys. Lett. B 140 (1984) 172.
- [4] S. Capstick, N. Isgur, Phys. Rev. D 34 (1986) 2809.
- [5] U. Löring et al., Eur. Phys. J. A 10 (2001) 395.
- [6] U. Löring et al., Eur. Phys. J. A 10 (2001) 447.
- [7] L.Y. Glozman et al., Phys. Rev. D 58 (1998) 094030.
- [8] T. Burch et al., Phys. Rev. D 74 (2006) 014504.
- [9] O. Krehl et al., Phys. Rev. C 62 (2000) 025207.
- [10] S. Schneider et al., Eur. Phys. J. A 28 (2006) 107.
- [11] Z.P. Li et al., Phys. Rev. D 46 (1992) 70.
- [12] S. Capstick, P.R. Page, Phys. Rev. D 60 (1999) 111501.
- [13] T. Nakano et al., Phys. Rev. Lett. 91 (2003) 012002.
- [14] V.V. Barmin et al., Phys. Atom. Nucl. 66 (2003) 1715 [Yad. Fiz. 66 (2003) 1763].
- [15] S. Stepanyan et al., Phys. Rev. Lett. 91 (2003) 252001.
- [16] J. Barth et al., Phys. Lett. B 572 (2003) 127.
- [17] R.L. Jaffe and F. Wilczek, Phys. Rev. Lett. 91 (2003) 232003.
- [18] D. Diakonov et al., Z. Phys. A 359 (1997) 305.
- [19] R. A. Arndt et al., Phys. Rev. C 69 (2004) 035208.
- [20] M. Battaglieri et al., Phys. Rev. Lett. 96 (2006) 042001.
- [21] S. Niccolai et al., Phys. Rev. Lett. 97 (2006) 032001.
- [22] H.P. Morsch, P. Zupranski, Phys. Rev. C 61 (2000) 024002.
- [23] H. P. Morsch and P. Zupranski, Phys. Rev. C 71 (2005) 065203.
- [24] J. Patzold et al., Phys. Rev. C 67 (2003) 052202.
- [25] J. Ahrens et al., Nucl. Phys. News 4 (1994) 5.
- [26] W. Hillert, Eur. Phys. J. A 28S1 (2006) 139.
- [27] U. Thoma et al., “N* and * decays into ”, arXiv:0707.3592.
- [28] M. Kotulla et al., Phys. Lett. B 578 (2004) 63.
- [29] F. Harter et al., Phys. Lett. B 401 (1997) 229.
- [30] M. Wolf et al., Eur. Phys. J. A 9 (2000) 5.
- [31] S.J. Hall et al., Nucl. Instr. Meth. A 368 (1996) 698.
- [32] R. Novotny, IEEE Trans. Nucl. Sci. 38 (1991) 379.
- [33] A.R. Gabler et al., Nucl. Instr. Meth. A 346 (1994) 168.
- [34] M. Kotulla et al., Phys. Rev. Lett. 89 (2002) 272001.
- [35] Y. Assafiri et al., Phys. Rev. Lett. 90 (2003) 222001.
- [36] A.V. Anisovich et al., Eur. Phys. J. A 24 (2005) 111.
- [37] A.V. Anisovich and A.V. Sarantsev, Eur. Phys. J. A 30 (2006) 427.
- [38] A.V. Anisovich et al., Eur. Phys. J. A 25 (2005) 427.
- [39] A.V. Sarantsev et al., Eur. Phys. J. A 25 (2005) 441.
- [40] A.V. Anisovich et al., “Baryon resonances and polarization transfer in hyperon photoproduction”, arXiv:0707.3596.
- [41] I. Horn et al., “Evidence for two negative-parity excitations decaying into ”, in preparation.
- [42] O. Bartholomy et al., Phys. Rev. Lett. 94 (2005) 012003.
- [43] H. van Pee et al., Eur. Phys. J. A 31 (2007) 61.
- [44] O. Bartalini et al., Eur. Phys. J. A 26 (2005) 399.
- [45] M. Dugger et al., Phys. Rev. C 76 (2007) 025211.
- [46] R. A. Arndt et al., Phys. Rev. C 74 (2006) 045205.
- [47] S. Prakhov et al., Phys. Rev. C 69 (2004) 045202.
- [48] R.A. Arndt et al., http://gwdac.phys.gwu.edu.
- [49] J.A. Gomez Tejedor and E. Oset, Nucl. Phys. A 600 (1996) 413.
- [50] J.C. Nacher et al., Nucl. Phys. A 695 (2001) 295.
- [51] E. Hernandez, E. Oset and M. J. Vicente Vacas, Phys. Rev. C 66, (2002) 065201.