Detecting Early Galaxies Through Their 21-cm Signature
Abstract
New observations over the next few years of the emission of distant objects will help unfold the chapter in cosmic history around the era of the first galaxies. These observations will use the neutral hydrogen emission or absorption at a wavelength of 21-cm as a detector of the hydrogen abundance. We predict the signature on the 21-cm signal of the early generations of galaxies. We calculate the 21-cm power spectrum including two physical effects that were neglected in previous calculations. The first is the redistribution of the UV photons from the first galaxies due to their scattering off of the neutral hydrogen, which results in an enhancement of the 21-cm signal. The second is the presence of an ionized hydrogen bubble near each source, which produces a cutoff at observable scales. We show that the resulting clear signature in the 21-cm power spectrum can be used to detect and study the population of galaxies that formed just 200 million years after the Big Bang.
keywords:
galaxies:high-redshift – cosmology:theory1 Introduction
An important milestone in the evolution of the Universe is the appearance of the first luminous objects, which begins the era of heating and ionization of the intergalactic medium (IGM), referred to as cosmic reionization. A promising probe of the cosmic gas up to the end of reionization is the hyperfine spin-flip transition of neutral hydrogen (H I) at a wavelength of 21-cm. Observations of the redshifted 21-cm power spectrum as a function of wavelength and angular position can provide a three-dimensional map of the H I distribution (Hogan & Rees, 1979; Madau et al., 1997).
The 21-cm line of the hydrogen atom results from the transition between the triplet and singlet hyperfine levels of the ground state. Calculations of 21-cm absorption begin with the spin temperature , defined through the ratio between the number densities of hydrogen atoms, , where subscripts and correspond to the excited and ground state levels of the 21-cm transition and K corresponds to the energy difference between the levels. The 21-cm spin temperature is on the one hand radiatively coupled to the cosmic microwave background (CMB) temperature , and on the other hand coupled to the kinetic gas temperature through collisions (Allison & Dalgarno, 1969) or the absorption of Ly photons, as discussed below. For the concordance set of cosmological parameters (Spergel et al., 2007), the mean brightness temperature on the sky at redshift (relative to the CMB itself) is (Madau et al., 1997) where is the mean neutral fraction of hydrogen.
After cosmic recombination, down to the remaining free electrons kept close to . Afterward, the gas cooled adiabatically and atomic collisions kept the spin temperature coupled to , both of them lower than , thus creating a 21-cm signal in absorption. As the universe continued to expand and rarefy the gas, the radiative coupling between and started to dominate again, and the 21-cm signal faded. Starting at (Naoz, Noter & Barkana, 2006), the UV photons from the first galaxies emitted between the Ly and Lyman limit wavelengths propagated freely in the IGM. They redshifted or scattered into the Ly resonance, thus coupling to through the WF effect (Wouthuysen, 1952; Field, 1958) whereby atoms re-emitting Ly photons can de-excite into either of the hyperfine states.
Fluctuations in the Ly radiation emitted by the first galaxies led to fluctuations in the 21-cm signal (Barkana & Loeb, 2005b), until the WF effect saturated (i.e., finished dropping to ). In particular, the biased fluctuations in the number density of galaxies, combined with Poisson fluctuations in the number of galaxies and the dependence of the flux, caused large fluctuations in the Ly background. This Ly background is composed of two parts, the photons that directly redshift into the Ly resonance, and those produced during the atomic cascade from higher Lyman series photons (Ly and above). About of the total number of photons emitted from the first stars between Ly and the Lyman limit are converted to Ly (Pritchard & Furlanetto, 2006; Hirata, 2006). The 21-cm power spectrum that arises from the fluctuations in the Ly background can be used to probe the first sources of light and their effect on the IGM (Madau et al., 1997; Chen & Miralda-Escudé, 2004; Barkana & Loeb, 2005a, b; Chuzhoy, Alvarez & Shapiro, 2006).
In this Letter we focus on two effects that have not previously been included in calculations of statistics of the 21-cm brightness temperature; these effects dramatically influence the Ly flux fluctuations and therefore the 21-cm power spectrum. The first is the diffusion of photons through the neutral hydrogen gas. Since the optical depth of Ly is around a million, photons scattered on the surrounding gas cause each source to appear as a halo in the sky rather than a point source (Loeb & Rybicki, 1999). In the absence of scattering a photon will redshift to Ly at some distance from the source, but in the presence of scattering the emitted photons scatter back and forth and thus reach Ly much closer to the source (Chuzhoy & Zheng, 2007; Semelin & Combes, 2007). Thus, the Ly flux that a random point in the universe observes is dominated by nearby sources. As a result, the fluctuations in the Ly flux are larger and enhance the 21-cm power spectrum. The second effect is caused by the presence of ionized hydrogen (H II) around each source (e.g., Barkana & Loeb, 2001). In this region photons can redshift below the Ly resonance without encountering H I, and thus not participate in the WF effect. Thus, a typical H atom (which by definition is not within an H II region) receives no Ly photons from sources closer than the typical size of an H II bubble. Since galaxy number fluctuations below this scale do not contribute to Ly fluctuations, we expect a cutoff in the 21-cm power spectrum around this scale.
Our calculations are made in a CDM universe matching observations (Spergel et al., 2007), with a power spectrum normalization , Hubble constant , and density parameters , , and for matter, cosmological constant, and baryons, respectively.
2 Lyman series scattering
We assume a uniform neutral IGM that exhibits pure Hubble expansion around a steady point source (Loeb & Rybicki, 1999). The surrounding IGM, mainly H I, is optically thick to the UV radiation that the source emits. We use a Monte-Carlo method for the scattering (Loeb & Rybicki, 1999), for photons of various initial frequencies between Ly and the Lyman limit. The scattering redistributes the distances at which the photons transform to Ly, affecting strongly the photons originally emitted between Ly and Ly . Due to flux conservation, the enhancement of the flux at small scales (by up to a factor of compared to the optically thin case) is balanced by a steep drop on large scales (where Ly). Ly photons produced via cascading from photons emitted above Ly are much less affected (see below), but we fully include these cascades assuming that the resulting Ly photons are emitted at the line center (Furlanetto & Pritchard, 2006). We account for several features that substantially affect the redistribution of photons compared to previous calculations that gave a divergent enhancement near the source (Chuzhoy & Zheng, 2007; Semelin & Combes, 2007). First, we explicitly include the H II region around each source, which results in enhanced Ly scattering just outside the H II region; the enhancement has a shallower rise to a peak value and then drops to zero right near the H II region, because of the loss of photons that are scattered back into the H II region. Second, each hydrogen atom receives Ly photons from sources with an effective spectrum that drops sharply at frequencies approaching Ly; photons at such frequencies are emitted by time-retarded sources that formed in a universe with fewer galaxies, effectively reducing the emission rate (see also section 4 below). We find that scattering strongly enhances this drop in the spectrum. Finally, we also account for the variation of the Hubble constant with redshift, which substantially affects the photons emitted at Ly.
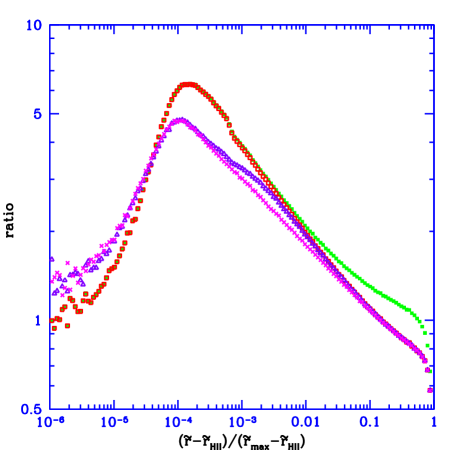
Following Loeb & Rybicki (1999) we define a dimensionless variable , where is the radius for which redshifting a Ly photon due to Hubble expansion would produce a frequency with a remaining optical depth of unity (from there out to infinity, in the direction away from the line center). For example, using the standard cosmological parameters, 1 Mpc (physical), independent of redshift (for a source at high redshift: Loeb & Rybicki (1999)). In Figure 1 we show the ratio between the flux of the source as a result of our calculation as described above and the flux for the case with no redistribution due to scattering, i.e., where the photons simply redshift until they are absorbed at line center. For photons emitted between Ly and Ly we have plotted the ratio as a function of the variable , where is the radius at which an emitted Ly photon redshifts all the way to Ly, and the various radii are expressed in units of . At , comoving Mpc and comoving Mpc. Showing the results as a function of the variable provides a better view of the behavior of the flux very near to the H II region111Note that the numerical noise seen in the Figure very near the H II region occurs where the flux is not significantly enhanced, and thus does not affect our results. Furthermore, this region is within the thickness of the shell of the H II region, and thus is even less important in practice.. We have considered in this Figure a Population II spectrum source, i.e., we approximated the emissivity within this frequency region as , where for Population II (Barkana & Loeb, 2005b; Bromm, Kudritzki, & Loeb, 2001). We have also performed the calculation for a spectrum appropriate for Population III stars (see below). For photons cascading from higher-order Lyman lines, the atomic constants would make the enhancement occur much closer to the H II region edge; e.g., even for Ly, comoving Mpc, comoving Mpc, and a substantial enhancement occurs only at (with the corresponding definition of for Ly), well within the thickness of the partial ionization shell of the H II region, where the flux is in practice strongly suppressed.
3 21cm Fluctuations
In general, fluctuations in can be sourced by fluctuations in the gas density, temperature, neutral fraction, radial velocity gradient, and Ly flux from galaxies. To linear order, perturbing the equation of the brightness temperature, we have , where each describes the fractional perturbation on the quantity ; denotes the baryon density, the gas temperature, the neutral fraction, the Ly coefficient (which is simply the Ly flux measured in units so that Ly flux fluctuations give the largest 21-cm fluctuations when ), and the line of sight velocity gradient [which creates an apparent density fluctuation (Bharadwaj & Ali, 2000; Barkana & Loeb, 2005a)]. The associated time-dependent coefficients are , , , where , , and and describe the collisional 21-cm excitation (Allison & Dalgarno, 1969; Barkana & Loeb, 2005a; Furlanetto et al., 2006). We consider the high-redshift regime before significant cosmic reionization or stellar heating. Due to Compton scattering of the CMB photons with the remaining free electrons after cosmic recombination, the baryon density and temperature fluctuations are not proportional (Naoz & Barkana, 2005).
A Fourier transform yields the brightness temperature fluctuation in -space (where denotes the transform of each quantity) (Barkana & Loeb, 2005a):
| (1) |
where the ratio , in terms of , and in terms of the angle of the wavevector with respect to the line of sight.
We denote by and the power spectra of the fluctuations in baryon density and in the Ly flux, respectively, and the power spectrum as the Fourier transform of their cross-correlation function (Barkana & Loeb, 2005b). The 21-cm power spectrum can then be written in the form where each of the three coefficients can be separately measured from their different dependence (Barkana & Loeb, 2005a). This angular separation of power makes it possible to detect separately different physical aspects influencing the 21-cm signal. In terms of our definitions above, the coefficients are
| (2) | |||||
It is possible to probe whether some sources of are uncorrelated with ; sources that are linear functionals of the baryon density distribution do not contribute to the following quantity (Barkana & Loeb, 2005a):
| (3) |
4 The Ly Flux of Galaxies
We summarize here the calculation of the Ly flux (Barkana & Loeb, 2005b). The intensity of Ly photons observed at a given redshift is due to photons that were originally emitted between the rest-frame wavelengths of Ly and the Lyman limit. Photons that were emitted below Ly by a source simply redshift until they are seen by an atom at at the Ly wavelength. Such photons can only be seen out to a distance corresponding to the redshift , where , the ratio of Ly to Ly wavelengths. Photons above the Ly energy redshift until they reach the nearest atomic level . The neutral IGM is opaque even to the higher levels and so the photon is repeatedly scattered, with a chance of being downgraded to a Ly photon and continuing to scatter, except that the chance is zero for a Ly photon (Pritchard & Furlanetto, 2006; Hirata, 2006). To be seen at the Ly resonance at , the photon must have been emitted below a maximal redshift . The intensity is then (Barkana & Loeb, 2005b):
where absorption at level at redshift corresponds to an emitted frequency at , and is the photon emissivity. We have included the factor (Pritchard & Furlanetto, 2006; Hirata, 2006) which is the fraction of photons absorbed at level that are eventually recycled into Ly photons in their subsequent cascade. The new correction factor is the overall factor by which the Ly flux is changed due to the scattering-induced redistribution of photons that are emitted with frequencies between levels and from sources at a comoving distance from the final destination at redshift (where is a function of and ). Also new to calculations of the 21-cm power spectrum is the lower limit of the integral (), which accounts for the H II regions; in order to receive Ly photons from sources closer than the typical size of an H II region, an H atom would have to be inside an H II bubble – a contradiction.
5 The 21-cm power spectrum
As mentioned above, there are two separate sources of fluctuations in the Ly flux (Barkana & Loeb, 2005b). The first is density inhomogeneities. Since gravitational instability proceeds faster in overdense regions, the biased distribution of rare galactic halos fluctuates much more than the global dark matter density (Kaiser, 1987; Barkana & Loeb, 2004). When the number of sources seen by each atom is relatively small, Poisson fluctuations provide a second source of fluctuations, statistically independent of the first source to linear order. Unlike typical Poisson noise, these fluctuations are correlated between gas elements at different places, since two nearby elements see many of the same sources, though at different distances (Barkana & Loeb, 2005b). Note that although each hydrogen atom receives some Ly flux from sources as far away as 300 comoving Mpc, the fluctuations in flux are actually relatively large because a significant portion of the flux comes from nearby sources.
Due to the geometrical dependence of the flux, the perturbation in the Ly flux due to biased density fluctuations is a linear functional of the underlying density fluctuation field, i.e., the resulting contribution to is related to the Fourier transform of the total density perturbation by multiplication by an effective window function (Barkana & Loeb, 2005b). The total density perturbation is defined as the mass-weighted mean of the dark matter and baryon perturbations; we also define . Under the conditions considered in this paper, the three observable power spectra (eq. 2) can be used to study separately the two sources of Ly fluctuations. In particular, the quantity
| (5) |
is proportional to the biased-density contribution to , while equals the Poisson contribution to except for a factor of .
6 Observable signature
The coupling of the spin temperature to the kinetic temperature through the WF effect requires a relatively low cosmic Ly background, and is expected to occur well before the end of cosmic reionization (Madau et al., 1997). We illustrate our results assuming that the Ly coupling transition achieves at ; this requirement determines the star formation efficiency. We assume that galaxies form within all dark matter halos above some minimum mass (or, equivalently, a minimum circular velocity in terms of the virial radius ). We consider a wide range of possible values: galaxies that form through molecular hydrogen cooling ( km/s), atomic cooling ( km/s), or a minimum mass ten times larger ( km/s) due to feedback effects in low-mass halos. We consider a single H II region size (calculated as having the flux-weighted mean volume); this size is affected by the fraction of stellar ionizing photons that escape into the IGM, and by the stellar population. We consider two extremes, a stellar initial mass function as observed locally (Pop II) or that expected for the very first stars (Pop III; 100 solar mass, zero-metallicity stars).
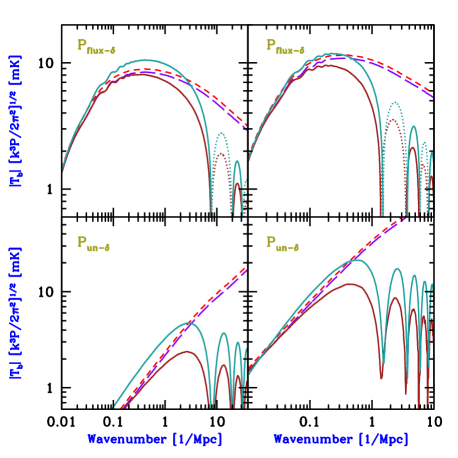
In Figure 2 we show in two representative cases the two separately-measurable power spectrum terms that are due to Ly flux fluctuations arising from biased density fluctuations () or from Poisson fluctuations (). Each term ( or ) starts small on large scales and rises with , forming a peak before dropping (and then oscillating) on the scale of the H II region. Scattering modifies more substantially than , since the former is more strongly dominated by fluctuations on small scales. Note that our assumption of a single H II region size is reasonable since galaxies at these redshifts are rare and almost all lie in halos close to the minimum halo mass. Also, sufficiently early on in reionization, galaxy clustering plays a relatively minor role in determining bubble sizes. In particular, in the cases shown in Figure 2, the cosmic ionized fraction is , and bubbles of sizes between the minimum size (that of a single-source bubble) and twice that size contain most of the ionized volume [2/3 for km/s, and 1/2 for km/s, using the Furlanetto, Zaldarriaga & Hernquist (2004) model]. While the small-scale ringing seen in Figure 2 may be smoothed out by a mild scatter in H II region sizes, the overall shape and in particular the peak of each power spectrum term are robustly determined.
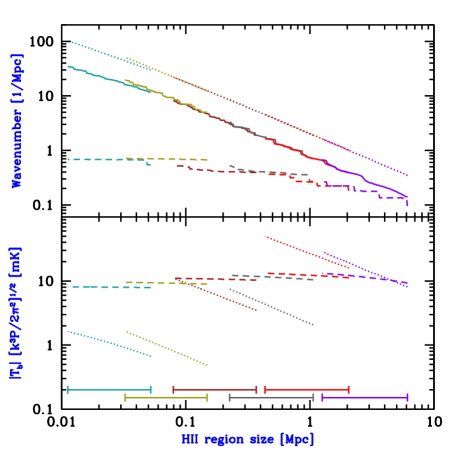
We summarize the main features of the two power spectra through the peak positions ( and ) and heights ( and ). Now, since the flux term would have a peak even without the H II region cutoff (Barkana & Loeb, 2005b), the characteristics of its peak are fairly insensitive to the H II region size; thus, we also consider the position of its cutoff, specifically the lowest value (above ) where the power spectrum drops to 1 mK: . Both and essentially measure the size of the H II region (figure 3). In particular, the product and , each to within a factor of 1.5 over a range of three orders of magnitude of . On the other hand, the position and height of the peak of are relatively insensitive to and thus observing them would constitute a clear consistency check with the theory. The Poisson peak height measures the average number density of galaxies and thus depends mainly on the minimum mass of galactic halos.
We note that if significant X-ray heating happened to occur simultaneously with the Ly coupling transition, then similar fluctuations in the X-ray flux from galaxies would generate 21-cm fluctuations that are even somewhat larger (Pritchard & Furlanetto, 2007); while not included in previous studies, the X-ray fluctuations should similarly be enhanced by scattering and should also show a cutoff at the H II bubble scale. While X-ray heating could possibly occur early, Ly heating is insignificant except after the Ly coupling fully saturates (Chen & Miralda-Escudé, 2004).
The five quantitative characteristics we have focused on typically occur at relatively large scales – a fraction of a Mpc, or arcseconds at – and correspond to relatively large (but still linear) fluctuations: 1–10 mK on a mean background of mK. Thus, the predictions are theoretically robust, and require observational capabilities only somewhat beyond those of the radio arrays being currently constructed. Given current capabilities, 21-cm cosmology is the most promising method for firmly detecting and studying the properties of some of the earliest galaxies that ever formed.
Acknowledgments
We acknowledge support by Israel Science Foundation grant 629/05 and U.S. - Israel Binational Science Foundation grant 2004386.
References
- Allison & Dalgarno (1969) Allison A. C. Dalgarno A., 1969, ApJ, 158, 423
- Barkana & Loeb (2001) Barkana R., & Loeb A., 2001, Phys. Rev. 349, 125
- Barkana & Loeb (2004) Barkana R., & Loeb A., 2004, ApJ, 609, 474
- Barkana & Loeb (2005a) Barkana R., Loeb A., 2005a, ApJ, 624, L65
- Barkana & Loeb (2005b) Barkana R., Loeb A., 2005b, ApJ, 626, 1
- Bharadwaj & Ali (2000) Bharadwaj S. Ali S. S., 2000, MNRAS 356, 1519
- Bromm, Kudritzki, & Loeb (2001) Bromm V., Kudritzki R. P., Loeb A., 2001, ApJ, 552, 464
- Chen & Miralda-Escudé (2004) Chen X., Miralda-Escudé J., 2004, ApJ 602, 1
- Chuzhoy, Alvarez & Shapiro (2006) Chuzhoy L., Alvarez M. A., Shapiro P. R., 2006, ApJ 648 L1
- Chuzhoy & Zheng (2007) Chuzhoy L., Zheng Z., 2007, preprint astro-ph/0706.0895
- Field (1958) Field G. B., 1958, Proc. IRE 46, 240
- Furlanetto et al. (2006) Furlanetto S. R., Oh S. P., Briggs F. H., 2006, Phys Rev 433, 181
- Furlanetto & Pritchard (2006) Furlanetto S. R., Pritchard J. R., 2006, MNRAS, 372, 1093
- Furlanetto, Zaldarriaga & Hernquist (2004) Furlanetto S. R., Zaldarriaga M., Hernquist L., 2004, ApJ 613, 1
- Hirata (2006) Hirata C. M., 2006, MNRAS 367, 259
- Hogan & Rees (1979) Hogan C. J. & Rees M. J., 1979, MNRAS 188, 791
- Kaiser (1987) Kaiser N., 1987, MNRAS 227, 1
- Loeb & Rybicki (1999) Loeb A., & Rybicki G. B., ApJ 1999 524, 527
- Madau et al. (1997) Madau P., Meiksin A.. Rees M. J., 1997, ApJ , 475, 429
- Naoz & Barkana (2005) Naoz S., Barkana R., 2005, MNRAS 362, 1047
- Naoz, Noter & Barkana (2006) Naoz S., Noter S., Barkana R., 2006, MNRAS 373, L98
- Pritchard & Furlanetto (2006) Pritchard J. R., Furlanetto S. R., 2006, MNRAS 367, 1057
- Pritchard & Furlanetto (2007) Pritchard J. R., Furlanetto S. R., 2007 MNRAS 376, 1680
- Semelin & Combes (2007) Semelin B., Combes F., Baek S., 2007, preprint astro-ph/0707.2483
- Spergel et al. (2007) Spergel D. N. et al., 2007, ApJS, 170, 377
- Wouthuysen (1952) Wouthuysen S. A., 1952, ApJ, 57, 31