Evidence for Three Subpopulations of Globular Clusters in the Early-Type Post-Starburst Shell Galaxy AM 0139-65511affiliation: Based on observations with the NASA/ESA Hubble Space Telescope, obtained at the Space Telescope Science Institute, which is operated by the Association of Universities for Research in Astronomy, Inc., under NASA contract NAS5-26555
Abstract
We present deep Hubble Space Telescope ACS images of the post-starburst shell galaxy AM 0139-655. We find evidence for the presence of three distinct globular cluster subpopulations associated with this galaxy: a centrally concentrated young population ( 0.4 Gyr), an intermediate age population ( 1 Gyr) and an old, metal-poor population similar to that seen around normal galaxies. The color distribution of the clusters is bimodal with peaks at 0.85 and 1.35. The redder peak at = 1.35 is consistent with the predicted color for an old metal-poor population. The clusters associated with the peak at = 0.85 are centrally concentrated and interpreted as a younger and more metal-rich population. We suggest that these clusters have an age of 0.4 Gyr and solar metallicity based on a comparison with population synthesis models. The luminosity function of these “blue” clusters is well represented by a power law, . Interestingly, the brightest shell associated with the galaxy harbors some of the youngest clusters observed. This seems to indicate that the same merger event was responsible for the formation of both the shells and the young clusters. The red part of the color distribution contains several very bright clusters, which are not expected for an old, metal-poor population. Furthermore, the luminosity function of the “red” GCs cannot be fit well by either a single gaussian or a single power law. A composite (gaussian + power law) fit to the luminosity function of the red clusters yields both a low rms and very plausible properties for an old population (with gaussian distribution) plus an intermediate-age population (with power-law distribution) of GCs. Hence, we suggest that the red clusters in AM 0139-655 consist of two distinct GC subpopulations, one being an old, metal-poor population as seen in normal galaxies and one having formed during a recent dissipative galaxy merger (likely the same event that formed the 0.4 Gyr old clusters).
1 Introduction
Globular clusters (GCs) are very useful probes of the dynamical and chemical assembly histories of galaxies. Many globular cluster systems in “normal” giant elliptical galaxies show a bimodal color distribution, providing clear evidence for the presence of a “second event” during the formation of these systems (Ashman & Zepf, 1998, and references therein). Spectroscopic studies have revealed that both the blue and red GC populations are typically old ( 8 Gyr, (Forbes et al., 2001; Cohen, Blakeslee, & Côte, 2003; Puzia et al., 2005)) implying that the bimodality is mainly due to a difference in their metallicity. The merger scenario of Ashman & Zepf (1992) predicted the presence of this bimodal distribution. However, different theories were suggested by various authors to explain the nature of the second event. The merger model (Schweizer, 1987; Ashman & Zepf, 1992), predicts that the metal-rich clusters are formed during major mergers of gas-rich galaxies. The “multi-phase collapse” model (Forbes, Brodie, & Grillmair, 1997) implies that they form during a secondary collapse phase of the galaxy, without invoking a merger event. The accretion scenario (Forte, Martinez, & Muzzio, 1982; Côte, Marzke, & West, 1998) proposes that every galaxy is born with a GC system that has a median color (metallicity) according to the color-magnitude relation of galaxies (e.g. Terlevich et al., 1999). The bimodality then arises due to the accretion of low-mass galaxies with metal-poor GCs by a larger galaxy with its metal-rich GCs.
Intermediate-age GCs have been found in several galaxies (Goudfrooij et al., 2001, 2007; Puzia et al., 2002; Kundu et al., 2005; Chandar et al., 2006). A few of these galaxies show features like shells or a disturbed morphology, indicating a recent merger event. Shells are sharply defined, arc-like features, mostly found around elliptical galaxies (Malin & Carter, 1983), though a few (Arp 215, Arp 227) have been found around disk galaxies (Arp, 1966). Two classes of models have been proposed to account for the shells. The internal models (Fabian et al., 1980; Williams & Christiansen, 1985) suggest that shell stars form because of star formation within a giant shell of shocked interstellar gas. On the other hand, the interaction models suggest an external origin for the shell structure and interpret it as arising due to a merger. When an elliptical galaxy accretes a small companion galaxy, some vestiges of the event survive for a Gyr or longer after the merger in the form of ripples and shells (Schweizer, 1980; Quinn, 1984). The morphology and alignment of the resulting shell system depends on the form of the potential of the primary galaxy, the orbital parameters of the collision and the nature of the companion (Hernquist & Quinn, 1988, 1989; Dupraz & Combes, 1986). Typical dynamical ages of shells are 0.5 - 2 years (Nulsen, 1989; Hernquist & Quinn, 1987). These shells, made up of stars, have been frequently observed around ellipticals. Malin & Carter (1983) find 17 and Schweizer & Ford (1985) find 44 of field ellipticals to be surrounded by shells. The presence of shells thus seems to be a common outcome of interactions of galaxies.
To test the merger scenario for GC formation, it is important to study galaxies that show obvious signs of a merger event in the form of shells, ripples, and some signature of having hosted a strong burst of star formation. One way of attempting this is to study E+A galaxies featuring shells. E+A galaxies were originally defined by the combination of an early-type galaxy morphology and the presence of a so-called “post-starburst” spectrum containing strong Balmer absorption lines (indicative of A-type stars) without strong [O ii] or H emission lines (Dressler & Gunn, 1983)111 Subsequent studies revealed the presence of a disk component in many such galaxies, and many papers now use the term k+a, where the k stands for the spectral type of an old stellar population (e.g., Franx, 1993).. The existence of strong Balmer absorption lines indicates that these galaxies have experienced star formation around Gyr ago while the absence of emission lines indicates that star formation must have ceased shortly thereafter. A large fraction (75) of nearby E+A galaxies are located in the field (Zabludoff et al., 1996). Several of these show tidal features indicative of galaxy-galaxy interactions and mergers as the probable mechanism responsible for their formation.
Long-slit spectroscopy of E+A galaxies (Norton et al., 2001) revealed that the young stellar populations are typically more centrally concentrated than the old population, but are not always confined to the inner 1 kpc. Schiminovich et al. (1994) discovered atomic hydrogen associated with the shells of NGC 5128. Subsequently, CO molecules were found in two shells surrounding this elliptical providing evidence that the molecular gas in mergers may not only fall into the nucleus but can also be spread out to large galactocentric radii (Charmandaris et al., 2000). Carter et al. (1988) found evidence for recent nuclear star formation in 20 out of 100 shell galaxies in the Malin & Carter (1983) catalog, suggesting that the process of shell formation may involve some accretion or merger of gas-rich material which would account for the nuclear star formation.
Numerical simulations of the sinking of a gas-rich satellite disk galaxy into a large elliptical galaxy by Kojima & Noguchi (1997) show that the stellar particles from the disk stars of the satellite start making a clear shell structure after the first collision with the elliptical in case of a radial or a retrograde merger. This shell system lasts for 1 Gyr or more. They also find an abrupt reduction in the star formation rate around the time of first passage of the satellite through the center of the elliptical due to the sudden decrease in gas density caused by the gravitational scattering by the elliptical potential.
The study of GCs in such galaxies should yield important information regarding the nature of the E+A phenomenon. If numerous intermediate-age GCs with ages consistent with those of the post-starburst population in the nucleus were to be found, we could be fairly confident that the A stars were formed in a relatively vigorous and distinct star formation event, likely associated with a dissipative galaxy merger. Conversely, an absence of such GCs would indicate that no strong star formation was associated with the event that caused star formation to end 0.5 to 2 Gyr ago. The latter would be consistent with a scenario where gas is removed from the galaxy, e.g. by ram pressure stripping. This paper focuses on a study of the globular cluster system of the early-type shell galaxy AM 0139-655.
2 AM 0139-655
AM 0139-655 (catalog ) (PGC 6240) is a giant early-type galaxy with bright shells that are irregularly distributed around the main body (Malin & Carter, 1983). The nuclear spectrum of AM 0139-655 shows evidence for a post-starburst (E+A) spectrum with very strong Balmer absorption lines (suggesting the presence of a substantial fraction of A-type stars) but no significant [O ii] emission (Carter et al., 1988). AM 0139-655 has a large H equivalent width (13.6 1.0 Å) and an active nucleus. Since AM 0139-655 shows both shell structure (indicative of a merger) and a post-starburst spectrum (signaling a burst of star formation and hence possible globular cluster formation in the recent past), it is a good candidate to explore whether any relations exist between its globular cluster system, its morphology and the merger event that gave rise to the shells. In this paper, we present a detailed photometric study of the GCs of AM 0139-655. The general properties of AM 0139-655 are listed in Table 1.
3 Observations and Data Reduction
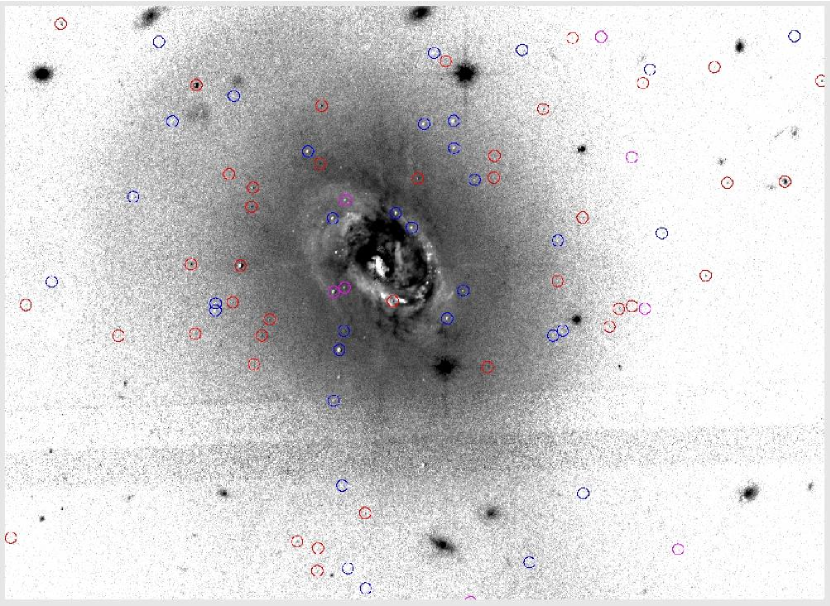
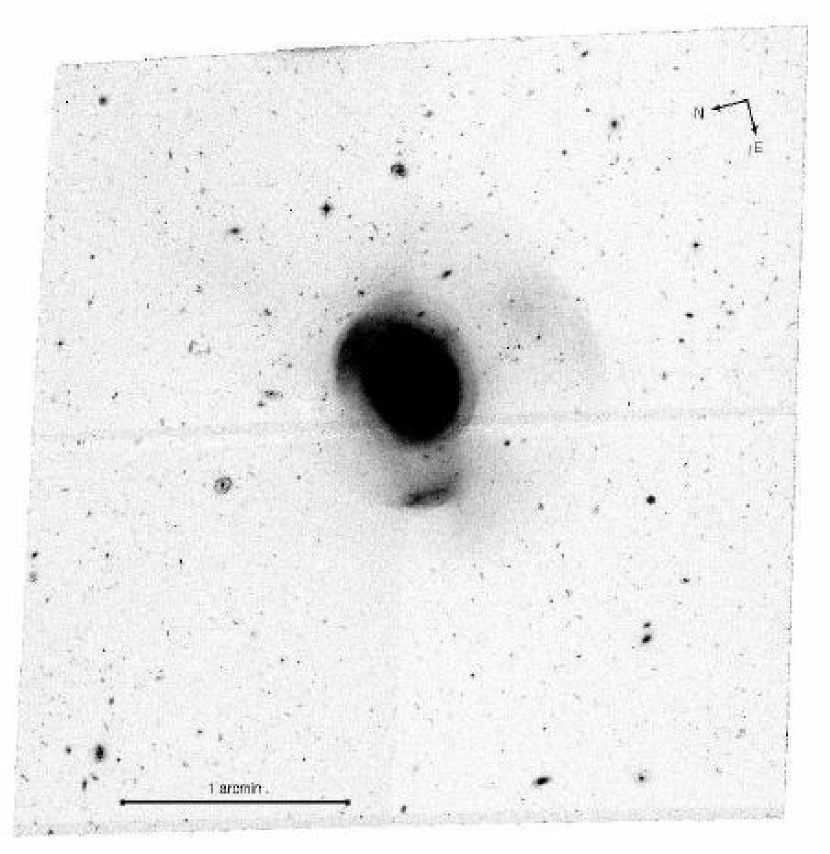
AM 0139-655 (catalog ) was observed with HST on July 16 and 17, 2004, as part of General Observer program 10227, using the Wide Field Channel (WFC) of ACS. It was observed for a total of 6 orbits in the continuous viewing zone (CVZ) of HST with total integration times of 21440 s in the F475W and 7300 s in the F814W filter. The observations consisted of several long exposures at different dither positions as well as a few short ones to prevent saturation of the galaxy center. The data were processed with the ACS on-the-fly pipeline which included dark and bias subtraction and flat fielding. Each flat-fielded image was carefully checked for satellite trails and saturated pixels in the central region of the galaxy. These pixels were flagged and masked out. The individual images in each band were co-added using the PyRAF task MULTIDRIZZLE (Koekemoer et al., 2002). This procedure removed all the cosmic rays and corrected for geometric distortion. The combination of the short and long exposure images enabled us to get good resulting multidrizzled images with unsaturated centers. The final combined F475W image is shown in Fig. 1.
4 Photometry
The search for sources was performed on an image made from the summed F475W+F814W image in the following manner. The F475W and the F814W images from multidrizzle were added together. To improve the detection and the accuracy of the photometry, especially for the faint sources embedded within the bright galaxy background, the underlying galaxy light was first modeled. Extensive experimentation showed that the application of a circular median filter gave the best results. Object detection was done by using the DAOFIND routine in the DAOPHOT package (Stetson, 1987) on an image obtained by dividing the combined image by the square root of the median filtered image (thus providing uniform shot noise characteristics over the whole frame). The advantage in using the g+I image rather than the individual images for source detection is the greater depth reached by the combined image. Also, the photometric zero-point of g+I is significantly less dependent on the color of the source than the individual g or I images, which helps during the completeness correction (see Goudfrooij et al. 2007 for a detailed discussion). The detection threshold was set at 4 above the background. Typical half-light radii of globular clusters are in the range 1- 20 pc (Kundu & Whitmore, 2001; van den Bergh & Mackey, 2004; Jordán et al., 2005). At the distance of AM 0139-655, the scale is 25 pc per ACSWFC pixel. Thus, we expect the globular clusters to be nearly unresolved point sources on the image.
Smooth, median-filtered model images were created in each of the two bands from the corresponding multidrizzle combined images in a manner similar to the one described above. The model was subtracted from the corresponding original images to get a residual image in which the galaxy light has been removed to a great extent and the compact objects are clearly visible. To confirm that the subtraction procedure did not alter the error statistics of the photometry, we compared the magnitudes obtained from the subtracted and the original images for a few bright sources in the frame. The differences between the two methods were well below the photometric errors. Aperture photometry was carried out on these residual images through an aperture of 3 pixel radius (015). In order to discard obvious spurious detections (e.g. edges of the image), objects with magnitude errors greater than 0.4 mag were rejected at this point. Aperture corrections from 3 pixel (015) to 10 pixel (05) radius were determined using a few bright point sources in each band. The corrections from 0″.5 to infinity were taken from Sirianni et al. (2005). The total aperture corrections were 0.4700.009 and 0.5170.010 in F475W and F814W respectively. The transformation from the instrumental magnitudes (STMAG) to SDSS g- and Cousins I-band was done using the SYNPHOT package in STSDAS. Synthetic spectra of stellar types ranging from B0V to K3III from the Bruzual & Charlot (1993) library were convolved with the SDSS g and the Cousins I filter to obtain magnitudes relative to Vega, and with the F475W and the F814W filters to yield magnitudes in the STMAG system. Fitting polynomials to get the relation between the two systems resulted in the following transformations:
| (1) | |||||
4.1 Globular Cluster Candidate Selection
The photometry lists with the magnitudes in g and I obtained in the preceding section also included foreground stars and extended objects, in addition to cluster candidates. To remove these contaminating sources we applied two selection criteria based on the FWHM and the compactness of each source. We obtained the direct FWHM of each of the sources in the photometry list in each band using the task IMEXAM within IRAF222IRAF is distributed by the National Optical Astronomy Observatories, which are operated by the Association of Universities for Research in Astronomy, Inc., under cooperative agreement with the National Science Foundation. in batch mode. Since the FWHM of bright stars in our frame is 2.0 pixels and we expect all the cluster candidates to be nearly unresolved point sources, we discarded all sources that did not satisfy the criterion 1.5 FWHM 3.0 pixels. We also added a compactness criterion wherein only sources that had the difference in the magnitudes between aperture radii of 2 pixels and 5 pixels lie between 0.2 mag and 0.6 mag were retained. This ensured (to a great extent) that the contamination from background galaxies was minimized. To study the radial extent and distribution of the GC candidates so obtained, they were binned into annuli 400 pixels wide, starting from the center of the galaxy out to the corners of the ACS frame. An effective area was calculated for each annulus namely the total area of the pixels that lie within the annulus which had a non-zero value of intensity. This ensured that the masked-out regions like the chip gap were not considered while computing the area since these areas were also excluded during cluster finding. We plot the logarithm of the number of sources per kpc2 as a function of the projected distance from the center of the galaxy and find that it reaches an asymptotic value at a projected radius of about 40 kpc (see Fig. 2). Given the large distance of the galaxy and hence, the small angular size of AM 0139-655, it was possible to use the outer parts of the image to estimate the contamination due to compact background sources.
From the Burstein & Heiles (1982) model, we find the Milky-Way foreground extinction = 0.00. The resulting g versus color-magnitude diagram for the candidate globular clusters is shown in Fig. 3. The rectangle delineates the sources that meet our criteria for globular cluster candidates. Using the GALEV simple stellar population (SSP) models (Anders & Fritze-v. Alvensleben, 2003), we determine the color range of 0 2.0 to include all clusters over the range of ages from to years and metallicity z values from 0.0004 to 0.05 (where z = 0.02 represents solar metallicity). All sources with colors redder than 2.0 are expected to be late-type foreground stars or red background galaxies and are rejected in the subsequent analysis. The final list, thus obtained, contains a total of 217 globular cluster candidates. Typical photometric errors in g were 0.01, 0.03, 0.15 and 0.2 mag for magnitude intervals 22-24 mag, 24-26 mag, 26-28.75 mag and fainter than 28.75 mag respectively. The brightest fifty GC candidates are listed in Table 2.
4.2 Completeness Corrections
Completeness tests were performed on the combined g+I image, i.e., the one used for detection of cluster candidates. Artificial objects were added in batches of 100 for five background levels and several magnitude intervals. The background levels were computed from the g+I image in the following manner. The counts in the outermost parts of the image, free from any galaxy light contamination were taken as Background level #1. The counts in the innermost region of the galaxy where clusters are detected were taken as Background level #5. This difference between the faintest and the brightest background levels was then divided into five equal intervals in log space to get the five mean background levels. The radial intensity profile of the artificial input globular clusters was determined by fitting PSFs to the cluster candidates in the original image. The image was divided by the square root of a median-filtered version of itself and source detection was performed on the resultant image, with the same procedure as used for the initial source finding. Further, the ranges of the FWHM, compactness and maximum permissible error in the derived magnitudes were also selected in exactly the same manner as that for the actual source photometry. The resultant completeness curves are shown in Fig. 4.
5 Color Bimodality
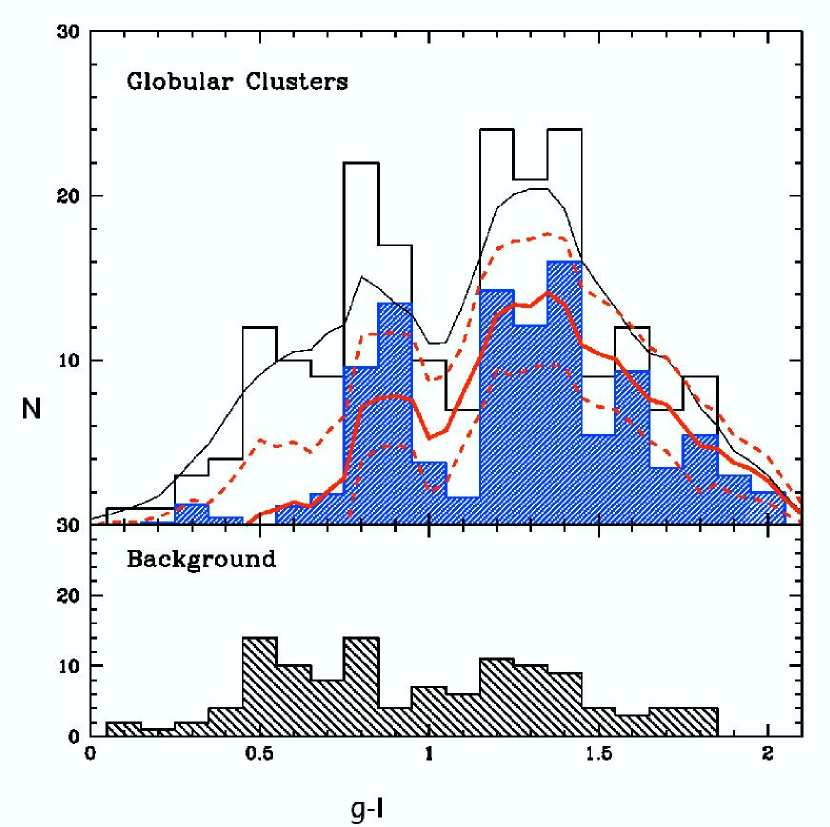
To analyze the color distribution of globular clusters in AM 0139-655, we start by computing the non-parametric Epanechnikov-kernel probability density function of all objects inside the analysis radius of 40 kpc (Silverman, 1986). Given the photometric completeness of our data is the closest approximation to the real color distribution of globular clusters. The width of the adaptive kernel linearly depends on the statistical color uncertainty of every individual object, so that the initial noise statistics of the color measurements is translated into the final probability density estimate. To account for uncertainties due to the limited sample size, we bootstrapped this process 100 times and derive 90% confidence limits of the resulting probability density function.
With the same technique we also computed the probability density function of the background field derived from the detections. We then scaled the background density estimate to the object function by area. We note that the error associated with the scaling of the function is included in our bootstrap routine and propagated to the uncertainty of the final density estimate. We finally derive the color distribution of globular cluster candidates by statistical subtraction:
| (2) |
where is the ratio of areas encompassed by the object versus background regions. Figure 5 shows the background corrected function. The final color distribution appears clearly extended and, taking the 90% error margins into account, bimodal with peaks at = 0.85 and = 1.35. A rather extensive red wing to the red peak is present, which will be discussed in Sect. 7. KMM tests (McLachlan & Basford, 1988; Ashman et al., 1994) were also run on the background subtracted color distribution. The KMM test for two components resulted in peak values consistent with those found using the Epanechnikov kernel. The test for three components resulted in a third peak with = 1.45 but without any clusters assigned to it.
Although we do not know the effects of possible internal extinction on individual GCs, the fact that the blue peak of the GC color distribution found in AM 0139-655 at = 1.35 is consistent with = 0.95 (for 14 Gyr old, metal-poor clusters from SSP models) which agrees with the blue peak of GCs in the Milky-Way indicates that on average the internal visual extinction is very small. At the same time, this also supports our assumption that the Milky-Way foreground extinction is near zero, as predicted by the Burstein & Heiles (1982) model.
5.1 Spatial Distribution of the Blue and Red Subpopulations
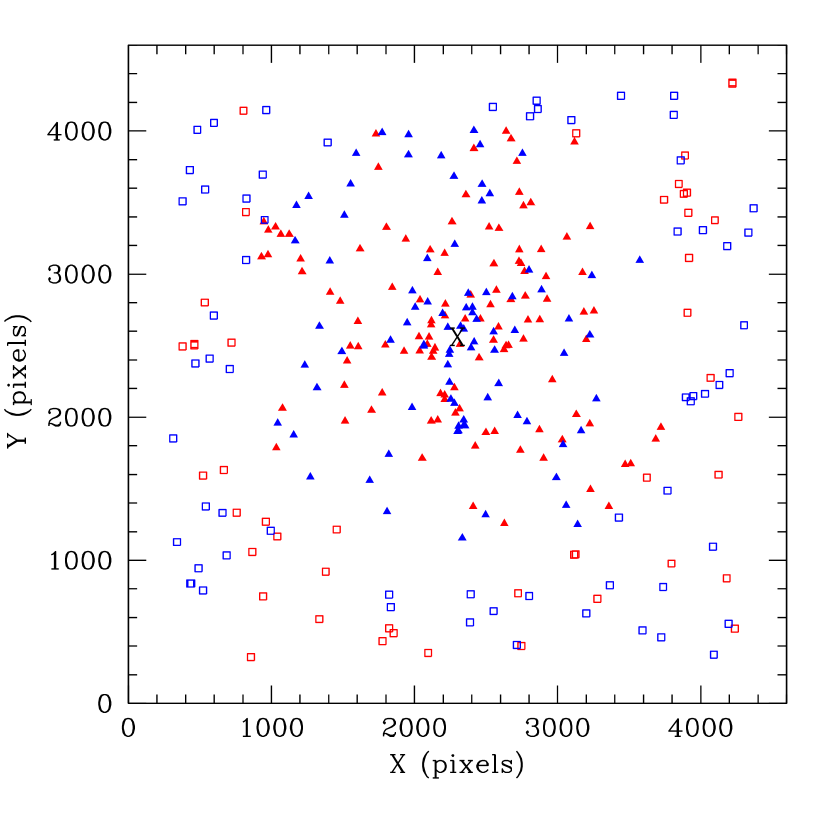
As shown in the preceding section, the color distribution of the clusters has a bimodal form with peaks near = 0.85 and 1.35. The spatial distributions of the two subpopulations were derived by dividing the clusters into two subpopulations based on their colors. Clusters which lie in the range 0 0.95 were designated as the blue population and those within 1.15 2.0 were designated as the red population. The region 0.95 1.15 was avoided to minimize mixing of the two populations. This yielded 84 blue clusters, 114 red clusters and 19 clusters that lie in the region of mixing.
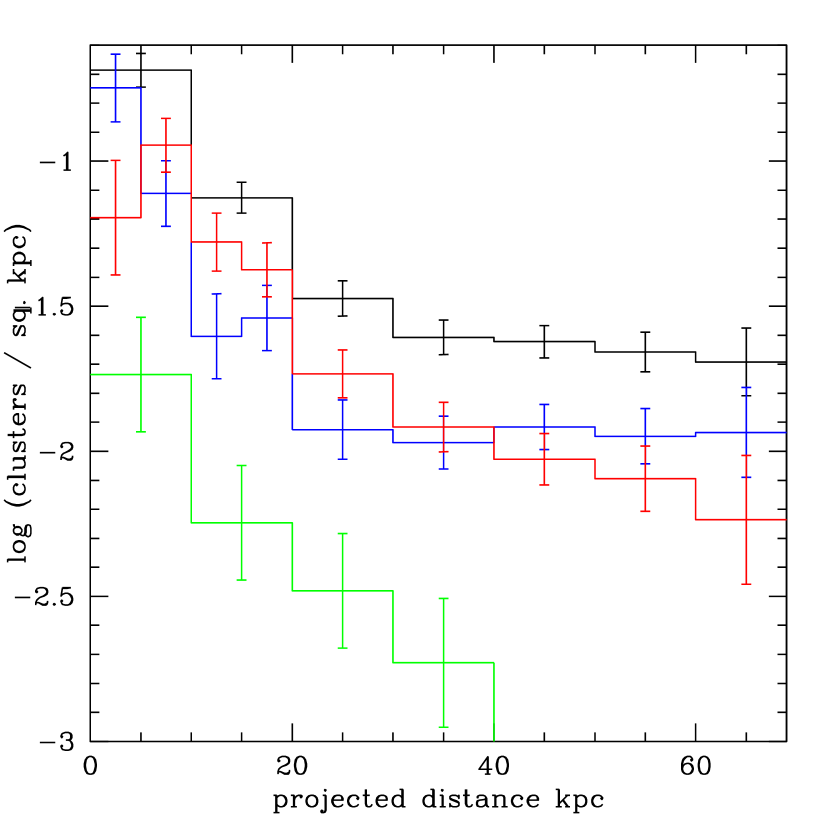
Figure 2 shows the radial distribution of the blue and red samples. The bins were chosen in such a way that there were at least five clusters in each bin in the region within 40 kpc. It is clear from the figure that the blue clusters are more concentrated towards the center and their surface density falls as we go away from the center. On the other hand, the surface density of the red clusters is somewhat low in the center and may peak between 5-10 kpc from the center of the galaxy. The surface density distribution of the 19 GCs that lie in the intermediate color range is also shown in Fig. 2. This distribution appears to peak at the center. Adding all these clusters to the blue clusters would not change the trend for the blue clusters while adding them to the red clusters would tend to somewhat dilute the effect in the central regions.
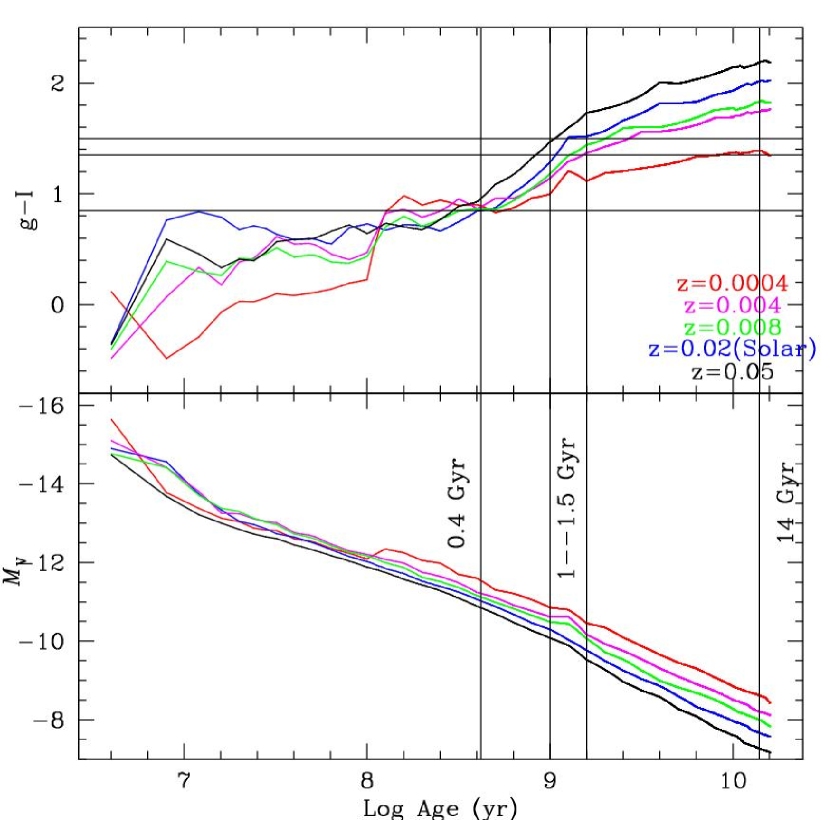
We used the SSP models described in Anders & Fritze-v. Alvensleben (2003) to estimate the ages of the two populations. These models include continuum and line emission and take into account the important contribution of gaseous emission to broad-band fluxes and their strong metallicity dependence during the very early evolutionary stages of star clusters. The top panel of Fig. 6 shows the dependence of color on the age of the cluster. From the figure, we see that the red peak in the color distribution at = 1.35 can be explained by clusters of age 14 Gyr and metallicity Z= 0.0004 which agrees very well with the colors expected for the old, metal-poor globular cluster population that forms the blue peak in normal ellipticals or spirals. The blue peak of the color distribution at = 0.85 can be explained by a younger population of clusters of solar metallicity with an age 0.4 Gyr. Note that this age estimate is fairly independent of the metallicity: See Fig. 6. This is consistent with the E+A nature of AM 0139-655. We assume solar metallicity for these clusters since several spectroscopic studies of luminous intermediate-age globular clusters in a number of merger remnants have shown that they have near-solar metallicities (NGC 7252 (Schweizer & Seitzer, 1998); NGC 3921 (Schweizer et al., 2004); NGC 1316 (Goudfrooij et al., 2001) and NGC 5128 (Peng et al., 2004)). HST imaging studies of the same merger remnants show that these young clusters are more concentrated towards the galaxy center than the old metal-poor clusters (Miller et al., 1997; Schweizer et al., 1996; Goudfrooij et al., 2001; Peng et al., 2004), as predicted by Ashman & Zepf (1992) who modeled the formation of clusters in a dissipative galaxy merger.
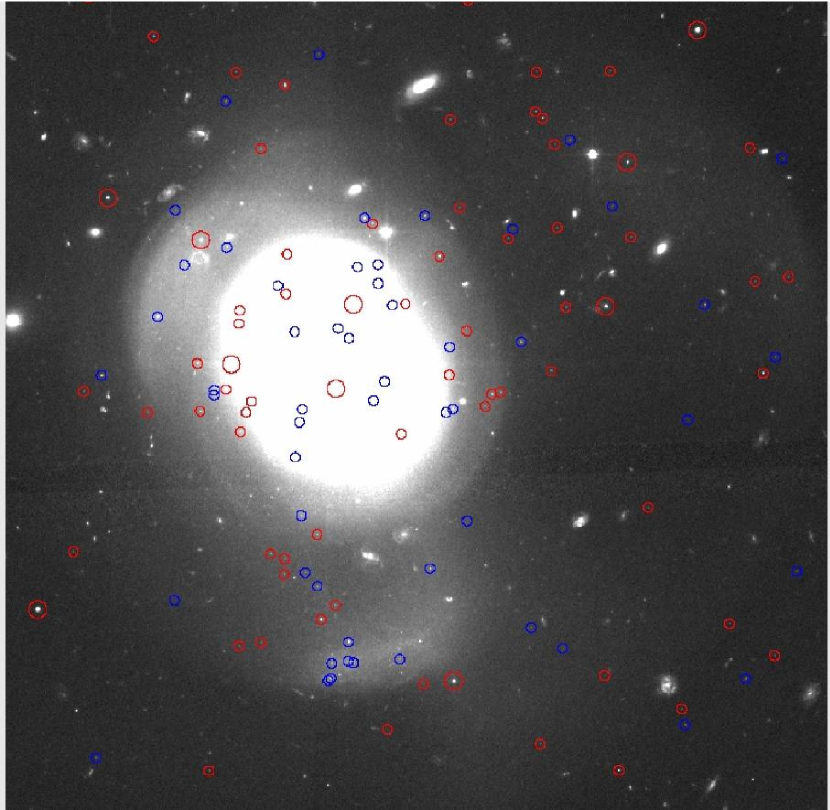
Figure 7 shows the projected spatial distribution of the blue and the red clusters while Fig. 8 shows the color map obtained by dividing the g image by the I image. In Fig. 8, note the presence of a blue ring-like structure surrounding the center and the blue clusters present along the ring. Another interesting fact is that the brightest and the most distinct shell (lying between 14.8-16.7 kpc to the East of the galaxy center) harbors seven blue clusters (Fig. 9), all of which fall within the color range 0.70 0.91, consistent with SSP model ages between 0.25-0.4 Gyr. Thus, it appears that all the clusters associated with this shell were formed during the latest burst of star formation. We suggest that the same event that formed the shell structure also gave rise to the young globular cluster population.
6 Luminosity Function of AM 0139-655
To derive the luminosity functions (LFs) of the clusters, we proceeded in the following manner. A completeness correction was applied to each cluster depending on its magnitude and background level. This was determined from the curves shown in Fig. 4 using bilinear interpolation. The clusters were then divided into two groups depending on their distance from the galaxy center. The clusters within a projected distance of 40 kpc from the center of the galaxy were considered as actual GC candidates and the ones farther were considered as contaminants (foreground stars and compact background galaxies). The LFs of the GC candidates were then corrected for background contamination using the smoothed and scaled LFs of these objects. The LFs obtained after completeness and background contamination correction and the uncorrected LFs in the I-band are shown in Fig. 10.
Given the distance modulus of 35.3 for AM 0139-655, the globular cluster turn-over magnitude for old, metal-poor GCs is expected at I = 27.2 (for = -8.1) (Harris, 1996). As seen from the figure, the data does not quite reach the peak of the turnover. We analyze the luminosity functions of the blue and red clusters separately.
6.1 Luminosity Function of the Blue Clusters
As mentioned above in Section 5.1, all clusters with colors in the range are considered as blue clusters. Figure 10 (middle panel) shows the luminosity function of these blue clusters. A power-law fit to the LF of the blue clusters yields (L)dL L-α dL with = , consistent with the results of previous LF studies of young clusters in mergers and merger remnants which find power-law indices in the range (Whitmore & Schweizer, 1995; Meurer et al., 1995; Whitmore et al., 1999; Whitmore, 2003).
6.2 Luminosity Function of the Red Clusters
Clusters within the color range were classified as red clusters and their luminosity functions derived (Fig. 10, bottom panel). Attempts to fit their luminosity function by either a single gaussian or a single power law yielded large residuals. Upon close examination of the color-magnitude diagram, we found a significant number of very luminous red clusters. If the red clusters were attributed solely to an old, metal-poor population, with a mass function similar to that in our Galaxy, the brightest clusters would not be expected to be brighter than = 10.0 (g = 25.0), yet we find an excess of clusters as bright as g = 23.5. In addition, the color distribution of the red clusters shows a broad tail towards red colors (Fig. 5) which suggests the presence of more than one sub-population.
6.2.1 Modeling the Composite Luminosity Function
Spectroscopic studies of intermediate-age clusters in NGC 1316 (Goudfrooij et al., 2001) and NGC 5128 (Peng et al., 2004) have shown that they have near-solar metallicities. Simulations of the color-magnitude diagrams of evolving clusters by Whitmore et al. (1997) show that solar metallicity clusters in the age range of 1-2 Gyr are the most difficult to identify since they have nearly the same colors as the old, metal-poor GC subpopulation. However, they are significantly (2-2.5 mag) brighter than the old ones for a given mass. Whitmore et al. (1997) also find that solar metallicity clusters older than 2 Gyr will be redder than the old, metal-poor cluster population. Using the SSP models shown in Fig. 6, we see that the range of colors corresponding to the red cluster distribution in AM 0139-655 can indeed be explained by a metal-poor population about 14 Gyr old, but also by a metal-rich younger population about 1-1.5 Gyr old. To test whether our observed distribution may indeed be the result of two distinct populations of the same color but different ages and metallicities, we model the observed luminosity function as a combination of two populations; one old, metal-poor population which is consistent with a gaussian magnitude distribution and the other an intermediate-age population of solar metallicity, which can be described by a power law (e.g. Goudfrooij et al., 2004).
To constrain the possible relative contributions of the two populations, we consider the specific frequency of GCs,
| (3) |
i.e., the number of star clusters per galaxy luminosity normalized to an absolute V magnitude of 15 (Harris & van den Bergh, 1981). To estimate the contribution of the old, metal-poor cluster population to the mixed luminosity function, we need to first consider the possible values of the progenitors and their V magnitude. Assuming AM 0139-655 was formed by a merger of two galaxies, the progenitor galaxies could have been two spirals or one elliptical and one spiral. Since there is no a priori obvious way of determining the nature of the progenitors, we consider various scenarios.
The specific frequency is known to increase systematically along the Hubble sequence, from 0.5 0.2 for Sc spirals to 2.6 0.5 for ellipticals outside of clusters (Harris, 1991). Hence, we consider four values of (0.25, 0.5, 1.0 and 3.0) covering the range from spirals to ellipticals to describe the possible specific frequencies of the progenitors. We use the V magnitude of AM 0139-655 to estimate the combined V magnitude of the progenitors. This will be a rough estimate and will tend to overestimate the luminosity since star formation during the merger would brighten the merger remnant. However, the V magnitude of AM 0139-655 is not listed in the literature. Hence, we first calculate the total g and I magnitudes of AM 0139-655 from our images using ellipse fits and calculate from these magnitudes. We get g = 13.64; I = 12.34 and hence, = 1.30.
Using this, we find the luminosity-weighted age of 1 Gyr for a solar metallicity population at this from Fig. 6. A 1 Gyr solar metallicity population has = 0.89 and hence V = 13.23 according to the GALEV models. We then compute the fading in the V band from this age to an age of 14 Gyr from the lower panel of Fig. 6. We use luminosity-weighted age at solar metallicity as we are attempting to separate the intermediate-age clusters (which should have about solar metallicity) from the old, metal-poor GC population. Though a SSP is not a very good approximation to a galaxy, it is sufficient for our purpose since we are interested in getting a rough estimate of the fading of the galaxy. Using the faded value of V = 15.84 ( = -19.45), in the equation for , we calculate the number of old globular clusters expected for the four values given above. The estimated gaussians for the old, metal-poor population were calculated using = 8.1 and = 1.2 (Harris, 1996; Barmby, Huchra, & Brodie, 2001) for each . Fig. 11 shows the observed luminosity function of the red clusters and the estimated gaussians for the four values of . Subtracting the contributions to the gaussians in each case and examining the residuals, we find that the residuals in each case can be fit by power laws with power-law indices between -1.6 and -1.85 consistent with values found for intermediate-age cluster populations. The rms values of the difference between the power law fits and the histograms in the right panel of Fig. 11 are 4.08, 2.88, 3.28 and 3.02 for = 3.0, 1.0, 0.5 and 0.25 respectively. The above analysis suggests that the red cluster population in AM 0139-655 is in fact a combination of two populations of different ages. To conclude, we have identified three populations of GCs in AM 0139-655: one blue, metal-rich population of young clusters and a red population that can be split into two populations, one old (14 Gyr) metal-poor and one of intermediate age (1-1.5 Gyr) and solar metallicity. Since the two populations contributing to the red peak had similar colors, the KMM test could not identify them as separate populations. The estimates of ages, metallicities and the number of clusters (corrected for background contamination and completeness) belonging to the three sub-populations are given in Table 3 for the various possible scenarios. However, spectroscopic observations of the brightest candidates from the three populations will be necessary to derive exact metallicities and verify our tentative interpretation.
6.3 Masses of the Clusters
It is illustrative to estimate the masses of the bright clusters formed during the merger and compare them to the masses of the most massive clusters in our Galaxy ( Cen with a mass ) and M31 (Mayall II, G1), with a mass (Meylan et al., 2001).
Fig. 12 shows curves of constant mass superimposed on the color-magnitude diagram. To derive these masses, a grid was constructed for the observed magnitude and color range. These magnitudes were then faded to an age of 14 Gyr. Masses were assigned to each cluster by assuming the value of to be 4.1 (at 14 Gyr), as found by Meylan et al. (1995). We find that several clusters in AM 0139-655 will have masses greater than that of the most massive cluster in our galaxy and comparable to the most massive cluster G1 in M31 when they age to 14 Gyr without subsequent mass loss due to stellar evolution since this mass loss is small beyond 1 Gyr (Anders & Fritze-v. Alvensleben, 2003). The clusters will lose stars during their dynamical evolution. Their stellar-dynamical mass loss, however, cannot be evaluated with any confidence without orbital information.
The masses derived in this way have two caveats. First, the mass-to-light ratio is assumed to be equal to that of Cen. Various studies (Meylan et al., 1991) find a wide range (1.2 to 5.2) of mass-to-light ratios for GCs. According to Bruzual & Charlot (2003) models computed using the Chabrier (2003) IMF and lower and upper mass cut-offs and , of a 14 Gyr solar metallicity population is 4.3 while that of a population of the same age is 2.0. Hence, a mass-to-light ratio of 4.1 is a good approximation for solar metallicity clusters. In the absence of any spectroscopic data on these clusters, these values can be taken as rough estimates. Secondly, the effects of internal reddening (though expected to be small from Sect. 5), have not been taken into account. This is not expected to change the mass ranges much since dereddening would tend to shift the points to brighter magnitudes and bluer colors (upward and to the left in Fig. 12), which is nearly parallel to the curves of equal mass.
7 Nature of the Progenitors
In a recent study of GC systems around six shell ellipticals, Sikkema et al. (2006) typically find bimodal distributions similar to those of normal ellipticals. They find some indications of the presence of a younger intermediate-age globular cluster population in two of their galaxies, but the number of these intermediate-age clusters is small as compared to the old clusters. However, in the case of AM 0139-655, we find that the cluster system is dominated by the young and the intermediate-age clusters with a relatively small contribution from the old, metal-poor clusters. In order to constrain the number of old, metal-rich clusters that might have been inherited from the progenitors, we note that there is some evidence for a small peak which is consistent with a redder, metal-rich sub-population (at = 1.8) as expected for a sub-solar metallicity from the SSP models. The small number of GCs in this minor peak suggests the absence of a significant bulge in either precursor. Additionally, for the four values of considered for modeling the LF of the precursors, the rms values point out that at least one of the progenitors was not an elliptical, but had small values 1, which is consistent with Hubble types of Sb or later (Chandar et al., 2004; Goudfrooij et al., 2003) which have small bulges. Both the above findings seem to suggest that the galaxies involved in the merger that formed AM 0139-655 did not have a large bulge generally seen in early-type galaxies but were most likely late-type spirals with small bulges. A merger involving late-type gas-rich spirals could have formed one population of new GCs about 1 Gyr ago in a starburst at first pericenter and another one 0.4 Gyr ago at final merging (Mihos & Hernquist, 1996).
From the fact that we see evidence for a young and intermediate-age component of clusters in AM 0139-655, we can safely assume that at least one of the galaxies involved in the recent interaction must have been rich in gas since there were two episodes of star formation within the time periods for shell survival. This is also supported by the fact that AM 0139-655 itself has strong Balmer absorption lines, which suggests that at least one of the progenitors must have been gas-rich and hence could not have been an early-type with a large bulge.
8 Summary and Conclusions
Deep ACS images of the post-starburst shell galaxy AM 0139-655 have been analyzed. We find a total of 217 GC candidates associated with this galaxy. The color distribution of the clusters shows two distinct peaks, one at = 0.85 and the other at = 1.35. We compare the colors with SSP models and find that the red peak coincides with the color expected of the old, metal-poor population. The blue peak corresponds to a young population (0.4 Gyr) assuming solar metallicity. The luminosity function of the blue clusters can be fit by a power law of index -1.80.1, as is expected for young clusters. The red part of the distribution shows a long tail and the presence of several luminous clusters. We show that the luminosity function of the red clusters can be modeled as a combination of two subpopulations: An old population with a gaussian distribution and an intermediate-age population with a power law distribution. Thus, three subpopulations of globular clusters are clearly distinguishable in AM 0139-655. The number of clusters in the old, metal-rich subpopulation that is commonly associated with “normal” early-type galaxies is very small relative to the three aforementioned subpopulations. The combination of this dearth of old, metal-rich clusters and the fact that the LF of the old population is best fit by a small value of supports the notion that any bulge in the progenitor galaxies must have been small.
The ages of the two younger GC subpopulations are comparable to typical lifetimes of shell structures formed during simulations of galaxy mergers, and the brightest shell actually seems to host several young GCs. This strongly suggests that both the shells and the young and intermediate-age GCs were formed during a dissipative merger. It thus seems fairly likely that the E+A signatures of this galaxy are due to this recent merger. These findings lend credence to the “merger scenario” for the formation of metal-rich GCs and their galaxy hosts.
References
- Anders & Fritze-v. Alvensleben (2003) Anders, P., & Fritze-v. Alvensleben, U. 2003, A&A, 401, 1063
- Arp (1966) Arp, H. 1966, ApJS, 123, 1
- Ashman & Zepf (1992) Ashman, K.M., & Zepf, S.E. 1992, ApJ, 384, 50
- Ashman et al. (1994) Ashman, K.M., Bird, C.M., & Zepf, S.E. 1994, AJ, 108, 2348
- Ashman & Zepf (1998, and references therein) Ashman, K.M., & Zepf, S.E. 1998, In Globular Cluster Systems, (Cambridge Univ. Press, Cambridge)
- Barmby, Huchra, & Brodie (2001) Barmby, P., Huchra, J.P., & Brodie, J, P. 2001, AJ, 121, 1482
- Bruzual & Charlot (1993) Bruzual, G. A., & Charlot, S. 1993, ApJ, 405, 538
- Bruzual & Charlot (2003) Bruzual, G. A., & Charlot, S. 2003, MNRAS, 344, 1000
- Burstein & Heiles (1982) Burstein, D., & Heiles, C. 1982, AJ, 87, 1165
- Carter et al. (1988) Carter, D., Prieur, J.L., Wilkinson, A., Sparks, W.B., & Malin, D.F. 1988, MNRAS, 235, 813
- Chabrier (2003) Chabrier, G. 2003, PASP, 115, 763
- Chandar et al. (2006) Chandar, R., Puzia, T.H., Sarajedini, A., & Goudfrooij, P. 2006, ApJ, 646, 107
- Chandar et al. (2004) Chandar, R., Whitmore, B., & Lee, M.G. 2004, ApJ, 611, 220
- Charmandaris et al. (2000) Charmandaris, V., Combes, F., & van der Hulst, J.M. 2000, A&A, 35, L1
- Cohen, Blakeslee, & Côte (2003) Cohen, J.G., Blakeslee, J.P., & Côte, P. 2003, ApJ, 592, 866
- Côte, Marzke, & West (1998) Côte, P., Marzke, R.O., & West, M.J. 1998, ApJ, 501, 554
- Dressler & Gunn (1983) Dressler, A., & Gunn, J.E. 1983, ApJ, 270, 7
- Dupraz & Combes (1986) Dupraz, C., & Combes, F. 1986, A&A, 166, 53
- Fabian et al. (1980) Fabian, A.C., Nulsen, P.E.J., & Stewart, G.C. 1980, Nature, 287, 613
- Forbes et al. (2001) Forbes, D.A., Beasley, M.A., Brodie, J.P., & Kissler-Patig, M. 2001, ApJ, 563, L143
- Forbes, Brodie, & Grillmair (1997) Forbes, D. A., Brodie, J.P., & Grillmair, C.J. 1997, AJ, 113, 1652
- Forte, Martinez, & Muzzio (1982) Forte, J.C., Martinez, R.E., & Muzzio, J.C. 1982, AJ, 87, 1465
- Franx (1993) Franx, M. 1993, PASP, 105, 1058
- Goudfrooij et al. (2001) Goudfrooij, P., Mack, J., Kissler-Patig, M., Meylan, G., & Minniti, D. 2001, MNRAS, 322, 643
- Goudfrooij et al. (2003) Goudfrooij, P., Strader, J., Brenneman, L., Kissler-Patig, M., Minniti, D., & Huizinga, E.J. 2003, MNRAS, 343, 665
- e.g. Goudfrooij et al. (2004) Goudfrooij, P, Gilmore, D., Whitmore, B.C., Schweizer, F. 2004, ApJ, 613, L121
- Goudfrooij et al. (2007) Goudfrooij, P., Schweizer, F., Gilmore, D., & Whitmore, B.C. 2007, astro-ph/0702467
- Harris & van den Bergh (1981) Harris, W.E., & van den Bergh, S. 1981, AJ, 86, 1627
- Harris (1991) Harris, W.E. 1991, ARA&A, 29, 543
- Harris (1996) Harris, W.E. 1996, AJ, 112, 1487
- Hernquist & Quinn (1987) Hernquist, L., & Quinn, P.J. 1987, ApJ, 312, 1
- Hernquist & Quinn (1988) Hernquist, L., & Quinn, P.J. 1988, ApJ, 331, 682
- Hernquist & Quinn (1989) Hernquist, L., & Quinn, P.J. 1989, ApJ, 342, 1
- Jordán et al. (2005) Jordán, A., Côte, P., Blakeslee, J. P.. et al. 2005, ApJ, 634, 1002
- Koekemoer et al. (2002) Koekemoer, A.M., Fruchter, A.S., Hook, R.N., & Hack, W. 2002, in The 2002 HST Calibration Workshop: Hubble after the Installation of the ACS and the NICMOS Cooling System, ed. S. Arribas, A. Koekemoer, & B. Whitmore (Baltimore: Space Telescope Science Institute), p.337
- Kojima & Noguchi (1997) Kojima, M., & Noguchi, M. 1997, ApJ, 481, 132
- Kundu & Whitmore (2001) Kundu, A., & Whitmore, B. C. 2001, AJ, 121, 2950
- Kundu et al. (2005) Kundu, A., Zepf, S.E., Hempel, M., et al. 2005, ApJ, 634, L41
- Malin & Carter (1983) Malin, D.F., & Carter, D. 1983, ApJ, 274, 534
- McLachlan & Basford (1988) McLachlan, G. J., & Basford, K. E. 1988, In:Mixture Models: Inference and Application to Clustering (New York: Dekker)
- Meurer et al. (1995) Meurer, G.R., Heckman, T.M., Leitherer, C., Kinney, A., Robert, C., & Garnett, D.R. 1995, AJ, 110, 2665
- Meylan et al. (1991) Meylan, G., Dubath, P., & Mayor, A. 1991, ASPC, 13, 158
- Meylan et al. (1995) Meylan, G., Mayor, M., Duquennoy, A., & Dubath, P. 1995, A&A, 303, 761
- Meylan et al. (2001) Meylan, G., Sarajedini, A., Jablonka, P., Djorgovski, S.G., Bridges, T., & Rich, R.M. 2001, AJ, 122, 830
- Mihos & Hernquist (1996) Mihos, J.C., & Hernquist, L. 1996, ApJ, 464, 641
- Miller et al. (1997) Miller, B.W., Whitmore, B.C., Schweizer, F., & Fall, S.M. 1997, AJ. 114, 2381
- Norton et al. (2001) Norton, S.A., Gebhardt, K., Zabludoff, A.I., & Zaritsky, D. 2001, ApJ, 557, 150
- Nulsen (1989) Nulsen, P.E.J. 1989, ApJ, 346, 690
- Peng et al. (2004) Peng, E.W., Ford, H.C., & Freeman, K.C. 2004, ApJ, 602, 705
- Prieur (1990) Prieur, J.-L. 1990, In: Dynamics and Interactions of Galaxies, ed. R. Wielen, Springer-Verlag Berlin, p. 72
- Puzia et al. (2002) Puzia, T.H., Zepf, S.E., Kissler-Patig, M., Hilker, M., Minniti, D., & Goudfrooij, P. 2002, A&A, 391, 453
- Puzia et al. (2005) Puzia, T.H., Kissler-Patig, M., Thomas, D., Maraston, C., Saglia, R.P., Bender, R., Goudfrooij, P., & Hempel, M. 2005, A&A, 439, 997
- Quinn (1984) Quinn, P. 1984, ApJ, 279, 596
- Salpeter (1955) Salpeter, E.E. 1955, ApJ, 121, 161
- Schiminovich et al. (1994) Schiminovich, D., van Gorkom, J.H., van der Hulst, J.M., & Kasow, S. 1994, ApJ, 423, 101
- Schweizer (1980) Schweizer, F. 1980, ApJ, 237, 303
- Schweizer & Ford (1985) Schweizer, F., & Ford, W.K. 1985, in New Aspects of Galaxy Photometry, ed. J.-L. Nieto, New York:Springer-Verlag, p. 145
- Schweizer (1987) Schweizer, F. 1987, In: Nearly Normal Galaxies ed. by S.M. Faber (Springer, New York) p.18
- Schweizer et al. (1996) Schweizer, F., Miller, B.W., Whitmore, B.C., & Fall, S.M. 1996, AJ, 112, 1839
- Schweizer & Seitzer (1998) Schweizer, F., & Seitzer, P. 1998, AJ, 116, 2206
- Schweizer et al. (2004) Schweizer, F., Seitzer, P., & Brodie, J.P. 2004, AJ, 128, 202
- Sikkema et al. (2006) Sikkema, G., Peletier, R.F., Carter, D., Valentijn, E.A., & Balcells, M. 2006, A&A, 458, 53
- Silverman (1986) Silverman, B.W. 1986, In: Density Estimation for Statistics and Data Analysis, Chap and Hall/CRC Press, Inc.
- Sirianni et al. (2005) Sirianni, M., et al. 2005, PASP, 117,1409
- Stetson (1987) Stetson, P.B. 1987, PASP, 113, 1420
- e.g. Terlevich et al. (1999) Terlevich, A.I., Kuntschner, H., Bower, R.G., Caldwell, N., & Sharples, R.M. 1999, MNRAS, 310, 445
- van den Bergh & Mackey (2004) van den Bergh, S., & Mackey, A. D. 2004, MNRAS, 354, 713
- Whitmore & Schweizer (1995) Whitmore, B.C., & Schweizer, F. 1995, AJ, 109, 960
- Whitmore et al. (1997) Whitmore, B.C., Miller, B.W., Schweizer, F., & Fall, S.M. 1997, AJ, 114, 1797
- Whitmore et al. (1999) Whitmore, B.C., Zhang, Q., Leitherer, C., Fall, S.M., Schweizer, F., & Miller, B.W. 1999, AJ, 118, 1551
- Whitmore (2003) Whitmore, B.C. : The Formation of Star Clusters, In: A Decade of HST Science ed. by M.Livio et al. (Cambridge Univ. Press, Cambridge 2003) p.153
- Williams & Christiansen (1985) Williams, R.E., & Christiansen, W.A. 1985, ApJ, 291, 80
- Zabludoff et al. (1996) Zabludoff, A.I., Zaritsky, D., Lin, H., Tucker, D., Hashimoto, Y., Shectman, S.A., Oemler, A., & Kirshner, R.P. 1996, ApJ, 466, 104
| Parameter | Value |
|---|---|
| RA∗(J2000) | 1h 41m 30.98s |
| Dec∗(J2000) | 65 36 55.44 |
| Hubble Type | S0 |
| 8216 15 km s-1 | |
| (corr) | 7936 km s-1 |
| velocity dispersion | 249 46 km s-1 |
| Distance∗∗ | 105.8 Mpc |
| m-M | 35.3 |
| scale | 1 = 512 pc |
| 1 ACS pixel = 25pc | |
| 20.57 | |
| galactic latitude (b) | 50.7 |
| 0.00 |
Note. — All other parameters are taken from LEDA (http://leda.univ-lyon1.fr/)
| RA (2000) | Dec (2000) | (mag) | (mag) | (kpc) | |
|---|---|---|---|---|---|
| 1 41 30.55 | -65 36 45.99 | 20.87 0.01 | 1.17 0.02 | 9.82 | 5.0 |
| 1 41 30.03 | -65 35 54.43 | 20.94 0.01 | 1.11 0.02 | 61.29 | 31.4 |
| 1 41 31.13 | -65 36 51.80 | 21.12 0.01 | 0.97 0.02 | 3.77 | 1.9 |
| 1 41 27.32 | -65 37 41.27 | 21.18 0.01 | 1.34 0.02 | 51.10 | 26.1 |
| 1 41 31.79 | -65 36 51.03 | 21.61 0.01 | 0.86 0.02 | 6.68 | 3.4 |
| 1 41 33.59 | -65 36 20.00 | 21.68 0.01 | 1.20 0.02 | 38.96 | 19.9 |
| 1 41 31.42 | -65 36 55.59 | 21.75 0.03 | 1.62 0.07 | 2.72 | 1.4 |
| 1 41 41.69 | -65 37 15.45 | 21.95 0.01 | 0.69 0.02 | 69.30 | 35.5 |
| 1 41 28.43 | -65 36 46.53 | 22.30 0.01 | 1.83 0.02 | 18.14 | 9.3 |
| 1 41 30.32 | -65 36 53.15 | 22.31 0.02 | 0.82 0.02 | 4.69 | 2.4 |
| 1 41 24.96 | -65 36 20.35 | 22.46 0.01 | 0.80 0.02 | 51.20 | 26.2 |
| 1 41 24.19 | -65 37 29.70 | 22.67 0.01 | 1.29 0.02 | 54.23 | 27.7 |
| 1 41 21.20 | -65 37 32.10 | 22.68 0.01 | 1.85 0.02 | 70.79 | 36.2 |
| 1 41 30.46 | -65 36 57.50 | 22.93 0.02 | 0.44 0.03 | 3.82 | 1.9 |
| 1 41 29.46 | -65 36 40.09 | 23.00 0.02 | 0.80 0.02 | 18.01 | 9.2 |
| 1 41 31.12 | -65 36 52.59 | 23.24 0.03 | 0.98 0.04 | 2.98 | 1.5 |
| 1 41 31.78 | -65 36 58.93 | 23.25 0.02 | 0.81 0.03 | 6.05 | 3.1 |
| 1 41 29.62 | -65 37 3.23 | 23.33 0.02 | 0.88 0.02 | 11.44 | 5.8 |
| 1 41 31.33 | -65 37 24.40 | 23.42 0.02 | 1.60 0.03 | 29.03 | 14.8 |
| 1 41 26.70 | -65 36 25.75 | 23.48 0.02 | 0.95 0.03 | 39.80 | 20.4 |
| 1 41 24.35 | -65 36 23.94 | 23.55 0.02 | 0.97 0.03 | 51.72 | 26.5 |
| 1 41 21.14 | -65 37 18.86 | 23.57 0.02 | 1.37 0.03 | 65.24 | 33.4 |
| 1 41 26.62 | -65 36 5.87 | 23.66 0.02 | 1.07 0.03 | 56.46 | 28.9 |
| 1 41 27.33 | -65 36 38.57 | 23.67 0.02 | 1.15 0.03 | 28.21 | 14.4 |
| 1 41 35.83 | -65 36 49.06 | 23.67 0.02 | 0.77 0.03 | 30.74 | 15.7 |
| 1 41 30.67 | -65 36 58.31 | 23.68 0.04 | 0.31 0.05 | 3.45 | 1.7 |
| 1 41 30.16 | -65 36 54.38 | 23.72 0.03 | 0.96 0.04 | 5.20 | 2.6 |
| 1 41 29.12 | -65 37 30.60 | 23.81 0.02 | 1.30 0.03 | 36.99 | 18.9 |
| 1 41 30.15 | -65 36 59.70 | 23.85 0.02 | 1.40 0.04 | 6.68 | 3.4 |
| 1 41 36.63 | -65 36 58.83 | 23.95 0.02 | 1.30 0.03 | 35.15 | 18.0 |
| 1 41 36.02 | -65 36 46.84 | 23.97 0.02 | 0.83 0.03 | 32.40 | 16.6 |
| 1 41 35.53 | -65 36 49.60 | 24.02 0.02 | 0.82 0.03 | 28.78 | 14.7 |
| 1 41 26.32 | -65 36 59.17 | 24.06 0.02 | 1.37 0.03 | 29.06 | 14.9 |
| 1 41 35.04 | -65 36 47.56 | 24.10 0.02 | 1.35 0.03 | 26.35 | 13.5 |
| 1 41 21.85 | -65 36 2.19 | 24.10 0.02 | 1.23 0.03 | 77.69 | 39.8 |
| 1 41 29.50 | -65 36 52.78 | 24.12 0.03 | 0.85 0.03 | 9.51 | 4.8 |
| 1 41 22.49 | -65 37 31.88 | 24.15 0.02 | 1.97 0.04 | 63.96 | 32.7 |
| 1 41 32.33 | -65 36 49.64 | 24.16 0.02 | 0.94 0.03 | 10.18 | 5.2 |
| 1 41 29.73 | -65 36 48.36 | 24.17 0.03 | 1.39 0.04 | 10.49 | 5.4 |
| 1 41 42.40 | -65 37 29.54 | 24.26 0.02 | 1.74 0.04 | 78.53 | 40.2 |
| 1 41 31.52 | -65 37 0.55 | 24.26 0.03 | 0.93 0.04 | 6.11 | 3.1 |
| 1 41 33.11 | -65 37 37.96 | 24.35 0.03 | 1.36 0.04 | 44.52 | 22.8 |
| 1 41 24.02 | -65 36 42.34 | 24.40 0.03 | 1.35 0.04 | 45.02 | 23.0 |
| 1 41 29.77 | -65 37 9.49 | 24.42 0.03 | 1.38 0.04 | 15.90 | 8.1 |
| 1 41 29.56 | -65 37 1.17 | 24.47 0.03 | 0.85 0.04 | 10.45 | 5.3 |
| 1 41 20.68 | -65 36 45.31 | 24.50 0.03 | 1.64 0.04 | 64.55 | 33.0 |
| 1 41 28.81 | -65 37 3.23 | 24.51 0.03 | 0.73 0.04 | 15.49 | 7.9 |
| 1 41 38.81 | -65 37 12.53 | 24.56 0.03 | 1.54 0.04 | 51.41 | 26.3 |
| 1 41 34.14 | -65 35 44.84 | 24.57 0.03 | 1.20 0.04 | 73.27 | 37.5 |
| 1 41 24.77 | -65 36 31.55 | 24.57 0.03 | 1.72 0.05 | 45.29 | 23.2 |
| Age (Gyr) | Z | N | |
|---|---|---|---|
| Old | 14 | 0.0004 | 25 (for ) |
| 12 (for ) | |||
| 6 (for ) | |||
| Intermediate | 11.5 | 0.02 | 81 (for ) |
| 93 (for ) | |||
| 99 (for ) | |||
| Young | 0.4 | 0.02 | 50 |
.