The Dark Side of ROTSE-III Prompt GRB Observations
Abstract
We present several cases of optical observations during -ray bursts (GRBs) which resulted in prompt limits but no detection of optical emission. These limits constrain the prompt optical flux densities and the optical brightness relative to the -ray emission. The derived constraints fall within the range of properties observed in GRBs with prompt optical detections, though at the faint end of optical/ flux ratios. The presently accessible prompt optical limits do not require a different set of intrinsic or environmental GRB properties, relative to the events with prompt optical detections.
1 Introduction
Since the launch of the Swift satellite (Gehrels et al., 2004), early long-wavelength observations of -ray bursts (GRBs) have become routine. Swift has provided prompt triggers to events since early 2005, for which “prompt” signifies “during -ray emission”. There is a growing number of optical lightcurves that begin during, or within seconds after, the -ray emission. There are also several cases with prompt optical non-detections which constrain the optical brightness during the GRB.
Prompt and very early broadband emission has been the major advance in Swift-era GRB studies, opening serious investigations of important physical questions. One example is the nature of the relativistic outflow, generally thought of as baryonic with energy released by internal shocks. The proposed alternatives include magnetized flows which release energy via magnetic reconnection (Meszaros et al., 1994; Thompson, 1994; Usov, 1994). The early broadband detections at X-ray and optical wavelengths are now being used to test these models (e.g., Kumar et al., 2007).
From the beginning of the afterglow discovery era, optical counterparts have been found to have a large range in brightness. Despite good observations, a significant fraction ( 50%) of events do not have detected optical afterglows. These “optically dark” GRBs have produced questions regarding GRB physics and environment (see pre- and post-Swift reviews, such as Piran, 2005; Zhang, 2007, respectively).
Nondetections during prompt optical observations are not precisely the same as these optically dark GRBs. In a few events deeper post-GRB observations detect the optical transient. This raises the question as to whether prompt limits are “promptly dark”; are the limiting fluxes consistent with the brightness range observed in prompt optical detections, or do prompt nondetections require a separate population of optical properties? Such properties could be due to either intrinsic (faint events, or faint optical–to–-ray flux ratios) or extrinsic (local dust absorption, or the Lyman- forest absorption from high ) causes.
“Excessively” faint prompt optical emission would therefore have interesting implications for the GRB spectral shape or environment. While the peak frequency of the GRB has often been constrained ( peaking near a few 100 keV, see the review by Piran, 2005), the shape of the prompt emission’s low-energy tail is not well known, with self-absorption frequency estimates from the optical to X-ray (e.g., Pe’er & Waxman, 2004; Wei, 2007). As well, indications of high redshift would be important. While there are suggested redshift indicators from GRB -ray properties alone, these are not proven, as discussed critically by Butler et al. (2007).
The ROTSE-III project has provided some of the earliest optical observations of GRB triggers, with a number of detections. To date, there has been no consistent correlation between prompt optical fluxes and the contemporaneous -rays (e.g., see the discussions in Rykoff et al., 2005; Yost et al., 2007). This paper discusses prompt ROTSE-III observations under good sky conditions which did not yield detections. The limits placed upon the ratio of optical emission to the higher energy emission are discussed in comparison with the behavior associated with prompt detections.
In the following discussion, the spectral flux density is characterized by the spectral index , with . This convention relates to the -ray photon index by . To designate a spectral region, subscripts “OPT”, “X”, and “” for indicate an index for the optical, X-ray, and -ray bands respectively. A spectral index spanning two regions is designated with both, e.g., for the spectral index interpolating between the optical and -ray frequencies.
We note briefly that the overall spectral and temporal shape of afterglows typically suggests synchrotron emission from a fireball whose accelerated electrons have a Lorentz factor distribution (this is reviewed, e.g., by Meszaros, 2006). The afterglow spectrum has spectral breaks: principally , due to the minimum Lorentz factor , and , the cooling frequency. These provide predictions for the spectral shape of a single synchrotron component. The index at frequencies below the peak in (), for , and for the case when and . (When , the spectral shape is for frequencies between them.) These predictions, with from to for – , can be compared to the constraints upon .
Figure 1 shows some possible combinations of and . The -ray spectrum may predict the optical flux (), indicating that a single power-law (synchrotron-like) component could account for the broadband spectrum. When , the -ray spectrum underpredicts the optical flux, implying a separate low-energy emission component. When , the -ray spectrum overpredicts the optical flux, indicating a spectral rollover between the optical and high frequencies. When there are only prompt optical upper limits in flux density, one can nevertheless discriminate between cases where either predicts or overpredicts the optical flux limit from those where could underpredict the optical flux.
2 Optical Observations
The ROTSE-III array is a worldwide network of 0.45 m robotic, automated telescopes, built for fast ( s) responses to GRB triggers from satellites such as Swift. They have a wide () field of view imaged onto a Marconi back-illuminated thinned CCD, and operate without filters. The ROTSE-III systems are described in detail in Akerlof et al. (2003).
ROTSE-III images were reduced and processed using the RPHOT pipeline, with routines based upon DAOPHOT (Stetson, 1987). Objects were identified via SExtractor (Bertin & Arnouts, 1996) and calibrated astrometrically and photometrically with the USNOB1.0 catalog. They are tied to the band, and these unfiltered “-equivalent” magnitudes are designated as “”. The method is fully described in Quimby et al. (2006a). The final result yields limiting magnitudes in the GRB error box from the PSF-fit photometric data. These are presented in Table 1.
2.1 Sources of Prompt Detection Data
Table 2 presents spectral index information for several GRBs with prompt optical detections. These are used to provide a comparison for prompt limit results. The table is similar to Table 5 of Yost et al. (2007), which is also used for comparison.
Most of the prompt optical detections used for this table are from ROTSE-III observations. These include GRB 060111B (Yost et al., 2006), GRB 060729 (Quimby et al., 2006b), GRB 060904B (Rykoff et al., 2006) and GRB 061007 (Rykoff & Rujopakarn, 2006) which are discussed in a comprehensive analysis paper (Rykoff et al., in prep.). GRB 061121 was promptly detected by ROTSE; these data are presented in Page et al. (2007). GRB 060927 was a high-redshift event (Fynbo et al., 2006). The prompt ROTSE detection is converted to a flux density at a wavelength near -band, as described in Ruiz-Velasco et al., in prep. GRB 060218 was detected by ROTSE (Table 2: line with a observation of GRB 060218) (Quimby et al., 2006c) and by the Swift UVOT (Table 2: line with a observation of GRB 060218) (Campana et al., 2006). Finally, GRB 050820A and GRB 061126 were promptly detected by RAPTOR. For the former, we determine optical and -ray flux densities from Vestrand et al. (2006). For the latter, we take the optical flux densities of Perley et al. (2007), correcting for Galactic extinction.
2.2 Prompt Nondetections with Later Detections
One case of a prompt limit with a later detection is the first ROTSE observation of GRB 060729. The OT flux was rising, and the second 5-second image was the first to yield a detection (Tables 2 and 3 show that the flux rises from 1/2 to 2 mJy over the first few images).
In GRB 060614, the ROTSE limits at 29 seconds post-trigger were obtained before the subsequent UVOT afterglow detection at 100 seconds post-trigger. This initial UVOT V-band detection (Parsons et al., 2006) had notable flux uncertainty (18.40.5 mag) but is significantly (nearly 3 mag) fainter than the ROTSE limits. The ROTSE limit values are fully consistent with the later detection, and constrain the flux decay to have been no more rapid than from a half minute to two minutes post-trigger.
Optical detections indicate that the GRB cannot be at high , as the Lyman- forest would absorb the optical flux. Indeed, GRB 060729 has (Thoene et al., 2006), and the host of GRB 060614 is at (Price et al., 2006), (although there is some controversy, with an estimate of , Schaefer & Xiao, 2006). There are further GRBs with prompt limits followed by optical detections at 1 hr: GRB 050306 (D’Avanzo et al., 2005), GRB 050713A (Malesani et al., 2005), and GRB 061110 (Chen et al., 2006). The prompt nondetections of these three events cannot be attributed to high .
3 High Energy Data
BAT data were used for -ray comparisons in these Swift bursts. For the -ray data, the event files from the public archives were analyzed with the BATTOOLS and XSPEC11 software packages111http://swift.gsfc.nasa.gov/docs/swift/analysis/ . The result is unabsorbed flux values in the 15–150 keV range. When there is sufficient signal (for 30% of the data points), these are determined directly along with during the precise time interval of each optical observation. For the remainder of the data where the signal is insufficient, the count rate during the interval is converted to fluxes using the BAT spectrum during a longer, overlapping interval. The analyses are the same as described for the GRB 051109A and GRB 051111 events, in Yost et al. (2007).
In addition, a few events have prompt X-ray data (in the keV band, with an effective frequency Hz) as well. Table 2 lists results with simultaneous optical, X-ray, and -ray detections for GRB 060729, GRB 060904B, and GRB 061007. The XRT analyses are fully discussed in an upcoming ROTSE paper treating multiband lightcurves (Rykoff et al., in prep.). In brief, the xrtpipeline tool calibrates and performs standard filtering and screening. This is followed by count extractions from appropriate regions for the source and background, the generation of response files with the FTOOLS task xrtmkarf, and spectral fits to yield fluxes. For GRB 061121, the XRT data is taken directly from the flux densities in Page et al. (2007); the reductions were similar and compensate for the significant pileup effects, as discussed there in detail.
There are two cases with optical nondetections and X-ray prompt detections within the sample presented, GRB 050713A and GRB 060614. A limit upon adds little to the information from the limit; the events are compatible with an interpretation of the prompt sec X-ray flux as an extension of the contemporaneous -rays. This was seen in a quick analysis of the GRB 060614 archive data (as well as the spectral information given in Mangano et al., 2006; Barthelmy et al., 2006), and by the O’Brien et al. (2006) analysis of GRB 050713A XRT and BAT data. Further detailed comparisons are beyond the scope of this paper.
4 Determining and
The spectral index (or its limit) was determined between the optical and higher-energy bands in the same manner as those presented in Yost et al. (2007). In brief, the optical data was corrected for Galactic extinction and converted to flux densities as if the magnitudes were , using the zeropoints of Bessell (1979). These data are in Tables 2, 3, along with the flux densities of the -ray detections (and X-ray, where applicable). The flux densities and effective frequencies of the bands are then used to calculate . When the optical is not detected, the optical limit is used with the lower (1 ) estimate of the high-energy emission to estimate the softest spectral index (or ) possible.
The Galactic extinction corrections are taken from Schlegel et al. (1998). limits are treated as -equivalent and adjusted for the band’s extinction. Table 2 gives the flux and results for cases with prompt optical detections, in the same manner as Yost et al. (2007). Table 3 gives flux and constraints for events with prompt optical limits.
5 Discussion
We consider 27 GRBs with prompt optical observations, the data presented in Tables 2 and 3, as well as Table 5 in Yost et al. (2007). 11 of these GRBs only had prompt optical limits, while 14 were consistently promptly detected in the optical, and a further 2 events had both prompt limits and detections. The data includes a total of 43 distinct prompt optical detections, and 55 prompt optical limits.
5.1 Diverse Prompt Properties
GRBs show diversity in their prompt optical and -ray brightnesses. Optical flux densities span 100 Jy to 3 Jy while contemporaneous -ray flux densities take values from 6 Jy to 4 mJy. This results in a range of possible prompt spectral indices and , which are plotted as against in Figure 2.
In this dataset, all relations between and are observed (, , or ). The values of and vary widely, from to for and from to 0.4 for . These are within or quite close to the range of to for the synchrotron spectral shape (discussed in the Introduction) and electron energy distribution indices of – .
In addition, observations of some events show both and changing significantly during a burst. generally evolves from hard to soft. This is a previously known characteristic of many GRBs (e.g., as reviewed by Fishman & Meegan, 1995), now considered in models of prompt emission (such as “jitter” radiation; Medvedev, 2006). The changes in indicate that optical prompt fluxes are generally not correlated with the -ray emission.
There has been discussion in the literature concerning whether prompt optical emission is an extension of the -rays, or is a separate component. Vestrand et al. (2005) indicates an optical component correlated to the GRB in GRB 041219A, while Vestrand et al. (2006) and Yost et al. (2007) discuss the apparent blend of -ray–correlated and uncorrelated components in the prompt optical lightcurves of GRBs 050820A and 051111 respectively. The correlated component of GRB 051111 is one of the few cases where the indices allow . Several events had prompt optical behavior distinct from that of the GRB, and apparently connected to the afterglow; the prompt optical lightcurves of GRB 050401, GRB 051109A and GRB 061126 are decaying (Rykoff et al., 2005; Yost et al., 2007; Perley et al., 2007), and that of GRB 060729 is rising (Quimby & Rykoff, 2006). There are also events where the optical flux does not rise until after the GRB (e.g., GRB 030418, GRB 060605, GRB 060607A, Rykoff et al., 2004; Schaefer et al., 2006; Nysewander & Haislip, 2006, respectively).
As seen by the variety of , there is no universal ratio (OPT)/(). There is no common / connection in all events, but in most cases, is harder than . For these, overpredicts the optical, requiring a rollover in the spectrum between the -ray and optical frequencies, whether or not there are separate emission components at optical and -ray energies. Nearly all the limits give versus falling into this category.
In some prompt detections, and underpredicts the optical (e.g., see Yost et al., 2007; Perley et al., 2007, for GRB 051111 and GRB061126 respectively). This implies a separate low-energy emission component. All the prompt limits presented exclude this possibility, except for GRB 060515. Its constraints are insufficient and allow either or .
5.2 Properties of Limits vs Detections
The optical limits are not demonstrably the result of abnormally faint prompt optical flux. The prompt flux limits are typically 16th or 17th magnitude ( mJy). Prompt detections have been recorded from small fractions of a mJy to a few Jy. As well, the -ray flux densities of GRBs with prompt optical limits are similar to the lower values of () from GRBs with optical detections; both sets of events have () ranging from several Jy to over a mJy. The prompt limits require neither intrinsically fainter emission nor excess absorption from dust or (high-) Lyman-. High redshifts are not a general solution for the prompt optical limits, as some events are detected later (§2.2).
The values of GRB contemporaneous with prompt optical limits are similar to the when prompt observations gave optical detections. The of optical nondetections are on average softer than the of detections, ranging from to 0, as compared to to . However, the data are not consistently sampled, leading to no strong conclusions other than that prompt observations of the few GRBs with the hardest have yielded detections rather than limits.
Similarly, the limits on for nondetections () are in the range of most of the from the prompt detections (from to ). The prompt nondetections are consistent with coming from the harder end of the distribution, as all of the limits are harder than the softest value calculated from prompt detections. However, there is no evidence of bimodality of . It is only in one event (GRB 061007) that the of optical detections is softer than the softest allowed from a prompt limit. This was for epochs at the end of the event, which may be the beginning of the afterglow, as -ray, X-ray and optical frequencies lie on a single spectral powerlaw. There is not one set of for the optically detected and another for the nondetected cases. These overlaps in and are readily seen in Figure 2.
5.3 Cases with Prompt X-ray Data
For GRB 061121, the comparisons of and require a peak in the broadband spectrum. This is discussed in detail by Page et al. (2007), where it can be inferred to be near 1 keV initially and to subsequently drop in frequency. GRB 060729 also implies a peak between the optical and X-ray during the epoch with optical, X-ray and -ray data. In that case, appears to be harder than , but this may be due to the general softening trend of and the measurement of over the X-ray epoch using data beginning well before the X-ray observations. A “convex” overall X-ray–-ray spectral shape cannot be inferred from the weak -ray detection.
In contrast, the GRB 061007 prompt X-ray epochs do not demonstrate such a peak. From the first GRB 061007 epoch with X-ray data, the spectral indices show that the -ray and X-ray bands are in a single spectral segment. This is not unusual; §3 indicates that in the two prompt optical limit cases, the X-ray and -ray data could be from the same spectral segment. In GRB 061007, allowing for local extinction corrections, the entire broadband spectrum (optical, X-ray, -ray) forms a single spectral segment (see Mundell et al., 2007, Figure 2, which fits an absorbed spectrum). This would be expected for an early afterglow where the high-energy emission from the forward shock extends above the X-rays.
6 Conclusion
Prompt optical limits fall within the range of optical fluxes and optical–to–-ray flux ratios observed from prompt optical detections. The prompt limits yield constraints upon optical–to–-ray flux ratios at the faint end of the ratios measured from prompt detections. This does not imply a different set of intrinsic or environmental properties for events with detections and nondetections; there is wide overlap in fluxes and flux ratios between the limits and detections. Moreover, prompt detections show great variety, and demonstrate diverse connections (or lack thereof) with the contemporaneous -rays.
The most economical explanation for prompt optical nondetections is that they are events drawn from the faint end of the range of prompt optical emission. These faint counterparts are not always accessible with the sensitivities of the small telescopes providing the bulk of prompt responses.
References
- Akerlof et al. (2003) Akerlof, C. W., et al. Jan. 2003, PASP, 115, 132
- Barthelmy et al. (2006) Barthelmy, S., et al. 2006, GCN Circ. No. 5256
- Bertin & Arnouts (1996) Bertin, E. & Arnouts, S. June 1996, A&AS, 117, 393
- Bessell (1979) Bessell, M. S. Oct. 1979, PASP, 91, 589
- Butler et al. (2007) Butler, N. R., Kocevski, D., Bloom, J. S., & Curtis, J. L. June 2007, astro-ph/0706.1275
- Campana et al. (2006) Campana, S., et al. Aug. 2006, Nature, 442, 1008
- Chen et al. (2006) Chen, Y. C., Lee, Y. H., Huang, K. Y., Ip, W. H., & Urata, Y. 2006, GCN Circ. No. 5797
- D’Avanzo et al. (2005) D’Avanzo, P., Fugazza, D., Covino, S., Malesani, D., Masetti, N., Palazzi, E., Antonelli, L. A., Israel, G. L., & Andreuzzi, G. 2005, GCN Circ. No. 3089
- Fishman & Meegan (1995) Fishman, G. J. & Meegan, C. A. 1995, ARA&A, 33, 415
- Fynbo et al. (2006) Fynbo, J. P. U., Jakobsson, P., Jensen, B. L., Hjorth, J., Sollerman, J., Watson, D., Cerón, J. M. C., Vreeswijk, P., & Andersen, M. I. 2006, GCN Circ. No. 5651
- Gehrels et al. (2004) Gehrels, N., et al. Aug. 2004, ApJ, 611, 1005
- Kumar et al. (2007) Kumar, P., et al. Mar. 2007, MNRAS, 376, L57
- Malesani et al. (2005) Malesani, D., D’Avanzo, P., Palazzi, E., Israel, G. L., Chincarini, G., Stella, L., & Pedani, M. 2005, GCN Circ. No. 3582
- Mangano et al. (2006) Mangano, V., Parola, V. L., Troja, E., Cusumano, G., Mineo, T., Parsons, A., & Kennea, J. 2006, GCN Circ. No. 5254
- Medvedev (2006) Medvedev, M. V. Feb. 2006, ApJ, 637, 869
- Meszaros (2006) Meszaros, P. 2006, Reports of Progress in Physics, 69, 2259
- Meszaros et al. (1994) Meszaros, P., Rees, M. J., & Papathanassiou, H. Sept. 1994, ApJ, 432, 181
- Mundell et al. (2007) Mundell, C. G., et al. May 2007, ApJ, 660, 489
- Nousek et al. (2006) Nousek, J. A., et al. May 2006, ApJ, 642, 389
- Nysewander & Haislip (2006) Nysewander, M. & Haislip, J. 2006, GCN Circ. No. 5236
- O’Brien et al. (2006) O’Brien, P. T., et al. Aug. 2006, ApJ, 647, 1213
- Page et al. (2007) Page, K. L., et al. 2007, submitted to ApJ
- Parsons et al. (2006) Parsons, A. M., et al. 2006, GCN Circ. No. 5252
- Pe’er & Waxman (2004) Pe’er, A. & Waxman, E. Sept. 2004, ApJ, 613, 448
- Perley et al. (2007) Perley, D. A., et al. Mar. 2007, ApJ submitted, astro-ph/0703538
- Piran (2005) Piran, T. 2005, Reviews of Modern Physics, 76, 1143
- Price et al. (2006) Price, P. A., Berger, E., & Fox, D. B. 2006, GCN Circ. No. 5275
- Quimby & Rykoff (2006) Quimby, R. & Rykoff, E. S. 2006, GCN Circ. No. 5377
- Quimby et al. (2006a) Quimby, R. M., et al. 2006a, ApJ, 640, 402
- Quimby et al. (2006b) Quimby, R., Swan, H., Rujopakarn, W., & Smith, D. A. 2006b, GCN Circ. No. 5366
- Quimby et al. (2006c) Quimby, R., Schaefer, B. E., & Swan, H. 2006c, GCN Circ. No. 4782
- Rykoff & Rujopakarn (2006) Rykoff, E. S. & Rujopakarn, W. 2006, GCN Circ. No. 5706
- Rykoff et al. (2006) Rykoff, E. S., Rujopakarn, W., & Yuan, F. 2006, GCN Circ. No. 5504
- Rykoff et al. (2004) Rykoff, E. S., et al. Feb. 2004, ApJ, 601, 1013
- Rykoff et al. (2005) Rykoff, E. S., et al. Oct. 2005, ApJ, 631, L121
- Schaefer et al. (2006) Schaefer, B. E., Rykoff, E. S., Smith, D. A., & Quimby, R. 2006, GCN Circ. No. 5222
- Schaefer & Xiao (2006) Schaefer, B. E. & Xiao, L. Aug. 2006, ApJL submitted, astro-ph/0608441
- Schlegel et al. (1998) Schlegel, D. J., Finkbeiner, D. P., & Davis, M. June 1998, ApJ, 500, 525
- Stetson (1987) Stetson, P. B. Mar. 1987, PASP, 99, 191
- Thoene et al. (2006) Thoene, C. C., Levan, A., Jakobsson, P., Rol, E., Gorosabel, J., Jensen, B. L., Hjorth, J., & Vreeswijk, P. 2006, GCN Circ. No. 5373
- Thompson (1994) Thompson, C. Oct. 1994, MNRAS, 270, 480
- Usov (1994) Usov, V. V. Apr, 1994, MNRAS, 267, 1035
- Vestrand et al. (2005) Vestrand, W. T., et al. May 2005, Nature, 435, 178
- Vestrand et al. (2006) Vestrand, W. T., et al. July 2006, Nature, 442, 172
- Wei (2007) Wei, D. M. Jan. 2007, MNRAS, 374, 525
- Yost et al. (2007) Yost, S. A., et al. 2007, ApJ, 657, 925
- Yost et al. (2006) Yost, S. A., Yuan, F., Swan, H., & Akerlof, C. 2006, GCN Circ. No. 4488
- Zhang (2007) Zhang, B. Feb. 2007, ChJAA, 7, 1
| GRB | (s) | (s) | Magnitude |
|---|---|---|---|
| 050306 | 64.8 | 69.8 | 15.5 |
| 050306 | 78.9 | 83.9 | 15.8 |
| 050306 | 93.5 | 98.5 | 15.8 |
| 050306 | 108.3 | 113.3 | 15.7 |
| 050306 | 122.7 | 127.7 | 15.7 |
| 050306 | 137.2 | 142.2 | 15.8 |
| 050306 | 151.8 | 156.8 | 15.8 |
| 050306 | 166.1 | 171.1 | 15.7 |
| 050306 | 180.4 | 185.4 | 15.8 |
| 050713A | 72.1 | 77.1 | |
| 050713A | 104.7 | 124.7 | |
| 050822 | 31.8 | 36.8 | 15.6 |
| 050822 | 39.8 | 44.8 | 15.5 |
| 050822 | 47.8 | 52.8 | 15.5 |
| 050822 | 55.9 | 60.9 | 15.5 |
| 050822 | 63.9 | 68.9 | 15.5 |
| 050822 | 95.9 | 100.9 | 15.6 |
| 050915A | 42.9 | 47.9 | |
| 050922B | 258.6 | 263.6 | |
| 050922B | 273.3 | 278.3 | |
| 051001 | 85.7 | 90.7 | |
| 051001 | 100.1 | 105.1 | |
| 051001 | 114.3 | 119.3 | |
| 051001 | 128.6 | 133.6 | |
| 051001 | 143.1 | 148.1 | |
| 051001 | 157.6 | 162.6 | |
| 051001 | 172.3 | 177.3 | |
| 051001 | 186.9 | 191.9 | |
| 060312 | 20.3 | 25.3 | |
| 060312 | 27.4 | 32.4 | |
| 060312 | 34.4 | 39.4 | |
| 060312 | 41.5 | 46.5 | |
| 060312 | 48.7 | 53.7 | |
| 060515 | 58.5 | 63.8 | |
| 060614 | 26.8 | 31.8 | |
| 060614 | 40.6 | 45.6 | |
| 060614 | 55.2 | 60.2 | |
| 060614 | 69.6 | 74.6 | |
| 060614 | 83.9 | 88.9 | |
| 060614 | 98.3 | 103.3 | |
| 060614aaThe Swift UVOT detected the OT in this event during an exposure from 102–202 sec post-trigger (Parsons et al., 2006). The ROTSE limits are consistent with the more sensitive UVOT detection. | 112.6 | 117.6 | |
| 060614aaThe Swift UVOT detected the OT in this event during an exposure from 102–202 sec post-trigger (Parsons et al., 2006). The ROTSE limits are consistent with the more sensitive UVOT detection. | 126.8 | 131.8 | |
| 060614aaThe Swift UVOT detected the OT in this event during an exposure from 102–202 sec post-trigger (Parsons et al., 2006). The ROTSE limits are consistent with the more sensitive UVOT detection. | 140.7 | 145.7 | |
| 060614aaThe Swift UVOT detected the OT in this event during an exposure from 102–202 sec post-trigger (Parsons et al., 2006). The ROTSE limits are consistent with the more sensitive UVOT detection. | 155.2 | 160.2 | |
| 060614aaThe Swift UVOT detected the OT in this event during an exposure from 102–202 sec post-trigger (Parsons et al., 2006). The ROTSE limits are consistent with the more sensitive UVOT detection. | 169.2 | 189.2 | |
| 060729bbGRB 060729 was promptly detected, however, the first 5 sec observation only yielded a limit for the OT. | 64.3 | 69.3 | |
| 061110 | 43.5 | 48.5 | |
| 061222 | 47.2 | 52.2 | |
| 061222 | 54.2 | 59.2 | |
| 061222 | 61.2 | 66.2 | |
| 061222 | 68.2 | 73.2 | |
| 061222 | 75.2 | 80.2 | |
| 061222 | 82.2 | 87.2 | |
| 061222 | 89.2 | 94.2 | |
| 061222 | 96.2 | 101.2 | |
| 061222 | 103.2 | 108.2 | |
| 061222 | 110.1 | 115.1 |
Note. — All times are in seconds since the burst onset, which are (UT): 03:33:12 UT (GRB 050306), 04:29:02.4 (GRB 050713A), 03:49:29 (GRB 050822), 11:22:42 (GRB 050915A), 15:02:00 (GRB 050922B), 11:11:36.2 (GRB 051001), 01:36:12.8 (GRB 060312), 02:27:52 (GRB 060515), 12:43:48.5 (GRB 060614), 19:12:29.2 (GRB 060729), 11:47:21.3 (GRB 061110), 03:28:52.1 (GRB 061222). Magnitudes are quoted without correction for local or Galactic extinction, and are -equivalent unfiltered values. The extinction corrections are (in magnitudes): 1.817 (GRB 050306), 1.107 (GRB 050713A), 0.04 (GRB 050822), 0.07 (GRB 050915A), 0.098 (GRB 050922B), 0.04 (GRB 051001), 0.472 (GRB 060312), 0.073 (GRB 060515), 0.058 (GRB 060614), 0.145 (GRB 060729), 0.242 (GRB 061110) and 0.266 (GRB 061222).
| GRB | Band | [or ] | () [or ()] | [or ] | ||||
|---|---|---|---|---|---|---|---|---|
| (s) | (s) | (mJy) | (Hz) | (Jy) | [or ] | |||
| 050820A | 252 | 282 | 2.612 0.058 | 25 | 453 17 | -0.371 0.061 | -0.161 0.004 | |
| 050820A | 402 | 432 | 4.814 0.084 | 25 | 314 16 | -0.415 0.078 | -0.251 0.005 | |
| 050820A | 515 | 545 | 4.452 0.077 | 27 | 138 15 | -0.707 0.143 | -0.32 0.01 | |
| 060111B | 58.0 | 63.0 | 5.97 0.66 | 14 | 89 14 | -1.02 0.20 | -0.41 0.02 | |
| 060218 | 691 | 1027 | 0.254 0.026 | 11 | 91.3 7.4 | -1.5 0.1 | -0.10 0.01 | |
| 060218 | 700 | 1000 | 0.106 0.020 | 11 | 91.3 7.4 | -1.5 0.1 | -0.02 0.02 | |
| 060729 | 73.4 | 83.4 | 0.68 0.19 | 16 | 203 20 | -0.611 0.093 | -0.11 0.04 | |
| 060729 | 92.9 | 97.9 | 1.90 0.18 | 14 | 173 15 | -0.986 0.087 | -0.23 0.02 | |
| 060729 | 114.8 | 119.8 | 0.74 0.18 | 15 | 35.4 6.9 | -0.896 0.065 | -0.29 0.04 | |
| 060729 | 128.8 | 133.8 | 0.61 0.18 | 15 | 20.0 6.3 | -0.896 0.065 | -0.33 0.04 | |
| 060729 | .. | .. | .. | .. | 0.67 | 1527 34 | -2.004 0.029 | 0.13 0.04 |
| 060904B | 18.5 | 31.5 | 0.278 0.055 | 18 | 20.52 6.3 | -0.416 0.081 | -0.288 0.035 | |
| 060904B | 146.4 | 166.4 | 0.370 0.072 | 13 | 36.2 7.5 | -1.30 0.18 | -0.270 0.046 | |
| 060904B | .. | .. | .. | .. | 0.67 | 1011 29 | -1.26 0.03 | 0.080 0.027 |
| 060927 | 16.8 | 21.8 | aaFilterless observations of this high-z event were calibrated to the flux density at 819 nm, approximately i-band, see Ruiz-Velasco et al., in prep. | 6.1 1.1 | 16 | 125 16 | -0.77 0.13 | -0.365 0.030 |
| 061007 | 27.2 | 32.2. | 10.83 0.69 | 21 | 3198 54 | 0.163 0.028 | -0.114 0.008 | |
| 061007 | 41.0 | 46.0 | 286.9 4.9 | 20 | 1849 29 | 0.103 0.026 | -0.472 0.003 | |
| 061007 | 55.4 | 60.4 | 481.0 9.2 | 20 | 2776 31 | 0.054 0.020 | -0.483 0.003 | |
| 061007 | 77.8 | 82.8 | 407.4 5.7 | 16 | 215.9 12 | -0.673 0.072 | -0.72 0.01 | |
| 061007 | 92.0 | 97.0 | 500.5 7.8 | 0.67 | 1400.4 8.2 | -0.906 0.013 | -0.810 0.002 | |
| 061007 | .. | .. | .. | .. | 15 | 92 12 | -0.824 0.093 | -0.828 0.013 |
| 061007 | 106 | 111 | 449.0 6.4 | 0.67 | 1118.0 6.0 | -0.906 0.013 | -0.826 0.002 | |
| 061007 | .. | .. | .. | .. | 15 | 33.4 7.6 | -0.824 0.093 | -0.916 0.025 |
| 061007 | 120 | 125 | 376.6 9.5 | 0.67 | 909.9 4.5 | -0.906 0.013 | -0.830 0.004 | |
| 061007 | .. | .. | .. | .. | 15 | 39.6 7.8 | -0.824 0.093 | -0.882 0.023 |
| 061007 | 135 | 140 | 333.7 5.0 | 0.67 | 760.5 3.5 | -0.906 0.013 | -0.838 0.002 | |
| 061007 | .. | .. | .. | .. | 15 | 26.0 7.2 | -0.824 0.093 | -0.911 0.030 |
| 061007 | 149 | 154 | 280.9 4.9 | 0.67 | 644.8 2.8 | -0.906 0.013 | -0.837 0.002 | |
| 061007 | .. | .. | .. | .. | 15 | 24.9 7.1 | -0.824 0.093 | -0.899 0.031 |
| 061007 | 164 | 169 | 233.5 4.7 | 0.67 | 554.0 2.3 | -0.906 0.013 | -0.832 0.003 | |
| 061007 | .. | .. | .. | .. | 15 | 21.6 2.6 | -0.824 0.093 | -0.895 0.014 |
| 061007 | 178 | 198 | 183.4 3.6 | 0.67 | 452.6 1.8 | -0.906 0.013 | -0.827 0.003 | |
| 061007 | .. | .. | .. | .. | 15 | 13.6 3.6 | -0.824 0.093 | -0.916 0.029 |
| 061007 | 207 | 227 | 149.4 2.4 | 0.67 | 357.0 1.4 | -0.906 0.013 | -0.831 0.002 | |
| 061007 | .. | .. | .. | .. | 15 | 13.0 3.5 | -0.824 0.093 | -0.901 0.030 |
| 061007 | 237 | 257 | 127.7 1.6 | 0.67 | 289.9 1.1 | -0.906 0.013 | -0.839 0.002 | |
| 061007 | .. | .. | .. | .. | 15 | 10.4 1.8 | -0.824 0.093 | -0.906 0.019 |
| 061121 | 21.7 | 69.5 | 0.86 0.54 | 18 | 263.2 4.3 | -0.403 0.027 | -0.11 0.06 | |
| 061121 | 78.3 | 83.3 | 3.33 0.94 | 16 | 328 13 | -0.668 0.053 | -0.22 0.03 | |
| 061121 | .. | .. | .. | .. | 0.24 | 6930 320 | -0.07 0.08bbTaken from the spread in spectral indices with different extinction models, see Page et al. (2007), Table 4. | 0.118 0.046 |
| 061121 | 92.5 | 126 | 1.04 0.51 | 15 | 49.3 5.0 | -0.83 0.10 | -0.29 0.05 | |
| 061121 | .. | .. | .. | .. | 0.24 | 2024 74 | -ccThere is no value given by Page et al. (2007) for the spectral shape during the steep decline from the peak. For many cases, the steep X-ray phase has been reported as spectrally indistinguishable from the later shallow decay, but in some cases is softer during the initial rapid decay (Nousek et al., 2006). | 0.079 0.091 |
| 061126 | 20.9 | 25.9 | 60.65 0.55 | 19 | 473 16 | -0.262 0.059 | -0.459 0.007 | |
| 061126 | 29.8 | 34.8 | 41.96 0.77 | 19 | 65.9 9.2 | .. | -0.61 0.02 | |
| 061126 | 38.6 | 43.6 | 28.50 0.78 | 19 | 47 12 | .. | -0.60 0.03 |
Note. — Optical and -ray flux densities and spectral indices correspond to the time intervals – from the GRB trigger. The sources of the data are discussed in §2.1, and the optical data are corrected for Galactic extinction.
| GRB | Band | (OPT) | () | |||||
|---|---|---|---|---|---|---|---|---|
| (s) | (s) | (mJy, Limit) | 1018Hz | Jy | (Limit) | |||
| 050306 | 64.8 | 69.8 | 10.6 | 17 | 136 24 | -0.477 0.042 | -0.435 | |
| 050306 | 78.9 | 83.9 | 7.6 | 17 | 416 27 | -0.477 0.042 | -0.284 | |
| 050306 | 93.5 | 98.5 | 7.8 | 17 | 259 25 | -0.477 0.042 | -0.336 | |
| 050306 | 108.3 | 113.3 | 8.7 | 17 | 347 27 | -0.477 0.042 | -0.316 | |
| 050306 | 122.7 | 127.7 | 8.7 | 17 | 115 23 | -0.477 0.042 | -0.434 | |
| 050306 | 180.4 | 185.4 | 8.0 | 17 | 176 25 | -0.477 0.042 | -0.379 | |
| 050713A | 72.1 | 77.1 | 2.1 | 15 | 19.2 | -0.85 0.16 | -0.51 | |
| 050713A | 104.7 | 124.7 | 1.2 | 15 | 18.5 | -0.85 0.16 | -0.44 | |
| 050822 | 31.8 | 36.8 | 1.9 | 12 | 42 16 | -1.32 0.09 | -0.43 | |
| 050822 | 39.8 | 44.8 | 1.9 | 11 | 178 | -1.61 0.20 | -0.28 | |
| 050822 | 47.8 | 52.8 | 2.0 | 13 | 194 | -1.28 0.13 | -0.25 | |
| 050822 | 55.9 | 60.9 | 1.9 | 12 | 181 | -1.41 0.13 | -0.26 | |
| 050822 | 63.9 | 68.9 | 2.1 | 12 | 38.4 9.9 | -1.32 0.09 | -0.43 | |
| 050822 | 95.9 | 100.9 | 1.9 | 12 | 23.2 8.9 | -1.32 0.09 | -0.48 | |
| 050915A | 42.9 | 47.9 | 0.54 | 18 | 32.2 | -0.38 0.10 | -0.31 | |
| 050922B | 258.4 | 263.4 | 0.94 | 14 | 39.5 | -0.99 0.12 | -0.34 | |
| 050922B | 273.0 | 278.0 | 0.87 | 14 | 19.7 7.5 | -0.99 0.12 | -0.42 | |
| 051001 | 85.7 | 90.7 | 1.0 | 14 | 17.4 | -1.06 0.10 | -0.42 | |
| 051001 | 100.1 | 105.1 | 0.98 | 14 | 27.5 | -1.06 0.10 | -0.37 | |
| 051001 | 114.3 | 119.3 | 1.0 | 14 | 28.5 7.2 | -1.06 0.10 | -0.38 | |
| 051001 | 128.6 | 133.6 | 0.98 | 14 | 58.2 | -1.06 0.10 | -0.30 | |
| 051001 | 143.1 | 148.1 | 0.99 | 14 | 57.0 | -1.06 0.10 | -0.30 | |
| 051001 | 157.6 | 162.6 | 1.0 | 14 | 48.4 8.4 | -1.06 0.10 | -0.32 | |
| 051001 | 172.3 | 177.3 | 1.1 | 14 | 17.8 3.6 | -1.06 0.10 | -0.43 | |
| 051001 | 186.9 | 191.9 | 1.1 | 14 | 18.5 6.7 | -1.06 0.10 | -0.45 | |
| 060312 | 20.3 | 25.3 | 11.2 | 16 | 27.2 7.1 | -0.772 0.054 | -0.610 | |
| 060312 | 27.4 | 32.4 | 11.0 | 16 | 20.7 3.4 | -0.772 0.054 | -0.622 | |
| 060312 | 34.4 | 39.4 | 10.0 | 16 | 14.3 1.3 | -0.772 0.054 | -0.653 | |
| 060312 | 41.5 | 46.5 | 9.2 | 16 | 21.7 7.0 | -0.772 0.054 | -0.621 | |
| 060312 | 48.7 | 53.7 | 9.1 | 16 | 12.0 3.4 | -0.772 0.054 | -0.671 | |
| 060515 | 58.8 | 63.8 | 5.1 | 19 | 30.5 | -0.26 0.14 | -0.52 | |
| 060614 | 26.8 | 31.8 | 1.7 | 14 | 849 25 | -1.103 0.026 | -0.068 | |
| 060614 | 40.6 | 45.6 | 1.8 | 14 | 913 22 | -1.103 0.026 | -0.071 | |
| 060614 | 55.2 | 60.2 | 1.8 | 14 | 423 12 | -1.103 0.026 | -0.144 | |
| 060614 | 69.6 | 74.6 | 1.9 | 13 | 300 13 | -1.254 0.045 | -0.184 | |
| 060614 | 83.9 | 88.9 | 1.8 | 13 | 256 12 | -1.254 0.045 | -0.197 | |
| 060614 | 98.3 | 103.3 | 1.8 | 13 | 197 10 | -1.254 0.045 | -0.225 | |
| 060614 | 112.6 | 117.6 | 1.8 | 13 | 73.6 6.9 | -1.254 0.045 | -0.326 | |
| 060614 | 126.8 | 131.8 | 1.8 | 13 | 37.8 6.2 | -1.254 0.045 | -0.399 | |
| 060614 | 140.7 | 145.7 | 1.8 | 13 | 51.0 6.4 | -1.254 0.045 | -0.364 | |
| 060614 | 155.2 | 160.2 | 1.9 | 13 | 34.4 6.1 | -1.254 0.045 | -0.411 | |
| 060614 | 169.2 | 189.2 | 1.0 | 13 | 12.3 3.0 | -1.254 0.045 | -0.463 | |
| 060729 | 64.3 | 69.3 | 0.81 | 17 | 43 15 | -0.517 0.095 | -0.254 | |
| 061110 | 43.5 | 48.5 | 1.11 | 16 | 22.9 7.6 | -0.654 0.087 | -0.416 | |
| 061222 | 47.2 | 52.2 | 0.65 | 17 | 38.5 9.4 | -0.487 0.095 | -0.303 | |
| 061222 | 54.2 | 59.2 | 0.67 | 18 | 181.4 | -0.365 0.093 | -0.139 | |
| 061222 | 61.2 | 66.2 | 0.63 | 16 | 147.221 | -0.76 0.10 | -0.157 | |
| 061222 | 68.2 | 73.2 | 0.65 | 18 | 196.9 | -0.280 0.079 | -0.126 | |
| 061222 | 75.2 | 80.2 | 0.70 | 17 | 227.7 | -0.537 0.065 | -0.115 | |
| 061222 | 82.2 | 87.2 | 0.70 | 20 | 1309 25 | -0.002 0.025 | 0.058 | |
| 061222 | 89.2 | 94.2 | 0.63 | 17 | 580.8 | -0.446 0.035 | -0.011 | |
| 061222 | 96.2 | 101.2 | 0.66 | 15 | 91.1 | -0.84 0.11 | -0.212 | |
| 061222 | 103.2 | 108.2 | 0.68 | 15 | 47.8 | -0.84 0.11 | -0.284 | |
| 061222 | 110.1 | 115.1 | 0.65 | 15 | 25.1 7.1 | -0.84 0.11 | -0.354 |
Note. — Optical flux limits and -ray flux densities and their spectral indices, corresponding to the time intervals – from the GRB trigger. -ray count rates were all detected at the 3 level or better, although the spectral fits for some cases result in with signal-to-noise formally . The optical limits are from Table 1, corrected for Galactic extinction.

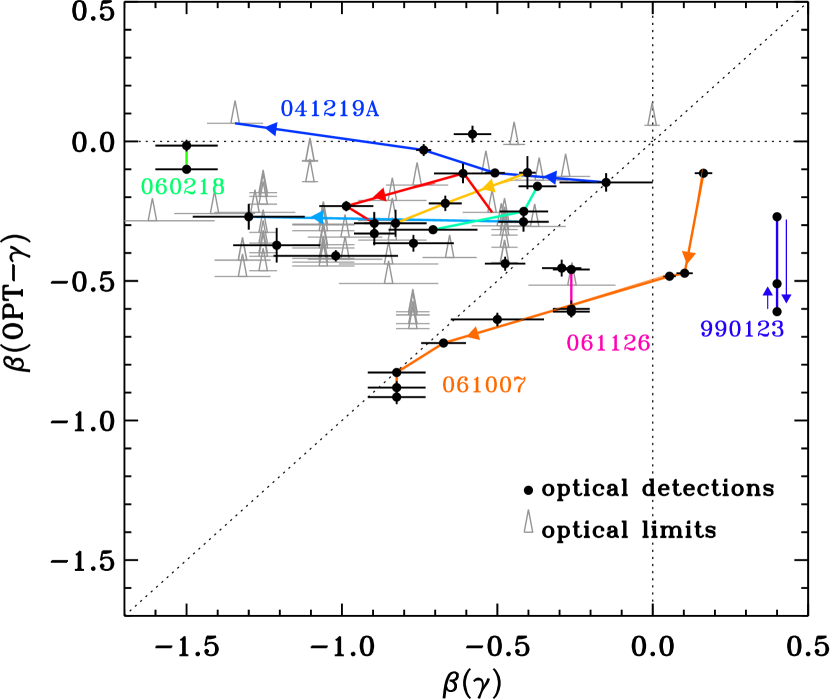
Most cases are above the line, with . The -ray spectrum overpredicts the optical flux; this indicates a spectral rollover between the optical and high frequencies, whether or not there are separate emission components at optical and -ray energies. Sometimes . The -ray spectrum underpredicts the optical flux, implying a separate low-energy emission component. A few cases have consistent indices, which, as discussed for GRB 051111 (Yost et al., 2007), could indicate a single spectral shape extending from -ray to optical energies. The optical limits are consistent with (OPT)/() ratios from optical detections and do not imply a separate population whose prompt optical emission is fainter relative to the -rays.