Wetting properties of grain boundaries in solid helium 4
Abstract
We have observed boundaries between hcp 4He crystal grains in equilibrium with liquid 4He. We have found that, when emerging at the liquid-solid interface, a grain boundary makes a groove whose dihedral angle is non-zero. This measurement shows that grain boundaries are not completely wet by the liquid phase, in agreement with recent Monte Carlo simulations. Depending on the value of , the contact line of a grain boundary with a solid wall may be wet by the liquid. In this case, the line is a thin channel with a curved triangular cross section, whose measured width agrees with predictions from a simple model. We discuss these measurements in the context of grain boundary premelting and for a future understanding of the possible supersolidity of solid 4He.
pacs:
67.80.-s, 61.72.Mm, 61.30.Hn, 68.35.-pKim and Chan Kim1 ; Kim2 have discovered anomalies in the behavior of a torsional oscillator (TO) containing solid 4He, and interpreted them as evidence for “supersolidity”, i.e. superfluidity in a solid state. Using the same method, Rittner and Reppy have observed similar anomalies but shown that they disappeared after annealing Rittner06 and could be enhanced in quickly grown solid samples Rittner07 . This suggests that, if supersolidity exists, it is not an intrinsic property of 4He crystals but rather a consequence of disorder in samples which can be polycrystalline or even glassy. In a recent experiment, we observed dc-mass flow through solid 4He at the liquid-solid (LS) equilibrium, but only in the presence of grain boundaries (GBs) Sasaki06 . The whole issue of supersolidity in 4He being still controversial, it is important to study the physics of GBs in solid 4He. Monte Carlo simulations Pollet predict that GBs have a microscopic thickness, about 3 atomic layers: they should not be completely wet by the liquid phase at the LS equilibrium; it is also predicted that GBs are superfluid below around , except for special orientations. Other numerical studies are in progress Ceperley07 ; Reatto07 . In 4He, GBs thus appear as interesting quasi-2D quantum systems to be studied experimentally.
When emerging at the liquid-solid interface, a grain boundary makes a groove with a dihedral angle ; we have found that is non-zero. This proves that grain boundaries are not completely wet by the liquid phase at the LS equilibrium. From the angle , we deduce a grain boundary energy which is smaller than twice the liquid-solid interfacial energy . We also show that the contact line of GBs on glass windows may or may not be wet by the liquid, depending on and in agreement with a simple model. The premelting of GBs near the solid-liquid transition is an important issue in materials science Besold94 ; Dash95 and direct experimental evidence of GB premelting is scarce in pure systems; it might occur very close to the melting point in aluminum Balluffi and in colloidal crystals Alsayed05 . Our study shows that there is no premelting in 4He, except close to a wall.
GBs in 4He had already been observed by Franck et al., but at high temperature and above Franck83 ; Franck85 . Franck et al. studied films about thick with a Schlieren method. For the fcc phase, a polygonal, foam-like structure was observed; upon heating, the vertices of the foam widened into a curved triangular shape, before melting occurred at the GBs, the grains of the crystal becoming separated. Measurement of dihedral angles was difficult and gave . Because some invasion of the GBs by the liquid was observed together with grain separation upon heating, this experiment is cited by Dash et al. as an evidence for near complete wetting Dash95 or even premelting Dash05 of the GBs. However, Franck et al. studied foam-like thin films, with one side in contact with a glass window, and the other with the liquid. As explained below, our results question Dash’s interpretation of Franck’s observations. Franck et al. also observed the hcp phase which exhibited banded structures with no GB melting, but they could not measure Franck85 .
We have made a square cell by closing with two glass windows a hole in a thick copper plate. This plate is cooled by a dilution refrigerator with optical access along a horizontal axis. The cell allows to visualize the contact of helium crystals between themselves, with copper walls (on the sides) or glass walls (the two windows and a glass piece glued at the top). Images were taken with a CCD camera outside the cryostat. For all crystals studied here, the temperature was between 40 and 100.
When grown slowly by pressurizing superfluid liquid below 1 K, solid 4He is usually a good quality single crystal Balibar05 . To make polycrystals we could either solidify 4He at constant volume from the normal liquid at high temperature or inject mass at low temperature at a fast rate (even when crystallizing the whole sample in 0.1 s, the fill line usually remained open SasakiJLTP ). In order to avoid lengthy temperature cycles, we chose the latter method. By slowly releasing the pressure, we could melt part of it and reveal its polycrystalline structure. Further melting and growth lead to two grains with a single GB as shown on Fig. 1(a). The temperature being highly homogeneous, gravity is relevant and the solid occupies the bottom of the cell.
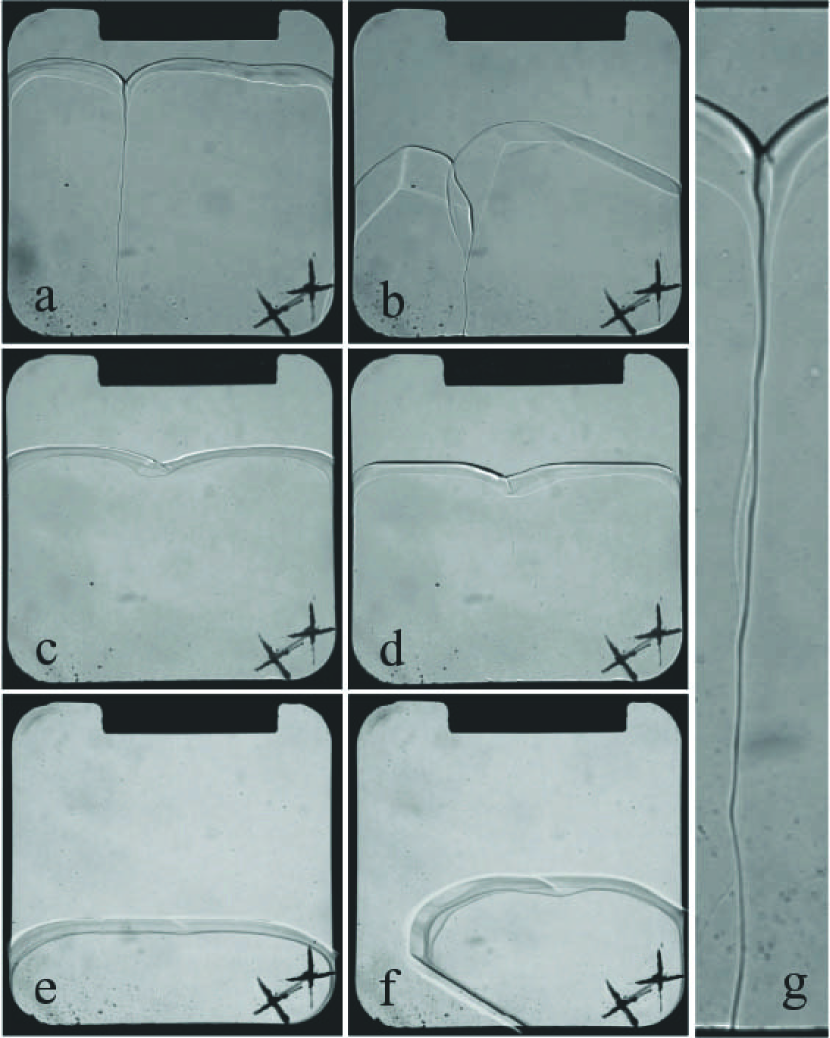
Figs. 1(a,c,e) show that, when emerging at the LS interface, a GB makes a groove whose angle is non-zero. Care was taken to view the groove along the GB direction: the optical axis was rotated until the lowest was found; because the cell is thin, the GBs are often nearly perpendicular to the windows. The groove results from the mechanical equilibrium between the GB surface tension and the LS surface tension . It is known that varies from 0.16 to 0.18 mJ/m2 depending on orientation Balibar05 . If, for simplicity, one neglects this anisotropy, mechanical equilibrium requires
| (1) |
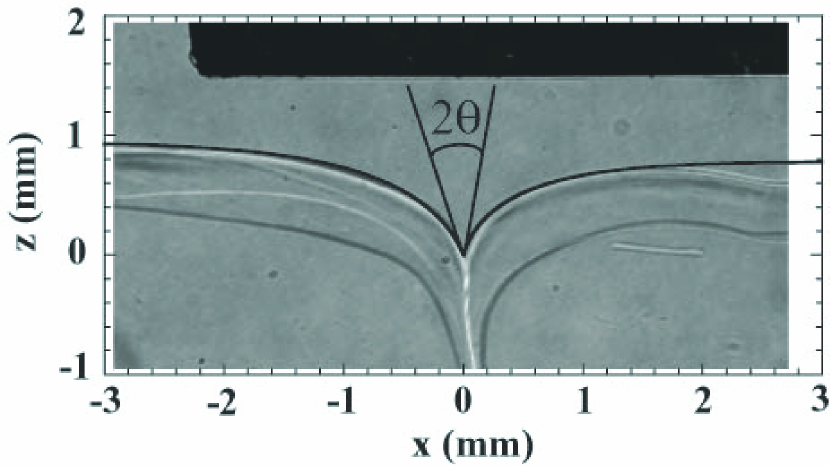
where is half the dihedral angle of the groove. In the case of Fig. 1(a), the optical axis is slightly misaligned in order to show the existence of two liquid channels along the windows. For three well aligned GBs with various orientations, we zoomed on the cusp to measure . They correspond to the general case where the difference in orientation between the two grains is large, as shown by growth shapes (Fig. 1(b)). We obtained , , and by fitting the respective crystal profiles near the cusp with a one dimensional Laplace equation, assuming that the curvature in the plane perpendicular to the windows was constant (see Fig. 2)note .
In the case of Figs. 1(c,d,e,f), crystals were obtained by direct growth, not by melting a foam. Fig. 1(d) shows two crystals with parallel c-facets, but it is possible that the other facets are not. The GB has a lower energy as shown by a larger groove angle. Figs. 1(e,f) show a very shallow groove; they might correspond to a single crystal with a stacking fault.
From Eq. (1), the GB energy is easily obtained as a function of . The depth of the groove is related to through
| (2) |
with (resp. ) the mass per unit volume of the liquid (resp. the solid), and the gravity. Eq. (2) leads to values of which are consistent with those which are directly measured. Note that, in materials science, a similar method is widely used to measure Bolling60 ; Boyuk07 , where the effect of gravity is replaced by a thermal gradient. In the case of 4He, is known from direct measurements Balibar05 .
Figs. 1(a,g) further show that the contact line of a GB with a wall (here the glass windows) can be wet by the liquid, so that it is in fact a liquid channel. We now present a model to calculate the shape and size of this channel, along with the condition for its existence. For simplicity, let us neglect elasticity and assume again that is isotropic. The force balance on the contact line between the liquid and the GB then requires this GB to be a vertical plane perpendicular to the wall, and the liquid channel to be symmetric with respect to this plane (see Fig. 3). Moreover, the LS interface has a contact angle with the glass wall. We have , where and are the solid-wall and liquid-wall surface tensions, respectively. In the past, has been estimated around 45∘ Balibar05 . The present experiment allowed systematic measurements, using the side copper walls and the glass plate at the top of the cell. We found that 45o is indeed an average value, but there is a large scatter in our new measurements, due to hysteresis and pinning effects SasakiJLTP .
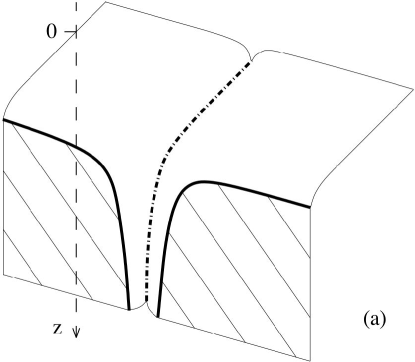
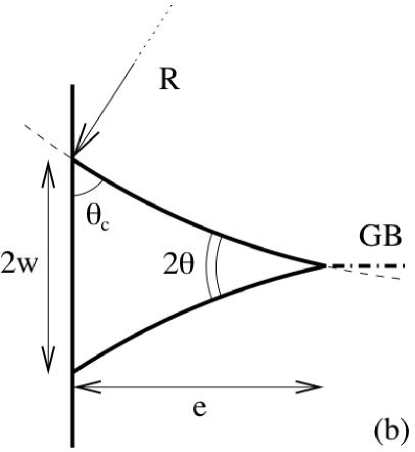
Let be the depth measured from the top of the grains (Fig. 3(a)) where the curvature of the LS interface is small so that the pressure equals the bulk equilibrium pressure . Hydrostatic equilibrium in the liquid gives its pressure . If one keeps neglecting elasticity, the equality of chemical potentials at the LS interface implies that the pressure in the solid is . The pressure difference through the LS interface sets its curvature, according to Laplace’s equation. At a depth larger than the capillary length 1 mm, the curvature in the horizontal plane dominates, and the LS interfaces in a horizontal plane are circular arcs of radius . Fig. 3 (b) shows a horizontal cross section of the channel, and defines its thickness and width . Trigonometry gives:
| (3) | |||
| (4) |
The liquid channel exists if and only if . This is why a channel is seen in Fig. 1(a), not in Figs. 1(c,e). We checked that the relative correction due to the vertical curvature is less than 10 % for SasakiJLTP .
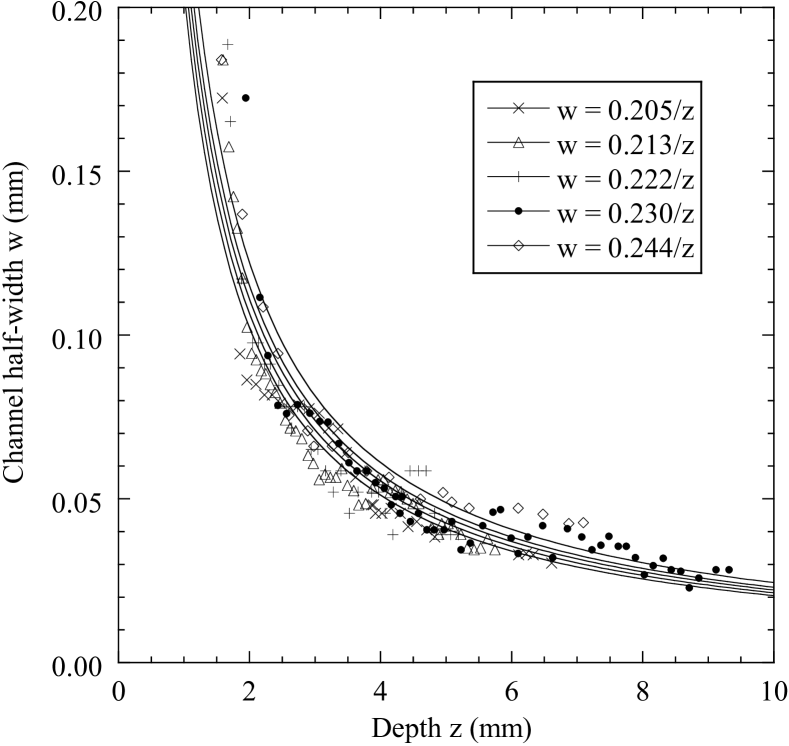
We measured as a function of by enlarging pictures such as Fig. 1(a) and by taking the maximum width of the gap between homogeneous grey regions on both sides of the channel. Fig. 4 shows fits with of 5 different data sets. The values of fall in the range from 0.20 to 0.24 mm2 which is consistent with Eq. (4). The channel width vanishes rapidly as increases: reaches (the typical thickness of a GB Pollet ) at above SasakiJLTP . Note that we have neglected elasticity; in a solid with large stress gradients, there would be positive elastic terms in the solid free energy, so that liquid channels may exist at much larger than . We have also observed that the channels can be pinned to wall defects which locally favor the presence of the liquid phase.
The present results lead us to reconsider the interpretation of the experiments by Franck et al. Franck83 ; Franck85 . They observed an apparent wetting of GBs for fcc crystal foams adsorbed on a glass wall. In our opinion, the above described liquid channels play a role in the structure of their thin films. We have shown that the channel width depends on the departure from ; this would explain why the vertices of the foam widen upon heating, until the grains detach. It also explains why the contrast is lost when the temperature is lowered below Franck85 : it is not due to the disappearance of the GBs, because the contrast is recovered upon heating; we rather think that the channels shrink to submicron dimensions upon cooling, and widen again upon heating.
Let us now reconsider the experiment Sasaki06 where we observed mass transport through solid 4He only in the presence of GBs. Assuming this transport to take place along the GBs, we had found that these GBs were superfluid with a critical velocity of order , a reasonable value for a liquid region a few atomic layers thick Telschow . However, we now realize that mass could also flow along the contact between GBs and walls. Assuming that the cross section area of the channel is at a depth below the free LS interface SasakiJLTP , we find a critical velocity about equal to along the channel. This is again a reasonable value for this channel size Wilks . If mass was really transported along these channels, it would explain why relaxation took place at least up to 1.1 K while GBs are predicted to become superfluid only around 0.5 K Pollet . In order to decide whether mass flows along the GBs themselves or along the side channels, we plan measurements in different cell geometries.
Let us finally comment on supersolidity. Clark et al. recently observed anomalies in a TO filled with solid samples grown at constant temperature from the superfluid liquid Clark , which are likely to be single crystals, consequently without GBs. These anomalies may be due to dislocations whose mobility changes with temperature, as proposed by de Gennes PGG and suggested by recent experiments Day07 . Another explanation could be the superfluidity of dislocation cores Boninsegni but, in this case, since we have observed no mass transport in single crystals Sasaki06 , we would need to suppose that our crystals, being at the LS equilibrium, contain a lower dislocation density.
We have also studied samples grown at constant volume in an hour or so. As in most TO experiments, we used the “blocked capillary method” to prepare such samples at a final pressure between 26 and 30 bar. These crystals were always transparent, showing no measurable light scattering contrary to crystals grown rapidly. When depressurized down to the LS equiliibrium, they appeared polycrystalline with grain sizes of a few microns. Either they were already polycrystalline after growth or they were glassy and crystallized while approaching the melting line. The possible supersolidity of such samples could be due to GBs but, in order to build up a 1% superfluid density with the inside of superfluid GBs only, a very large GB density would be required.
Could 4He samples contain liquid or glassy regions? It was noticed that, after annealing samples grown rapidly, the cell pressure drops by several bars Grigoriev ; Rittner07 . This means that, before annealing, these samples contain low density regions which could be liquid or glassy. We observed a definite scattering of light by crystals grown in a few seconds from the normal liquid or in 0.1 s from the superfluid, which indicates the existence of low density regions with a size comparable to the wavelength of visible light. Similar observations were made before Maekawa ; Ford . In their quenched samples, Rittner and Reppy found very large effects which they presented as supersolid fractions up to 20 % or more Rittner07 . In this case, the large superfluid density could be due to a large concentration of small liquid regions. If these regions are connected by superfluid GBs, the solid samples would show macroscopic phase coherence below the transition temperature of GBs and below their critical velocity which might be small. In any case it is interesting to proceed with the study of GBs by measuring their critical temperature and the critical velocity along them. This should be possible with experimental cells similar to the one described in this Letter.
We are grateful to N. Jamal, H.J. Maris, P. Nozières, and E. Rolley for helpful discussions. This work is supported by ANR grant 05-BLAN-0084-01.
References
- (1) E. Kim and M.H.W. Chan, Nature 427, 225 (2004).
- (2) E. Kim and M.H.W. Chan, Science 305, 1941 (2004).
- (3) A.S. Rittner and J.D. Reppy, Phys. Rev. Lett. 97, 165301 (2006).
- (4) A.S. Rittner and J.D. Reppy, Phys. Rev. Lett. 98, 175302 (2007).
- (5) S. Sasaki, R. Ishiguro, F. Caupin, H.J. Maris, and S. Balibar, Science 313, 1098 (2006).
- (6) L. Pollet et al., Phys. Rev. Lett. 98, 135301 (2007).
- (7) D. Ceperley, Nature Physics 2, 659 (2006).
- (8) M. Rossi et al., arXiv:0707.4099.
- (9) G. Besold and O.G. Mouritsen, Phys. Rev. B 50, 6573 (1995).
- (10) J.G. Dash, H.Y. Fu, and J.S. Wettlaufer, Rep. Prog. Phys. 58, 115 (1995) and references therein.
- (11) R.W. Balluffi and T.E. Hsieh, J. Physique 49 (C5), 337 (1988).
- (12) A. M. Alsayed et al., Science 309, 1207 (2005).
- (13) J.P. Franck, K.E. Kornelsen, and J.R. Manuel, Phys. Rev. Lett. 50, 1463 (1983).
- (14) J.P. Franck et al., J. Low Temp. Phys. 58, 153 (1985).
- (15) J.G. Dash and J.S. Wettlaufer, Phys. Rev. Lett. 94, 235301 (2005).
- (16) S. Balibar, H. Alles, and A. Ya. Parshin, Rev. Mod. Phys. 77, 317 (2005).
- (17) S. Sasaki, F. Caupin, and S. Balibar, in preparation.
- (18) In reality, the best fit gave slightly different values of and on each side of the GB. Eq. (1) should thus be written as , with 1 and 2 standing for each side. We have taken .
- (19) G.F. Bolling and W.A. Tiller, J. App. Phys. 31, 1345 (1960).
- (20) U. Böyük, K. Keşlioğlu, and N. Maraşh, J. Phys.: Cond. Mat. 19, 116202 (2007) and references therein.
- (21) K. Telschow, I. Rudnick, T. G. Wang, Phys. Rev. Lett. 32, 1292 (1974).
- (22) J. Wilks, The properties of liquid and solid helium, Clarendon Press Oxford 1967, p. 390.
- (23) A.C. Clark, J.T. West and M.H.W. Chan, arXiv:0706.0906.
- (24) M. Boninsegni et al., arXiv:0705.2967.
- (25) P.G. de Gennes, Comptes-Rendus 7, 561 (2006).
- (26) J. Day and J. Beamish, preprint 2007.
- (27) V.N. Grigor’ev et al., arXiv:0702133.
- (28) M. Maekawa, Y. Okumura, and Y. Okuda, Phys. Rev. B 65, 144525 (2002).
- (29) N.C. Ford Jr, R. Hallock, and K.H. Langley, J. Low Temp. Phys. 148 653 (2007)