Swift observations of high-redshift radio-loud quasars
Abstract
We report on Swift observations of four radio-loud quasars (0212+735, 0537–286, 0836+710, and 2149–307), classified as blazars. The sources, well-known emitters at soft-medium X-rays, were detected at with the BAT experiment in 15–150 keV. No flux variability was detected within the XRT and BAT exposures, with the exception of 0836+710 which shows an increase of a factor 4 of the 15–150 keV flux on a timescale of one month. The 0.3–10 keV spectra are well fitted by power law models, with rather hard continua (photon indices ); similarly, the 15–150 keV spectra are described by power laws with . The XRT data exhibit spectral curvature, which can be modeled either in terms of excess absorption along the line of sight, or a downward-curved broken power law. In the former case, if the excess NH is at the rest-frame of the source, columns of N cm-2 are measured. Modeling of the SEDs of the four quasars shows that the emission at the higher frequencies, Hz, is dominated by the jet, while the steep optical-to-UV continua, observed with the UVOT, can be attributed to thermal emission from the accretion disk. The disk luminosity is between 1% and 10% the jet power, similar to other powerful blazars.
1 Introduction
Blazars are radio-loud Active Galactic Nuclei (AGN) dominated by non-thermal continuum emission from a relativistic jet closely aligned to the line of sight. Blazars include the luminous Flat Spectrum Radio Quasars (FSRQs), characterized by strong (EW 5Å) broad optical lines, and closer-by BL Lacs, where the optical lines are weak or absent. The Spectral Energy Distributions (SEDs) of blazars, both FSRQs and BL Lacs, span the whole range of the observed electromagnetic spectrum, from radio to GeV and TeV gamma-rays (e.g., Ulrich, Maraschi, & Urry 1997). They are characterized by two broad humps. The first one, ranging from radio to UV/X-ray wavelengths, is widely attributed to synchrotron emission from the jet; the second extends from X-rays to GeV and TeV gamma-rays, and its origin is less well established. A popular interpretation is inverse Compton scattering of ambient photons, either internal (synchrotron-self Compton, SSC; Maraschi et al. 1992) or external (External Compton scattering, EC; Dermer & Schlickeiser 1993, Sikora et al. 1994) to the jet.
In FSRQs the synchrotron component usually peaks at IR/optical wavelengths. The hard () ASCA and BeppoSAX spectra, together with the steeper EGRET spectra, imply a peak of the IC component around a few GeV. While the low- and high-energy ends of the IC component have been relatively well studied, little is known about the emission in the intermediate hard X-ray/soft gamma-ray energy range. The BeppoSAX PDS instrument detected a few FSRQs, including two of the sources of this paper, up to 100 keV with a rather hard continuum, photon index (Tavecchio et al. 2000, Elvis et al. 2003), while only a handful of sources were detected with COMPTEL (Blom et al. 1996; Collmar 2006). More recently, Integral detected a few blazars in outburst above 10 keV (3C 454.3 at =0.86, Pian et al. 2006; NRAO 530 at =0.9, Foschini et al. 2006). With its broad-band coverage, Suzaku is allowing some of the first investigations of the high-energy continuum emission from blazars (RBS 315; Tavecchio et al. 2007).
There are compelling reasons for studying the hard X-ray/soft gamma-ray emission of blazars. First, this is the energy range that connects the onset of the IC component at a few keV to the GeV emission; thus its spectral quantification is important to characterize the peak of the IC component and related physical quantities (e.g., Ghisellini et al. 1998, Tavecchio et al. 2000). Second, in the soft X-ray band a “break” is expected in the EC component, tracking the low-energy tail end of the electron energy distribution (Tavecchio et al. 2000, Fabian et al. 2001). The curvature can be accounted for by excess absorption below 1 keV over the Galactic value, and indeed, medium-hard X-ray observations of high-redshift radio-loud quasars has confirmed the presence of spectral flattening at the lower energies (Page et al. 2005; Reeves & Turner 2000; Cappi et al. 1997). Finally, what makes this energy range of interest is the possibility to detect signatures of a matter-dominated jet (Sikora et al. 1997). The latter is predicted to show a downward-curved continuum in 0.3–10 keV due to the presence of a thermal (blackbody) component related to bulk Compton scattering of the Broad Line Regions photons off the cold particles in the jet (Celotti, Ghisellini, & Fabian 2006).
The advent of sensitive hard X-ray experiments, such as the Burst Alert Telescope (BAT; Barthelmy et al. 2005) in 15–150 keV onboard Swift (Gehrels et al. 2004) is changing our understanding of AGN jets. What makes the BAT of interest is its large field of view and survey mode operation, which allows detection of a large number of relatively bright sources, such as blazars. In fact, during its 3-month survey the BAT (Markwardt et al. 2005) discovered a new, MeV-bright blazar at =2.979, SWIFT J0746.3+2548 (Sambruna et al. 2006a, S06 in the following). Motivated by this discovery, we searched the BAT AGN 9-months archive (Tueller et al. 2007, in prep.) for additional radio-loud quasars, and found four: 0212+735, 0537–286, 0836+710, and 2149–307. From previous observations these quasars are known X-ray emitters at soft-medium X-ray energies (see references in Table 5).
Here we report the analysis and interpretation of the BAT spectra, and follow-up XRT (Burrows et al. 2005) and UVOT (Roming et al. 2005) observations of the four sources. After the description of the Swift observations and data analysis in § 2, and timing and spectral analysis in § 3, we discuss the SEDs and their modeling in § 4. Summary and conclusions follow in § 5. We assume a concordance cosmology with H km s-1 Mpc-1, =0.73, and =0.27 (Spergel et al. 2003). The photon index is defined such that , where is the energy index, .
2 Observations
2.1 The sources
The quasars analyzed here are included in the list of identified extragalactic sources detected by BAT up to August 2006. They are 0212+735, 0537–286, 0836+710, and 2149–307, known blazars at redshifts . With the exception of 0212+735, all sources are well-known emitters at medium-hard X-rays (Donato, Sambruna, & Gliozzi 2004), with hard continua, photon indices . Two of them, 0836+710 and 2149–307, were detected with the BeppoSAX PDS up to 100 keV (Tavecchio et al. 2000, Elvis et al. 2003); 0836+710 was also detected at GeV gamma-rays with EGRET onboard CGRO (Hartman et al. 2003) and with Integral (Beckmann et al. 2006).
Table 1 lists the sources with their basic properties. Also listed are the BAT count rates in 15–150 keV from the 9-month survey, and the count rates from the follow-up XRT observations in 0.3–10 keV. All the four sources were observed more than once with the XRT, with little or no variability.
The sources were also observed at various epochs with the UVOT. As no flux variability is present for each source at the various epochs, the magnitudes were coadded. They are listed in Table 2, together with the flux densities. The magnitudes were corrected for Galactic extinction (see below).
2.2 The X-ray data
BAT:
The reduction of the BAT data was described in S06. Table 1 shows the
BAT count rates; the sources are detected at . Spectra were
integrated for the first 9 months of the BAT survey, and fitted with
XSPEC v.11.3.2, with the response matrix based on the latest
(August 2006) calibration products. Count rates were collected in four
energy bands (14–25 keV, 25–50 keV, 50–100 keV, and 100–200 keV),
and converted into fluxes using a standard diagonal response.
XRT: The unfiltered data were downloaded from the public archive
and processed using xrtpipeline v0.10.6. Standard grade
selection, 0–12 for Photon Counting mode (Hill et al. 2004), was used
for both spectral and timing analysis. Light curves and spectra were
extracted from a circular region centered on the XRT position and with
radius (45–55)′′. The background was extracted from an annulus
centered on the source and with inner and outer radii (65–80)′′ and (125–135)′′, respectively. Inspection of the background
light curve shows no variability. Light curves and spectra were
corrected for the exposure map, accounting for CCD bad columns and
pixels, hot pixels, attitude variations, and telescope vignetting.
The XRT spectra were fitted within XSPEC v.11.3.2ad in the
energy range 0.3–10 keV. We used the latest spectral redistribution
matrices (RMF, v008). Ancillary response files were generated with the
standard xrtmkarf tool v0.5.2 using calibration files from
CALDB v2.6 (as part of the HEAsoft v6.1.2), and corrected for
the exposure map. No pileup is present at the sources’ count
rates. The XRT spectra were rebinned in order to have at least 20
counts in the new bins, to enable use of the statistics.
After checking the consistency of the data at the various epochs, we
performed joint fits to the XRT spectra for each source to improve the
signal-to-noise ratios.
2.3 The optical/UV photometry
The data analysis was performed using the uvotsource task
included in the software release HEAsoft v6.0.5. Photometry was
done using an aperture with a radius of 2′′ and aperture
corrected to the standard UVOT photometry apertures for point sources
(6′′ for the UBV filters and 12′′ for the UV filters).
The magnitudes were corrected for absorption and converted into the
fluxes in Table 2. The adopted reddening corrections are E(B-V)=0.744,
0.025, 0.101, and 0.025 mag for 0212+735, 0537-236, 0836+715, and
2149-307, respectively (Schlegel et al. 1998). While 0836+710 and
2149–307 are well detected with all the optical and UV filters,
0212+735 and 0537–286 were not detected in the UV, where 3
upper limits are given for the flux densities.
3 X-ray Analysis
3.1 Timing Analysis
Within the short XRT exposures there is no evidence for significant flux variability. The only exception is the second observation of 2149–307, where a flux change of a factor 2 in 3 hours is observed. The variability is significant at 99.2% confidence according to the test. Comparison of the 2–10 keV flux with previous ASCA, BeppoSAX, and XMM-Newton observations reveals that the XRT observed the sources in a typical average state (§ 3.2.4).
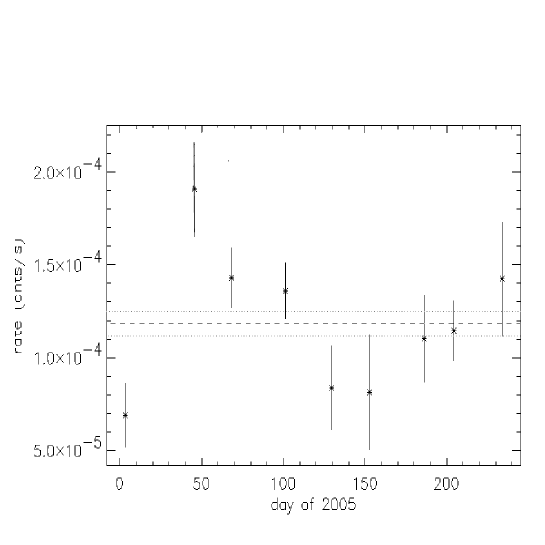
Light curves were also extracted in the energy range 15–150 keV, and binned with 28-day bins. No episodes of outburst are present in the BAT 9-months light curves; a test returns values of =1.23, 3.34, 3.1, and 2.99 for 0212+735, 0537–286, 0836+710, and 2149–307, respectively. Because of the large statistical errors, the minimum value indicating possible variability is . Based on this criterion, evidence for flux variations is present only in 0836+710 (Fig. 1), where the 15–150 keV flux increased by a factor 4 on a timescale of one month, followed by a similar-amplitude decay in 3–4 months.
3.2 Spectral Fits
Table 3 reports the results of the spectral fits to the BAT and XRT spectra of the four sources. The best-fit parameters and their 90% uncertainties for one parameter of interest (=2.7) are listed, together with the observed fluxes and intrinsic (absorption-corrected) luminosities. The significance of adding free parameters to the model was evaluated with the F-test, with related probability PF.
3.2.1 BAT
The BAT spectra were fitted with a single power law with no absorption, as the latter, for the small column densities involved in this work, has negligible effects above 10 keV. The results of the fits are listed in Table 3a. The fits with the power law model are satisfactory, yielding slopes in the range .
3.2.2 XRT
The XRT spectra of the sources were fitted in 0.3–10 keV at first with a single power law model plus a column density NH fixed to the Galactic value. Inspection of the residuals of this model (Figure 2) reveals spectral flattening below 2 keV in all sources. This indicates a curved continuum, either because of excess absorption over Galactic at the lower energies, or because of intrinsic curvature.
We thus fitted the XRT continua with two phenomenological models: 1) a power law with an extra absorber, N, assumed to be at the source’s rest-frame; and 2) a broken power law. The Galactic column density was included in both models. The results for both models are listed in Table 3b. Generally, models 1 and 2 both provide an equally acceptable fit except in the case of 0836+710, where the curved broken power law is preferred over the absorbed power law at PF=99%.
3.2.3 Joint fits to XRT+BAT
Joint spectral fits to the XRT and BAT data were also attempted. Even before formally fitting, it was apparent that the BAT data lied on the extrapolation of the XRT best-fit model, both for the absorbed power law and the broken powerlaw. An exception is 0836+710, where the BAT lie above the extrapolation of the XRT power law, as expected.
The 0.3–150 keV spectra were formally fitted with the absorbed power law model (broken powerlaw for 0836+710), which gave fitted parameters very similar to those of the XRT continuum alone; Table 3c reports these fits, while the data are shown in Figure 3. Similarly, the broken power law fits (not reported) gave similar parameters to the XRT alone. We also searched for the Compton bump by adding a blackbody to the power law, with no fit improvement. For 0836+710, however, the addition of a blackbody with fitted temperature keV provides much better BAT residuals. More sensitive observations, such as those already performed with Suzaku, are needed to confirm the possible Compton bump in this object.
3.2.4 Comparison to previous X-ray observations
Table 4 presents a compilation of previous observations at X-rays of the sources, specifically, X-ray fluxes and photon indices measured by previous missions in the energy bands 2–10 keV (ASCA, XMM-Newton, BeppoSAX) and 10 keV (BeppoSAX, Integral). Only 0537–286, 0836+710, and 2149–307 were observed above 2 keV; the only previous observation of 0212+735 was during the ROSAT All-Sky Survey. During the RASS, 0212+735 had a count rate of 0.0437 c/s in 0.2–2.4 keV, consistent with the extrapolation of the XRT best-fit model to these energies.
Inspection of Table 4 reveals modest-amplitude (factor 2) flux variability at medium-hard X-rays, with little or no spectral changes. The only hint for correlated flux and spectral changes is for 0836+710: between the BeppoSAX and Swift observations the flux decreased slightly (factor 1.6) with the continuum becoming softer.
Above 10 keV, only 0836+710 and 2149–307 were previously observed with BeppoSAX (Tavecchio et al. 2000; Elvis et al. 2003). In 0836+710, the 20–200 keV flux decreased by a factor 5 between the PDS and BAT epochs while the continuum steepened from to . Only modest-amplitude flux variations, factor 1.5, are observed for 2149–307, with no spectral changes.
4 Discussion
4.1 X-ray spectra of high-redshift radio-loud quasars
X-ray observations of high-redshift quasars with ROSAT and ASCA found evidence for significant excess column densities in radio-loud but not in radio-quiet sources (Cappi et al. 1997, Reeves & Turner 2000). It was claimed that excess absorption is a common property of radio-loud quasars only, and as such most likely of intrinsic origin. Based on multi-epoch X-ray spectroscopy, it was also claimed that absorber is variable.
Indeed in several high-redshift blazars () the steepening of the soft X-ray spectrum is interpreted (e.g., Worsley et al. 2006 and references therein) in terms of absorption by a dense region of warm plasma ( cm-2) present in the region surrounding the QSO, and expected to be in the form of a wind/outflow (e.g., Fabian 1999). However, the absorption scenario poses several difficulties. In particular, it appears difficult to reconcile the presence of a large gas column on the line of sight to the jet, which is expected to efficiently remove gas from its vicinity, in particular in the case of blazars for which the line of sight must be close to the axis of the jet.
As mentioned before, a viable alternative to absorption is to assume that continuum is intrinsically curved. Indeed, a hardening of the continuum is naturally expected in the soft X-ray band, where the EC emission is produced by the relativistic electrons with the lowest energy. The exact shape of the spectrum in this region depends on the detailed energy distribution of the electrons and on the spectrum of the soft photons, but the overall shape could easily mimick the effect of absorption (for more details see Tavecchio et al. 2007). The hardening of the EC component in the soft band can be hidden by the presence of the SSC component. From the observational point of view, however, the contribution of the SSC decreases for increasing jet power; in the most powerful sources, such as discussed in this paper, the EC component is basically “naked” and the break can be observed.
Celotti et al. (2006) discussed the possible the presence of a weak thermal bump around 10 keV produced by inverse Compton scattering of external photons by cold leptons in the jet approaching the BLR region (the so-called bulk Compton emission). The direct detection of such a component, however, has remained elusive, since the emission is dominated by the strong non-thermal emission (SSC, EC). While Suzaku is more sensitive at the higher energies than the BAT, the latter has the advantage of a continuous scan of the sky with a large field of view. This allows for the study of a larger number of sources, and - on the long run - the possibility to detect faint ones as well. However, clearly Suzaku remains the instrument of choice for a quasi-instantaneous snapshot of the broad-band X-ray spectrum.
4.2 Spectral Energy Distributions
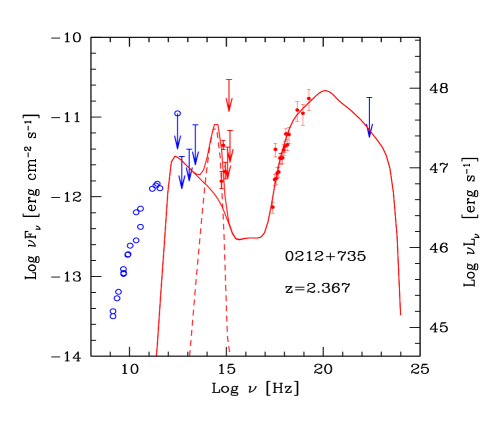
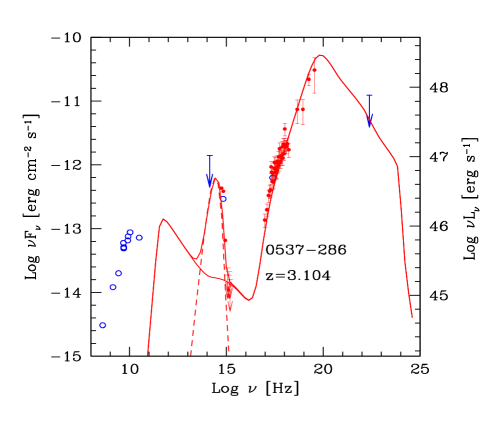
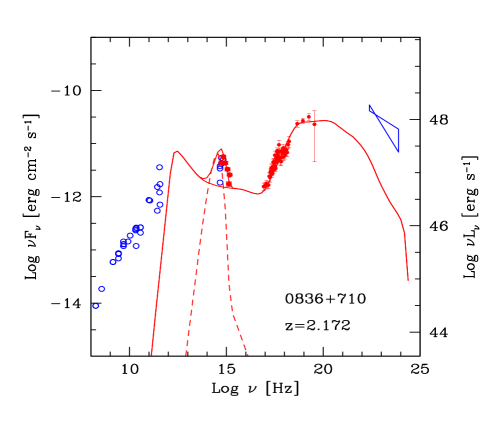
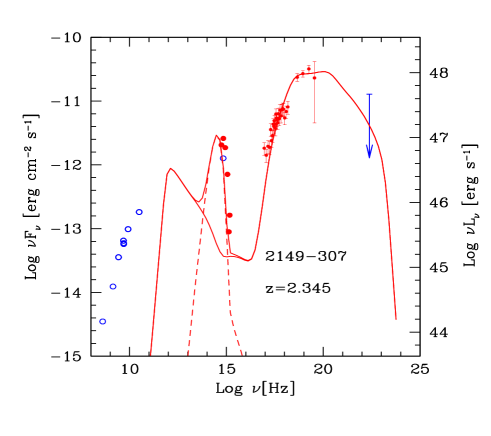
The Spectral Energy Distributions (SEDs) of the four sources, assembled from Tables 1 and 2 and from observations at longer wavelengths from the literature, are shown in Figure 4. In all the cases we report the X-ray data obtained assuming that the continuum is intrinsically curved (i.e., without extra-absorption; see Tavecchio et al. 2007). For 0836+710, the only source detected at GeV gamma-rays with EGRET (Hartman et al. 2003), the GeV data are shown as well while for the remaining sources 3 GeV upper limits are shown, based on the EGRET sensitivity. Inspection of Figure 4 reveals the typical double-peaked SEDs of blazars (§ 1) with the first hump due to synchrotron emission from relativistic electrons in the jet, and the second component due to IC, either SSC or/and EC.
Our four sources are technically classified as Flat Spectrum Radio Quasars (FSRQs), as they are known to exhibit strong broad emission lines in their optical spectra. The SEDs in Figure 4 exhibit a very steep optical-to-UV continuum. This strongly suggests that the emission in this band is dominated by a thermal-like component, possibly associated with the blue-bump component that characterizes the quasar optical region (e.g., Sun & Malkan 1989), usually thought to be associated with the putative accretion disk. If we assume that, as in most FSRQs, the peak of the synchrotron emission is at IR, than we are forced to conclude that the optical-UV emission in the SEDs in Figure 4 has a different origin than the longer wavelengths. This is similar to the case of SWIFT J0746.3+2548 (S06), where the emission in optical-UV was also interpreted as due to the thermal contribution of the accretion disk/BLRs.
Note that in 0212+735 and in 0537–286 the optical-to-UV peak is very narrowly defined, due to a sudden increase of the flux in the B filter (Table 2). A possibile explanation for this increase could be that the continuum flux in the B-band is strongly contaminated by the redshifted Ly emission line, which is usually strong in luminous quasars (Lanzetta, Turnshek, & Sandoval 1993). It is also possible that the steep cutoff in the UV could be due, at least in part, to intervening absorption; for 0537–286, a strong continuum discontinuity attributed to the the Lyman continuum edge was detected at 3650 Å in an early optical spectrum, implying an intervening column density cm-2 (Wright et al. 1978). Ideally, optical-UV polarimetry could ascertain the origin of the optical-UV continuum in these sources, distinguishing between thermal (disk) and non-thermal, highly polarized (jet) emission. Such observations in case of 0836+710 yielded a polarimetry degree of % (Impey & Tapia 1990), lower than usually observed in the jet-dominated continuum of other blazars.
The hard BAT spectra, together with the limits from EGRET at GeV energies, imply a peak of the IC component around a few GeV. This is in contrast to SWIFT J0746.3+2548, detected during a flaring state with BAT (S06). In this source, the exceptionally hard BAT spectrum () and the previous EGRET non-detection imply a peak of the IC component around MeV energies. Thus, it could be the case that during hard X-ray outbursts the IC peak moves from GeV to MeV energies, but only detailed monitoring at the higher energies can address this issue. This will soon be possible with GLAST.
4.3 Modeling the SEDs
We reproduce the multiwavelength SEDs of the four quasars in Figure 4 using a simple, one-zone, homogeneous synchrotron and inverse Compton model, fully described in Ghisellini, Celotti, & Costamante (2002). The basic assumptions of the model are:
1) The source, moving with a bulk Lorentz factor and seen at an angle , is a cylinder of cross sectional radius , where is the distance from the apex of the jet, assumed conical of semiaperture angle . The width , as measured in the comoving frame, is here assumed to be equal to . The magnetic field is homogeneous and tangled.
2) The external radiation is produced at a fixed radius, identified with the radius of the broad line region, . We choose to model this component with a black body with luminosity peaking at the typical frequency of Hz (in the quasars’ rest-frame). This component approximates the radiation reprocessed and re-isotropized by the BLR clouds. We assume that 10% of the disk luminosity is reprocessed by the broad line region. Note that, besides the contribution of the BLR, other processes can contribute to the external radiation, such as scattering by ionized intercloud plasma, synchrotron radiation “mirrored” by the clouds and/or the walls of the jet, reprocessing by a molecular torus (Ghisellini & Madau 1996). Inclusion of these second-order effects is not warranted by the limited data coverage, especially at IR wavelengths.
3) Relativistic electrons are injected with luminosity and the distribution is the result of injection and cooling. We calculate for which the particles cool in one light crossing time. If the particles are injected between and with a power law distribution of slope , in the “fast cooling” regime (), we have between and , (where is the injection slope increased by one unit) and between and . In the models presented here, this is always the case, since is of order unity in all cases.
The results of the fits to the SEDs with this model are shown in Figure 4 (solid lines). The assumed parameters are reported in Table 5. In all cases we interpret the UVOT data as tracing the high-frequency tail of the disk emission; this allows us to fix the disk luminosity . For all the sources we assume that the peak of the IC component is just above the BAT band: with this choice (consistent with the non-detection in the EGRET band for three of the objects) we minimize the emitted radiative power of the jets. Note that large variations in the -ray band could be easily obtained by changing the upper end of the electron energy distribution , without appreciable variations in the X-ray band.
Assuming the composition of one proton per emitting electron (for the reason of this choice see Maraschi & Tavecchio 2003), we infer jet kinetic powers of erg s-1. This can be compared with the radiative output of the disk erg s-1. The ratio is of the same order of magnitude as found in other cases for which both powers can be estimated with reasonable accuracy (Tavecchio et al. 2000; Maraschi & Tavecchio 2003). The parameters used to reproduce the SEDs are close to those usually found for other powerful blazars.
Figure 4 shows that in the four quasars the jet component dominates the high-energy emission above a few hundred eV. It is interesting to compare with intermediate-redshift radio-loud quasars. Analysis of the core SEDs of three blazars at z=0.3–0.8 with detected Chandra jets (Sambruna et al. 2006b) shows that in these sources, the jet contributes only 50% of the X-ray emission in 0.3–10 keV, becoming dominant at higher energies. A narrow Fe K line at 6 keV with EW 100 eV was in fact detected in the three sources, as well as an optical-UV bump related to the accretion disk. Thus, it appears that the high-energy spectra of radio-loud quasars may contain significant contribution from thermal emission of the accretion disk; however, the jet becomes increasingly dominant at X-ray energies with increasing jet power/. This is not unexpected if selection biases due to beaming are at work: only the most beamed, and thus jet-dominated, radio-loud quasars can be detected at cosmological distances.
The sources discussed in this work are quite similar to RBS 315, another high-redshift () FSRQ recently observed by us with Suzaku (Tavecchio et al. 2007). In this case as well the X-ray spectrum flattens in the soft X-ray band, requiring either absorption or intrinsic curvature of the underlying continuum. A previous XMM-Newton observation of RBS 315 revealed an extremely hard X-ray continuum, with photon index , requiring an extremely flat electron distribution. Very hard spectra () are also displayed by our sources (Table 4).
5 Summary and Conclusions
Using the BAT experiment on-board Swift, we detected hard ( 10 keV) emission from four radio-loud quasars. From the modeling of the (non-contemporaneous) SEDs, we find that the jet dominates the emission at higher energies, while the steep optical-UV continuum is readily interpreted as due to the accretion disk. Polarimetry of the optical and UV continuum from these quasars is encouraged to confirm this intepretation. The disk luminosity is 1%–10% the power in the jet.
High-redshift blazars qualify as excellent candidates to investigate the disk-jet connection in radio-loud AGN. Soon another very important piece of the puzzle will be available, thanks to the launch of the GLAST observatory. The synergy between GLAST and Swift holds the key to elucidate the origin of the high-energy radiation from powerful radio-loud quasars.
References
- (1)
- (2) Barthelmy, S.D. et al. 2005, Space Science Review, 120, 143
- (3)
- (4) Beckmann, V. Gehrels, N., Schrader, C.R., & Soldi, S. 2006, ApJ, 638, 642
- (5)
- (6) Blom, J.J. et al. 1996, A&AS, 120, 107
- (7) Burrows, D. et al. 2005, Space Science Review, 120, 165
- (8) Cappi, M. et al. 1997, ApJ, 478, 492
- (9) Celotti, A., Ghisellini, G., & Fabian, A.C. 2006, MNRAS, in press
- (10) Collmar, W. 2006, ASPC, 350, 120
- (11) Dermer, C.D. & Schlickeiser, R. 1993, ApJ, 416, 458
- (12) Donato, D., Sambruna, R.M., & Gliozzi, M. 2004, ApJ, 617, 915
- (13) Elvis, M. et al. 2000, ApJ, 544, 545
- (14) Fabian, A.C. et al. 2001, MNRAS, 323, 373
- (15) Fabian, A.C. 1999, MNRAS, 308, L39
- (16) Foschini, L. et al. 2006, A&A, 450, 77
- (17) Gehrels, C. et al. 2004, ApJ, 611, 1005
- (18) Ghisellini, G., Celotti, A., & Costamante, L. 2002, A&A, 386, 833
- (19) Ghisellini, G. et al. 1998, MNRAS, 301, 451
- (20) Ghisellini, G. & Madau, P. 1996, MNRAS, 280, 67
- (21) Hartman, R.C. et al. 1999, ApJS, 123, 79
- (22) Hill, J.E. et al. 2004, SPIE, 5165, 217
- (23) Impey, C.D. & Tapia, S. 1990, ApJ, 354, 124
- (24) Lanzetta, K.M., Turnshek, D.A., & Sandoval, J. 1993, ApJS, 84, 109
- (25) Maraschi, L., & Tavecchio, F. 2003, ApJ, 593, 667
- (26) Maraschi, L., Ghisellini, G., & Celotti, A. 1992, ApJ, 397, L5
- (27) Markwardt, C. B., Tueller, J., Skinner, G. K., Gehrels, N., Barthelmy, S. D., & Mushotzky, R. F. 2005, ApJL, 633, L77
- (28) Page, K. L., Reeves, J. N., O’Brien, P. T., & Turner, M. J. L. 2005, MNRAS, 364, 195
- (29) Pian, E. et al. 2006, A&A, 449, L21
- (30) Reeves, J.N. & Turner, M.J.L. 2000, MNRAS, 316, 234
- (31) Roming, P. et al. 2005, Space Science Review, 120, 95
- (32) Sambruna, R.M. et al. 2006a, ApJ, 646, 23 (S06)
- (33) Sambruna, R.M., Gliozzi, M., Tavecchio, F., Maraschi, L., & Foschini, L. 2006b, ApJ, 652, 146
- (34) Schlegel, D. J., Finkbeiner, D. P., & Davis, M. 1998, ApJ, 500, 525
- (35) Sikora, M., Madejski, G. M., Moderski, R., & Poutanen, J. 1997, ApJ, 484, 108
- (36) Sikora, M., Begelman, M. C., & Rees, M. J. 1994, ApJ, 421, 153
- (37) Sun, W.-H. & Malkan, M.A. 1989, ApJ, 346, 68
- (38) Spergel, D.N. et al. 2003, ApJS, 148, 175
- (39) Tavecchio, F., et al. 2007, ApJ, in press
- (40) Tavecchio, F., et al. 2000, ApJ, 543, 535
- (41) Tavecchio, F., Maraschi, L., & Ghisellini, G. 1998, ApJ, 509, 608
- (42) Ulrich, M.-H., Maraschi, L., & Urry, C.M. 1997, ARA&A, 35, 445
- (43) Wright, A.E., Peterson, B.A., Jauncey, D.L., & Condon, J.J. 1978, ApJ, 226, L61
- (44) Worsley, M.A., Fabian, A.C., Pooley, G.G., & Chandler, C.J. 2006, MNRAS, 368, 844
- (45)
| Table 1: radio-loud quasars detected by BAT | ||||||||
| Source | RA(2000) | DEC(2000) | NH | BAT | Date | Exp | XRT | |
| (1) | (2) | (3) | (4) | (5) | (6) | (7) | (8) | (9) |
| 0212+735 (1) | 02 17 30.8 | +73 49 33 | 2.367 | 27.0 | 3.8 0.9 | 2005 December 1 | 4.6 | 6.6 0.4 |
| (2) | 2006 July 18 | 6.5 | 6.9 0.3 | |||||
| (3) | 2006 July 19 | 1.0 | 6.8 0.8 | |||||
| 0537–286 (1) | 05 39 54.3 | –28 39 56 | 3.104 | 1.9 | 4.4 0.9 | 2005 November 24 | 9.2 | 5.0 0.2 |
| (2) | 2005 December 8 | 14.7 | 5.5 0.2 | |||||
| (3) | 2006 October 27 | 3.0 | 5.3 0.5 | |||||
| (4) | 2006 October 30 | 3.9 | 6.7 0.4 | |||||
| (5) | 2006 October 31 | 3.4 | 5.0 0.2 | |||||
| (6) | 2007 May 17 | 5.4 | 6.7 0.3 | |||||
| 0836+710 (1) | 08 41 24.3 | +70 53 42 | 2.172 | 2.9 | 10.2 0.9 | 2006 April 1 | 4.4 | 37.9 0.9 |
| (2) | 2006 July 10 | 1.9 | 28.1 1.0 | |||||
| (3) | 2007 April 4 | 7.3 | 28.9 0.6 | |||||
| 2149–307 (1) | 21 51 55.5 | –30 27 54 | 2.345 | 1.9 | 9.5 1.6 | 2005 December 10 | 3.1 | 31.2 1.0 |
| (2) | 2005 December 13 | 2.3 | 25.1 1.1 | |||||
Explanation of Columns: 1=Source name; 2=RA(2000) in hh mm ss; 3=DEC(2000) in dd mm ss; 4=Redshift; 5=Galactic column density (in cm-2); 6=Count rate in 15–150 keV from the 9-months BAT survey in counts s-1; 7=Date of the XRT follow-up observation; 8=XRT net exposure after data screening (in ks); 9=Count rate in 0.3–10 keV in 10-2 counts s-1.
| Table 2: UVOT Observations | |||||
| Source | Filter | Wavelength | Mag | Flux | Exposure |
| (1) | (2) | (3) | (4) | (5) | (6) |
| 0212+735 | V | 5402 | 17.60 0.26 | 2.9 0.7 | 1006 |
| B | 4331 | 16.49 0.14 | 10.2 1.3 | 924 | |
| U | 3450 | 16.86 0.25 | 6.0 1.4 | 1004 | |
| UVW1 | 2634 | 16.85 | 17.7 | 2344 | |
| UVM2 | 2231 | 15.04 | 91.0 | 2789 | |
| UVW2 | 2034 | 16.22 | 34.6 | 4088 | |
| 0537–286 | V | 5402 | 18.99 0.07 | 0.80 0.05 | 1995 |
| B | 4331 | 19.58 0.06 | 0.89 0.05 | 1436 | |
| U | 3507 | 20.59 0.14 | 0.19 0.03 | 1962 | |
| UVW1 | 2634 | 22.18 | 0.06 | 3984 | |
| UVM2 | 2231 | 22.52 | 0.06 | 6086 | |
| UVW2 | 2034 | 22.74 | 0.06 | 8108 | |
| 0836+710 | V | 5402 | 16.49 0.07 | 8.1 0.52 | 372 |
| B | 4331 | 16.66 0.06 | 13.1 0.7 | 372 | |
| U | 3507 | 16.31 0.07 | 12.5 0.8 | 372 | |
| UVW1 | 2634 | 16.31 0.07 | 12.5 0.8 | 746 | |
| UVM2 | 2231 | 17.15 0.10 | 7.8 0.7 | 948 | |
| UVW2 | 2034 | 16.96 0.05 | 12.7 0.6 | 1518 | |
| 2149–307 | V | 5402 | 17.31 0.06 | 3.8 0.2 | 441 |
| B | 4331 | 17.52 0.05 | 6.0 0.3 | 287 | |
| U | 3507 | 16.98 0.05 | 5.4 0.3 | 441 | |
| UVW1 | 2634 | 17.98 0.07 | 2.7 0.2 | 879 | |
| UVM2 | 2231 | 20.40 0.22 | 0.4 0.08 | 1322 | |
| UVW2 | 2034 | 19.99 0.13 | 0.8 0.1 | 2120 | |
Explanation of Columns: 1=Source name; 2=Filter; 3=Center wavelength in Å; 4=Observed magnitude; 5=Flux density in erg cm-2 s-1 Å-1, dereddened for Galactic absorption. Upper limits are 3; 6=Exposure in s.
| Table 3: Spectral fits | ||||||||||
| Power Law | Broken Power Law | Flux | Lum | |||||||
| Source | N | /dofs | Eb | /dofs | ||||||
| (1) | (2) | (3) | (4) | (5) | (6) | (7) | (8) | (9) | (10) | |
| 3a: Fits to the BAT continuum in 15–150 keV | ||||||||||
| 0212+735 | 1.84 | 0.63/1 | 23 | 78 | ||||||
| 0537–286 | 1.26 | 0.97/2 | 49 | 86 | ||||||
| 0836+710 | 1.83 | 0.23/2 | 65.9 | 95.7 | ||||||
| 2149–307 | 1.44 | 0.58/2 | 88.0 | 110 | ||||||
| 3b: Fits to the XRT continuum in 0.3–10 keV | ||||||||||
| 0212+735 | 6.5 | 1.32 | 1.22/41 | 0.9 | 3.9 | 1.7 | 1.25/40 | 5.6–6.9 | 7.5–14.0 | |
| 0537–286 | 1.3 | 1.36 0.07 | 1.09/105 | 0.43 | 0.9 | 1.35 0.05 | 0.90/102 | 2.9–3.2 | 10.1–11.3 | |
| 0836+710 | 0.81 | 1.53 | 1.09/168 | 1.15 | 1.7 | 1.61 | 1.05/167 | 16.7–20.7 | 29.6–36.8 | |
| 2149–307 | 0.25 | 1.50 | 0.97/66 | 1.25 0.20 | 1.3 | 1.56 | 0.95/65 | 11.9–14.8 | 25.2–31.3 | |
| 3c: Fits to the XRT + BAT continuum in 0.3–150 keV | ||||||||||
| 0212+735 | 8.8 | 1.43 | 1.20/44 | |||||||
| 0537–286 | 1.4 0.6 | 1.38 0.07 | 0.90/106 | |||||||
| 0836+710 | 1.16 0.13 | 1.70 | 1.8 | 1.04/168 | ||||||
| 2149–307 | 0.25 | 1.50 | 0.94/69 | |||||||
Explanation of Columns: 1=Source name; 2=Column density at the source’s rest-frame ( cm-2); 3=Photon Index; 4=Reduced and degrees of freedom; 5=Photon Index below the break; 6=Photon Index above the break; 7=Break energy (keV); 8=Reduced and degrees of freedom; 9=Observed flux in 20–200 keV (BAT) and 2–10 keV (XRT) from the best-fit model (10-12 erg cm-2 s-1); 10=Intrinsic (absorption-corrected) luminosity in 20–200 keV (BAT) and 2–10 keV (XRT) from the best-fit model ( erg s-1).
Notes: a=All components are absorbed by the Galactic column density.
| Table 4: Swift and Previous X-ray Observations | ||||||||||
| a: In the 2–10 keV energy range | ||||||||||
| Source | ASCA | BeppoSAX | XMM-Newton | Swift | Refs. | |||||
| 0537–286 | Fluxa | 2.04 | 2.93 | 2.9–3.2 | 1,2 | |||||
| 1.41 0.01 | 1.36 0.07 | |||||||||
| 0836+710 | Fluxa | 18.5 | 26.0 | 21.52 | 16.7–20.7 | 1,3,2 | ||||
| 1.33 0.04 | 1.37 0.01 | 1.53 | ||||||||
| 2149–307 | Fluxa | 14.05 | 8.0 | 3.5 | 11.9–14.8 | 1,4,2 | ||||
| 1.4 0.04 | 1.47 0.01 | 1.50 | ||||||||
| b: In the 20–200 keV energy range | ||||||||||
| Source | BeppoSAX | Integral | Swift | Refs. | ||||||
| 0836+710 | Fluxa | 230 | 77.7 | 65.9 | 3,5 | |||||
| 1.43 0.05 | 1.65 | 1.83 | ||||||||
| 2149–307 | Fluxa | 57.0 | 88.0 | 4 | ||||||
| 1.40 0.04 | 1.44 | |||||||||
Notes: a=Observed flux in erg cm-2 s-1.
References: 1=Reeves & Turner (2000); 2=Page et al. (2005); 3=Tavecchio et al. (2000); 4=Elvis et al. (2000); 5=Beckmann et al. (2006).
| Table 5: SEDs Parameters | ||||||||||
| Source | ||||||||||
| (1) | (2) | (3) | (4) | (5) | (6) | (7) | (8) | (9) | (10) | (11) |
| 0212+735 | 1.5 | 12 | 3.0 | 10 | 8 | 100 | 2 | 2.5 | 4 | 12 |
| 0537-286 | 2.0 | 15 | 3.0 | 2.5 | 13 | 20 | 2.9 | 0.6 | 4.5 | |
| 0836+710 | 1.5 | 13 | 3.3 | 12 | 12 | 6 | 5 | 3.0 | 2.8 | 15 |
| 2149-307 | 1.0 | 17 | 3.0 | 7 | 6 | 4.5 | 2.9 | 1.5 | 8.0 | |
Explanation of Columns: 1=Source name; 2=Radius of emitting region in units of cm; 3=Bulk Lorentz factor; 4=Viewing angle (degrees); 5=Magnetic field intensity (G); 6=Intrinsic injected power in units of erg s-1; 7=Minimum random Lorentz factor of the injected particles; 8=Maximum random Lorentz factor of the injected particles; 9=Spectral slope of injected particles; 10=Disk luminosity in units of erg s-1; 11=Radius of the BLR in units of cm.