A Chandra study of particle acceleration in the multiple hotspots of nearby radio galaxies
Abstract
We present Chandra observations of a small sample of nearby classical double radio galaxies which have more than one radio hotspot in at least one of their lobes. The X-ray emission from the hotspots of these comparatively low-power objects is expected to be synchrotron in origin, and therefore to provide information about the locations of high-energy particle acceleration. In some models of the relationship between the jet and hotspot the hotspots that are not the current jet termination point should be detached from the energy supply from the active nucleus and therefore not capable of accelerating particles to high energies. We find that in fact some secondary hotspots are X-ray sources, and thus probably locations for high-energy particle acceleration after the initial jet termination shock. In detail, though, we show that the spatial structures seen in X-ray are not consistent with naïve expectations from a simple shock model: the current locations of the acceleration of the highest-energy observable particles in powerful radio galaxies need not be coincident with the peaks of radio or even optical emission.
1 Introduction
In the standard model for powerful extragalactic double radio sources (also known as classical double or FRII [Fanaroff & Riley 1974] sources), hotspots, the bright compact regions at the ends of the source, are the visible manifestation of a strong shock as the relativistic beam of energetic particles is suddenly decelerated by interaction with the slow-moving or stationary plasma within the radio lobes (e.g., Blandford & Rees, 1974). The particle acceleration at these shocks determines the energy distribution of the electrons (and, possibly, protons) that go on to form the large-scale lobes and expand into the external medium, and so an understanding of how and where it happens is essential to an understanding of the dynamics and environmental impact of radio sources; in addition, the strong shocks in FRIIs are often invoked as a possible region of acceleration for the high-energy cosmic ray population, so that it is important to understand where (and if) high-energy particles are accelerated in these systems.
The best evidence for this shock model comes from the radio through optical spectra of hotspots, which have been shown (e.g., Meisenheimer et al., 1989) to be commonly consistent with the predictions of a simple model for shock particle acceleration and downstream losses (Heavens & Meisenheimer, 1987). However, the idea that the hotspots always trace the shock at the jet termination is challenged by the observation that the lobes of radio galaxies and quasars very frequently have more than one compact bright radio feature that meets whatever definition of a hotspot is in use (e.g., Leahy et al., 1997). Where these appear in the jet or embedded deep in the lobe they are usually interpreted as ‘jet knots’ — the assumption encoded in this terminology is that they are telling us about internal dissipation in the jet rather than disruption and that they are not relevant to the particle acceleration history of the source. But in many systems there are multiple hotspots at the far end of the lobe, and in these the configuration of the hotspots relative to the jet flow often suggests that more than one is associated with the beam termination. Models to explain this observation include those in which the beam end-point moves about from place to place in the lobe (the ‘dentist’s drill’ model of Scheuer 1982) or in which material flows out from the initial impact point of the beam to impact elsewhere on the lobe edge (the ‘splatter-spot’ model of Williams & Gull 1985 or the jet-deflection model of Lonsdale & Barthel 1986). All these models predict that one of the hotspots, the one associated with the first or current termination of the jet, should be more compact than the other or others; it is in fact observed in the radio that where jets are explicitly seen to terminate, they always do so in the most compact, ‘primary’ hotspot (e.g., Leahy et al., 1997; Hardcastle et al., 1997). But it is very difficult to distinguish between different models of multiple hot spot formation using radio data alone. The secondary (less compact) hotspots exhibit a wide variety of structures and relationships to the primary hotspots, and, while in some cases radio structure seems to favor one model rather than another, the nature of the secondaries is never unambiguously constrained by single-frequency radio data. One area in which different models do make different predictions is that of the high-energy particle acceleration in the secondary (less compact) hotspots. If these are relics left behind by the motion of the jet, as in the ‘dentist’s drill’ model, then in general we expect shock-driven particle acceleration to have ceased (though the secondary hotspot may continue to be fed for some time if the jet is disconnected some way upstream: Cox et al. 1991). Synchrotron losses will then deplete the high-energy electrons in the secondary hotspot. If secondary hotspots continue to be fed by outflow from the primary hotspot, then there is still an energy supply and particle acceleration will continue to operate.
High-resolution X-ray observations of synchrotron radiation with Chandra have provided key insights into the particle acceleration in the jets of low-power, FRI-type radio galaxies, allowing us to locate the sites of particle acceleration and relate them to the dynamics of individual jets (e.g. Hardcastle et al., 2003). X-ray observations are vital in these cases because the synchrotron loss timescale for X-ray-emitting electrons is tens of years, assuming field strengths close to the equipartition values: thus, unlike radio and even optical observations of synchrotron radiation, X-ray synchrotron detections tell us where particle acceleration is happening now, rather than where it has happened in the past. To date, however, it has been difficult to use X-ray observations to study particle acceleration in the hotspots of the more powerful FRII radio sources, because of the importance in hotspots of a second emission process, inverse-Compton emission. This process, particularly important in bright, compact hotspots, traces the low-energy electrons rather than the high-energy ones, and has been the subject of much work with Chandra because of its potential to measure physical conditions (magnetic field strengths and energy densities) in hotspots (see, e.g., Harris et al., 2000; Hardcastle, Birkinshaw & Worrall, 2001; Brunetti et al., 2001). Some hotspots have been known since the ROSAT epoch to be best described by a synchrotron rather than inverse-Compton model (e.g. Harris, Leighly & Leahy, 1998) but until recently it has not been clear what controls the relative dominance of the two processes. Based on new and archival observations of a large sample of FRIIs, we recently showed (Hardcastle et al., 2004) that the controlling parameter is related to the overall luminosity of the hotspot: high-luminosity hotspots never show X-ray synchrotron emission, while low-luminosity hotspots often do. We argued that this is due to the higher magnetic field strengths and photon energy densities found in the more luminous hotspots: these increase the energy loss rate for high-energy electrons and prevent efficient particle acceleration to the energies needed for X-ray synchrotron radiation. In contrast, low-luminosity hotspots can readily accelerate particles to X-ray emitting energies, and the expected inverse-Compton emission is negligible, so that synchrotron radiation is dominant in these systems. It is important to note that this picture, while qualitatively plausible, relies on details of the microphysics, such as the magnetic field configuration and electron diffusion coefficient in the acceleration region (see, e.g., Brunetti et al., 2003) and so it cannot yet be shown quantitatively to be correct.
If this model is accepted, though, X-ray synchrotron emission can be used to probe high-energy particle acceleration in low-luminosity FRII radio galaxies. An example of this is provided by observations of the low-power FRII 3C 403 (Kraft et al., 2005). These observations were important for two reasons. Firstly, as 3C 403 is a narrow-line radio galaxy, any relativistic beaming effects (of the kind thought to be important in some core-dominated quasars) must be minimal if unified models are correct, as 3C 403 should lie close to the plane of the sky: thus, models for anomalous X-ray emission involving beaming, like those of Georganopoulos & Kazanas (2003), need not be considered. Secondly, 3C 403’s E lobe is a multiple-hotspot system, and the observations show a clear difference between features of the jet and the primary hotspot, on the one hand, and the secondary hotspot (much brighter in the radio), on the other: we found that the upper limit on the X-ray emission from the secondary was an order of magnitude below what would have been detected if its X-ray to radio ratio had been the same as that in the primary. This strongly suggests that, in this source at least, the secondary hotspot is unable to accelerate particles to the highest observable energies.
The results of our work on 3C 403 motivated us to carry out further observations of nearby sources with multiple hotspots, and to examine data available in the Chandra archive, with the aim of seeing whether, and in what circumstances, the different hotspot components can give rise to high-energy particle acceleration, and so constraining the nature of multiple hotspots. In this paper we report on our results.
Throughout the paper we use a cosmology with km s-1 Mpc-1, and . The spectral index is defined in the sense that flux density : the relationship between the spectral index and the photon index is thus .
2 Observations
2.1 Sample
We selected our targets from the sample of Leahy et al. (1997: hereafter L97). This sample consists of FRII radio galaxies with taken from the 3CR sample (Spinrad et al. 1985: see L97 for details of the selection). We chose this parent sample because of its low redshift (and therefore, in general, low luminosity, implying negligible X-ray inverse-Compton radiation from the hotspots in the picture of Hardcastle et al. 2004) and because of the availability of excellent radio data, with resolution matched to or exceeding that of Chandra, for almost all members of the sample. From the L97 sample, we selected the sources with clear, well separated, bright multiple hotspots as seen in the radio maps. Two of these, 3C 390.3 and 3C 403, had already been observed with Chandra (as discussed in Hardcastle & Croston 2005 and Kraft et al. 2005 respectively). We were awarded time for two more, 3C 227 and 3C 327, giving us two broad-line and two narrow-line radio galaxies in total. Basic properties of the sample objects are given in Table 1. We discuss the radio and X-ray data for these objects in the following two sections.
| Name | Emission-line | Angular scale | Largest hotspot | |||
|---|---|---|---|---|---|---|
| type | (W Hz-1 sr-1) | (kpc arcsec-1) | separation (kpc) | (cm-2) | ||
| 3C 227 | 0.0861 | BLRG | 1.61 | 17 | ||
| 3C 327 | 0.1039 | NLRG | 1.91 | 5 | ||
| 3C 390.3 | 0.0561 | BLRG | 1.09 | 28 | ||
| 3C 403 | 0.059 | NLRG | 1.14 | 4 |
2.2 Chandra observations
Details of the Chandra observations of our targets are given in Table 2.
All Chandra observations were taken with the ACIS-S array with the aimpoint, as standard, on the S3 chip. For 3C 403 and 3C 390.3 the nucleus was positioned near the aimpoint. However, for 3C 227 and 3C 327, our new targets, the (brighter) double hotspots were placed near the aimpoint. This had the effect that the sources spanned multiple Chandra chips. 3C 227 and 3C 327 were also observed in Very Faint (VF) mode to reduce the background levels, while 3C 390.3 and 3C 403 were observed in Faint (F) mode. The observations of 3C 227 were split into two segments for scheduling reasons.
| Source | Obs. ID | Date | Obs. time (ks) | Filtered livetime (ks) | Obs. mode |
|---|---|---|---|---|---|
| 3C 390.3 | 830 | 2000 Apr 17 | 36.2 | 29.4 | F |
| 3C 403 | 2968 | 2002 Dec 07 | 50.5 | 44.8 | F |
| 3C 227 | 7265 | 2006 Jan 11 | 21.8 | 21.8 | VF |
| 6842 | 2006 Jan 15 | 31.2 | 31.2 | VF | |
| 3C 327 | 6841 | 2006 Apr 26 | 40.2 | 40.2 | VF |
We did not re-analyse the data for 3C 403, as all the relevant measurements had already been made (Kraft et al., 2005). For the other three sources we re-processed the Chandra data with the latest versions of ciao and caldb at the time of writing (versions 3.3 and 3.2.3 respectively), following the standard ciao procedures. We removed the 0.5-pixel event position randomization (since high spatial resolution is important to us) and applied VF mode cleaning to the data for 3C 227 and 3C 327 to improve the background. Intervals of high background count rate were detected in the data for 3C 390.3 using the analyze_ltcrv.sl script, and we removed these by time filtering the data.
The subsequent data analysis was carried out in ciao and xspec. In what follows we present images in the 0.5–5.0 keV passband, and carry out spectroscopy in the 0.4–7.0 keV band, unless otherwise stated. The specextract script was used for spectral extraction for extended sources, and the psextract script for point sources. Spectral fits quoted for 3C 227 are the results of joint fitting to the data from both observations unless otherwise stated. All errors quoted are for one interesting parameter. The effects of the Galactic column density quoted in Table 1 are included in all X-ray spectral fits.
2.3 Radio data
We have access to electronic versions of the maps of these sources from Black et al. (1992) and Leahy et al. (1997). We made radio maps using archival data at other frequencies where the existing images were not adequate for our purposes. We also re-reduced the 8-GHz A-configuration data used by Black et al. for imaging of 3C 227, as the high-resolution maps available to us were sub-images that did not show the core. Details of the radio data we used are given in Table 3. All of the radio data was reduced in aips in the standard manner: individual datasets were first self-calibrated and then cross-calibrated and merged with appropriate weights to give a final multi-source dataset that was used for imaging. Where maps at more than one resolution were required, we applied appropriate tapering to the plane in the imaging process. Except where otherwise stated, maps used in the figures were made for this paper.
| Source | Frequency | VLA obs. id. | Configuration | Obs. date | Time on source |
|---|---|---|---|---|---|
| (GHz) | (h) | ||||
| 3C 227 | 8.3 | AB534 | A | 1990 May 25 | 3.0 |
| 1.5 | AS659 | A | 1999 Jul 10 | 1.1 | |
| 1.5 | AS677 | B | 2000 Jan 29 | 1.5 | |
| 1.5 | AZ28 | C | 1985 Sep 16 | 0.4 | |
| 3C 327 | 1.5 | AB376 | A | 1986 Mar 11 | 0.2 |
| 1.5 | AB376 | B | 1986 Aug 18 | 0.2 | |
| 1.5 | AP77 | C | 1984 Apr 23 | 0.4 | |
| 3C 390.3 | 5.0 | VP88G | B | 1989 Apr 17 | 10.4 |
| 5.0 | AS542 | C | 1994 Nov 27 | 0.9 |
As detailed comparison between the radio and X-ray spatial structures of the hotspots is important to us, we aligned the radio and X-ray frames for all the sources by shifting the X-ray nuclear position to match the best available radio position. Where there were significant offsets between the radio core positions at different frequencies, we shifted the low-frequency positions to match the high-frequency ones. We expect the relative astrometry of the radio and X-ray frames to be limited by the accuracy of X-ray centroiding, but in all cases it should be better than . 3C 390.3 is a special case, as extreme pileup has removed all counts from the center of the nuclear X-ray emission: we still believe that we have been able to determine the X-ray position to the required level of accuracy, and in this case the default astrometry of the Chandra data appears to be correct.
For radio data, resolutions are quoted as the major minor axis (FWHM) of the elliptical restoring Gaussian: where only one dimension is quoted the restoring beam used was constrained to be circular.
3 Results
3.1 Non-hotspot X-rays in 3C 227 and 3C 327
In this subsection we briefly comment on the features of the new Chandra observations of 3C 227 and 3C 327 unrelated to the hotspots. The Chandra observations of the other sample sources have been discussed elsewhere (see Kraft et al., 2005; Hardcastle et al., 2004; Hardcastle & Croston, 2005; Evans et al., 2006).
3.1.1 Cores
The raw Chandra count rate from the core of the BLRG 3C 227 is roughly 0.14 s-1: with a frame time of 3.1 s, this means that we might expect it to be affected by pileup at a significant level111http://cxc.harvard.edu/proposer/POG/html/ACIS.html. Fitting to the total spectrum of the nucleus within 15 Chandra pixels (7 arcsec), using a concentric adjacent background annulus, we found a good fit ( for 213 d.o.f.) to a model consisting of two power laws, one with Galactic absorption only and one with additional intrinsic absorption at the redshift of the source. The power-law component without intrinsic absorption had a steep best-fitting photon index () while the absorbed component, with cm-2, had a very flat photon index, . The data are almost equally well fitted () with an ionized absorber model (absori) but this has clear residuals at soft energies, suggesting that in any event some of the soft X-ray emission must come from a second nuclear X-ray component, or from soft thermal X-ray emission close to the nucleus. This is unsurprising as we know that in general radio-loud AGN have a soft X-ray component which is probably related to the jet (e.g., Hardcastle, Evans & Croston, 2006). The significant intrinsic absorption seen here, although unusual for a broad-line object, is consistent with what is seen in some other BLRG or quasars (e.g. 3C 109, Allen et al. 1997, Hardcastle et al. 2006; 3C 351, Nicastro et al. 1999, Hardcastle et al. 2002). From optical spectropolarimetry Cohen et al. (1999) estimate that the optical broad lines and continuum may be obscured by 1-2 magnitudes in the band. Although our column density would imply substantially higher extinction, for Galactic gas/dust ratios, the optical results, including the detection of polarized broad emission lines, give us some additional reason for believing that there might be intrinsic X-ray absorption in this source.
The very flat photon index of the absorbed component is likely to be partly the result of pileup, and to investigate this we also extracted a spectrum for an annular region between 2 and 15 Chandra pixels, with the same background region. This excludes the region where pileup is likely to be significant. We applied energy-dependent corrections to the ARF using the algorithm of the arfcorr software222http://agyo.rikkyo.ac.jp/tsujimot/arfcorr.html implemented using the funtools package. Fitting the same double power-law spectrum, we find similar parameters — the slightly larger intrinsic absorbing column ( cm-2) is consistent within the errors — and only a slightly steeper photon index for the absorbed component, . However, the 99% confidence upper limit on the photon index in this extraction region (which obviously contains only a small fraction of the total counts) is 2.4, so more typical photon indices are certainly not excluded by the non-piled up data.
Crawford & Fabian (1995), who discuss observations of 3C 227 with the ROSAT PSPC , found that the nuclear spectrum was well fitted by a power-law model with . With the limited signal to noise of their ROSAT data and the restricted energy range of the PSPC it is not clear that they could have identified the absorption features seen in our spectrum.
For 3C 327, which has a much fainter X-ray nucleus, we extracted a spectrum from a source circle of radius 4 Chandra pixels (2 arcsec) with an adjacent concentric background annulus. The best-fitting spectrum ( for 21 d.o.f.) again requires multiple components: at soft energies the source is dominated by an unabsorbed power law with , while the residuals at high energy require an additional heavily absorbed power law, with the poorly constrained fixed at 1.7 (following Hardcastle et al., 2006) and cm-2, together with a strong line-like feature modeled as a Gaussian with keV and keV. Except for the steep power law index for the unabsorbed component, this is a typical spectrum for a narrow-line radio galaxy: iron features around 6.4 keV are often found in these objects (Sambruna, Eracleous & Mushotzky 1999; Evans et al. 2006; Hardcastle et al. 2006).
3.1.2 Lobes
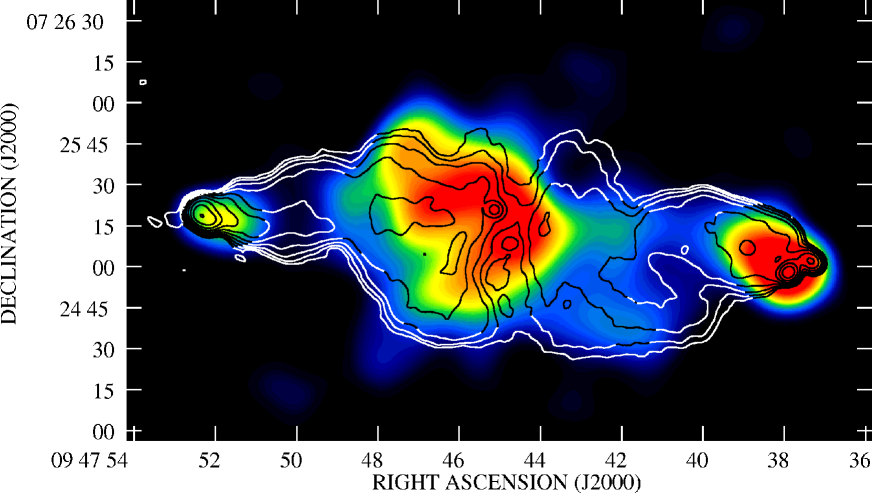
The lobes of 3C 227 are both clearly detected in the Chandra observations (Fig. 1). Extended X-ray emission from lobes of radio sources is generally attributed to inverse-Compton scattering from the microwave background radiation (CMB) (Hardcastle et al., 2002; Kataoka & Stawarz, 2005; Croston et al., 2005). We extracted a spectrum for the W lobe, as the E lobe spans a chip boundary, using a polygonal extraction region defined by the radio emission but excluding the central part of the lobe where the nucleus and central extended X-ray emission might contribute, as well as compact sources, including the hotspots. The spectrum was well fitted ( for 10 d.o.f.) with a power-law model with and 1-keV unabsorbed flux density of nJy. We used the code of Hardcastle, Birkinshaw & Worrall (1998) to calculate the predicted inverse-Compton emission from the whole lobe, modeling the lobe crudely as a uniform cylinder with length and radius , assuming equipartition, and using the same electron spectral assumptions as Croston et al. (2005), with a low-energy electron energy index (‘injection index’), , of 2. The equipartition magnetic field strength is 0.58 nT; the predicted emission corresponds to a 1-keV flux density of 1.4 nJy, i.e. about a factor 3.5 below what is observed. Reducing the field strength to 0.29 nT is required to produce all the observed X-ray emission by the inverse-Compton process.
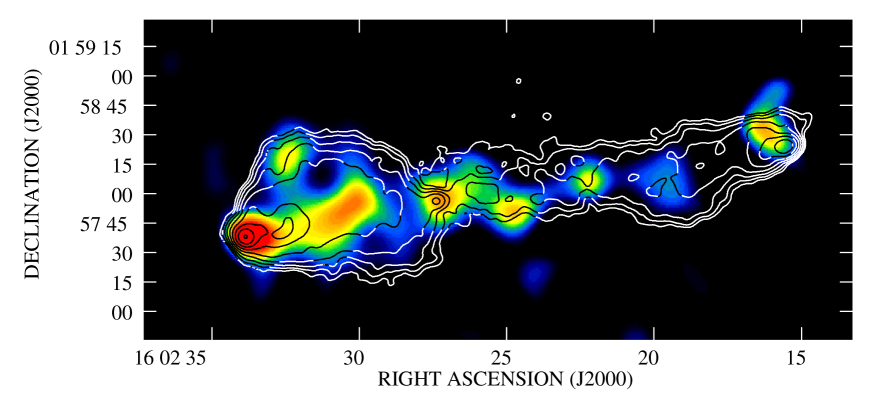
For 3C 327 there is a clear detection of the E lobe and a weaker but still significant detection of the W lobe. Again, we extracted a spectrum for the lobe that does not span a chip boundary, in this case the E lobe, excluding point sources and the components near the hotspots. This was well fitted ( for 6 d.o.f.) with a power-law model with and unabsorbed 1-keV flux density of nJy. The inverse-Compton prediction here on the same assumptions (modeling the lobe as a cylinder with length and radius ) is 1.5 nJy, so again the observations exceed the equipartition prediction by a factor . The equipartition field here is 0.73 nT and the field required to produce the observed X-rays by inverse-Compton processes is 0.34 nT.
Both objects are thus consistent with the trend seen in many other sources for the observed inverse-Compton emission to lie somewhat above the equipartition, prediction (Croston et al., 2005). We know that 3C 227’s lobes are likely to make a relatively small angle to the line of sight, but this makes only a small difference to the inverse-Compton prediction for .
4 Hotspot observations
In this section we discuss the X-ray, radio and (where possible) optical properties of the hotspots in our target systems. Table 4 gives a summary of the properties discussed below for ease of reference.
| Source | Lobe | X-ray | Radio | Offset | Counts | Photon | 1-keV flux | Optical? | Type | Morphology |
|---|---|---|---|---|---|---|---|---|---|---|
| name | name | name | (0.5-5.0 keV) | index | density (nJy) | |||||
| 3C 227 | W | – | P1/2 | Y | Primary | Resolved, flattened | ||||
| – | P3 | 1.63 | Y | Secondary | Resolved | |||||
| – | P4 | 1.63 | N | Jet knot? | Slightly resolved | |||||
| E | – | F1 | 1.63 | Y | Primary | Compact + diffuse | ||||
| 3C 327 | E | SX1 | S1? | 1.7 | ? | Primary | Compact | |||
| SX2 | S2? | 1.7 | ? | Secondary | Compact | |||||
| 3C 390.3 | N | NX1 | B | Y | Primary | 2 sub-components | ||||
| NX2 | – | – | Y | ? | Point-like | |||||
| – | F | – | 1.95 | N | Secondary | No X-ray detection | ||||
| S | SX1 | G′ | 1.4 | N? | Primary? | Compact | ||||
| S | Diffuse | G,E,D? | – | Y? | Secondary | Diffuse | ||||
| 3C 403 | E | – | F1 | – | Y | Primary | Resolved | |||
| – | F1b | – | 2.0 | N | Jet knot? | Compact | ||||
| – | F2 | – | 2.0 | N | Secondary | No X-ray detection | ||||
| – | F6 | – | Y | Jet knot | Elongated |
Note. — Column 3 gives the name we have associated with the X-ray feature. Where none is given no specific name has been assigned in the text. Column 5 gives the offset between the peak of the radio counterpart named in column 4 and the centroid of the X-ray emission: it is blank if no radio counterpart is known. The photon index in column 7 is derived from the data if an error is quoted and is the value assumed in the text otherwise. Column 8 is the 1-keV flux density, determined from the spectral fit if possible, and otherwise from the count rate using the spectral assumption specified in column 7. Column 8 describes the nature of the radio hotspot, if known. Column 9 indicates whether there is an optical counterpart to the hotspot: Y = yes, N = no, ? = not known. Column 10 describes the X-ray structure: ‘compact’ here indicates a weak source which is consistent with being in extent, and may be point-like. Measured parameters for 3C 403 are taken from Kraft et al. (2005): as no significant offsets are described in that paper no values are tabulated here.
4.1 3C 227
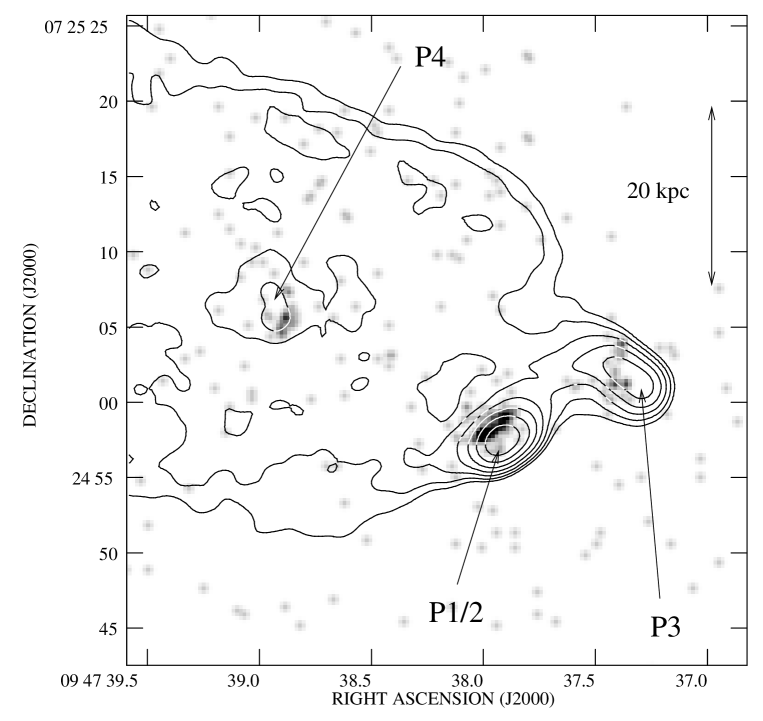
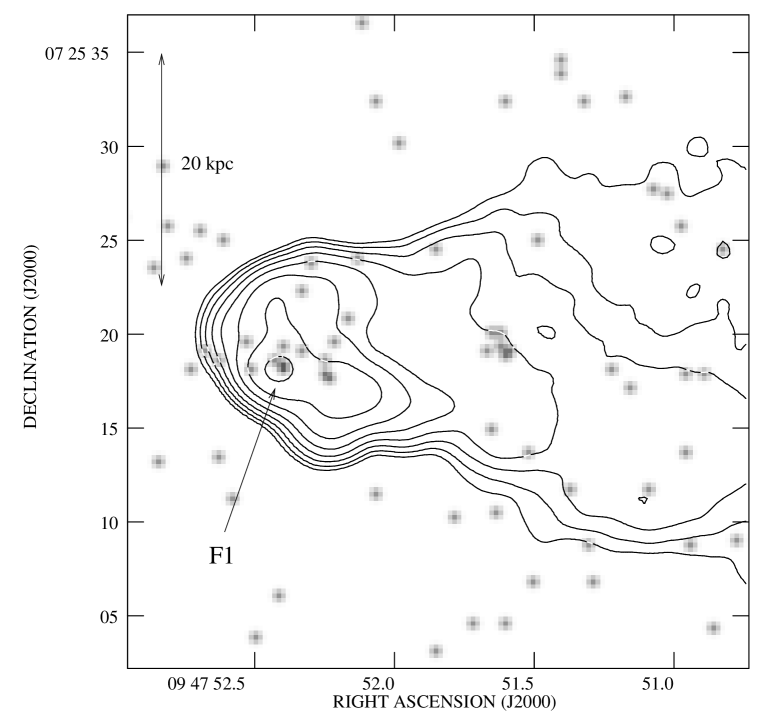
Optical counterparts of 3C 227’s hotspots have recently been discovered using ground-based observations (Brunetti et al., 2003; Mack, Prieto & Brunetti, 2003). The two components of the double W hotspot and the more compact E hotspot all emit in the near-infrared. In the X-ray, similarly, emission is detected from both hotspot regions, as shown in Figs 3 and 4. In the W hotspot X-ray emission is clearly detected from the three compact components P1/2, P3 and P4, while there is weak emission not just from the compact E component F1 but also from the region around it. In the standard multiple hotspot picture P4 would probably be designated a jet knot (cf knot F6 of 3C 403, below), P1/2 would be the primary hotspot and P3 a secondary hotspot. Thus 3C 227 is an example of a system where the secondary hotspot clearly is an X-ray source. What is most striking in the W hotspot region is the offsets between the peak of the radio and the peak of the X-ray in the X-ray detected components. This is most clearly seen in Fig. 5, where the X-ray emission is compared with the high-resolution radio data used by (Black et al., 1992). At this resolution the brightest hotspot is resolved into two components (P1 and P2), and both of these are associated with some X-ray emission, but the brightest X-ray emission comes from a resolved structure which is comparable in size to P2 (with a long axis of or 5 kpc) and the X-ray centroid of this structure is displaced (1.3 kpc) in the direction of the nucleus from the peak of P1. The centroid of the X-ray emission from P3 is displaced by (3.6 kpc) from the peak of the radio emisission in the direction of P1/2. Finally, the X-ray emission from P4 appears slightly displaced () from the peak of the radio in the direction of P1/2, but the statistics are not good enough to claim a definite offset. In contrast, the centroid of the emission from F1 and its surroundings is consistent with the position of the radio peak within the large errors.
The X-ray counterpart of P1/2 contained enough counts ( in the 0.5–5.0 keV energy range) for us to extract a spectrum, which we took from a circular region with radius 6 Chandra pixels (3 arcsec) with background from a concentric annular region. We find a good fit ( for 3 d.o.f.) with a power-law model with and 1-keV unabsorbed flux density nJy. The fainter hotspots P3 and P4 contain and net 0.5–5.0 keV counts respectively, which for the same spectrum would correspond to flux densities of and nJy. The counterpart of the F1 hotspot, which lies on the S1 chip, contains counts in a similarly sized extraction region, which corresponds to nJy if again we assume the same spectrum as seen in P1/2.
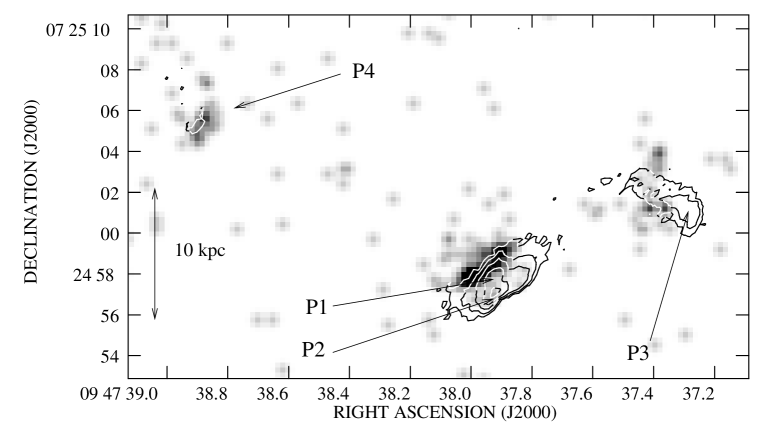
K.-H. Mack kindly provided us with electronic versions of ground-based near-infrared (NIR) images (Mack et al. 2003, and in preparation). When shifted to our radio-based co-ordinate system by alignment at the peak of the optical emission from the galaxy these show that the optical emission from the P1/2 region extends over both the radio and X-ray peaks. In detail, though, the brightest regions of NIR emission are not coincident with either radio or X-ray peaks. The NIR emission disappears in between the peak of the X-ray and the peak of the radio emission at P2. Similarly, the peak of the NIR emission coincident with P3 agrees neither with the radio nor the X-ray peak positions, though it is roughly coincident with the X-ray centroid. There is no NIR counterpart of the radio/X-ray knot P4.
4.2 3C 327
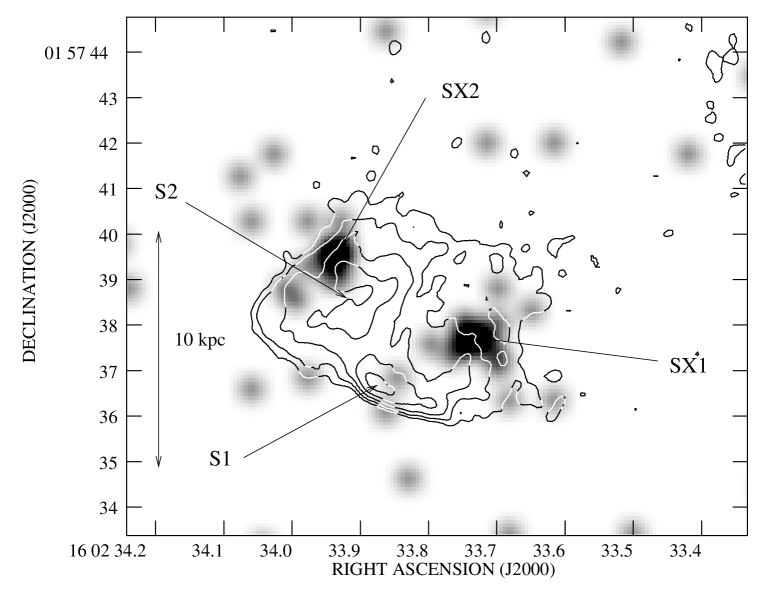
3C 327 is the only object in our sample to have no optical hotspot detection: as pointed out by Mack et al. (2003), a nearby bright disk galaxy makes it hard to detect potentially faint counterparts to the bright double eastern radio hotspots. In the new Chandra data, although there is nearby X-ray emission (Fig. 2) there is no detection of a compact component corresponding to the W hotspot. There is, however, a clear detection of compact components near the double E hotspots (Fig. 6). Neither of the two X-ray components detected bears a very obvious relation to the radio structure. The component (denoted SX1) closest to the primary hotspot (S1) is separated from it by (4.5 kpc) along the line connecting S1 and the core, while the other X-ray component (SX2) is at (1.5 kpc) from the nearest peak of the radio emission in the S2 region, and considerably further from its center, in the sense of being further away from the primary hotspot than the peak of the radio emission. In DSS2 and 2MASS images SX2 is close to the nearby disk galaxy, but not at its nucleus. We cannot rule out the possibility that SX2 is associated with this galaxy rather than with the 3C 327 hotspot system. SX1 is further away from the galaxy than SX2.
The two compact X-ray components each contain net 0.5–5.0 keV counts so that spectral fitting is not possible. If we assume a power-law spectrum with , the observed net counts correspond to flux densities of nJy in each component. We estimated the hardness ratios of the two components (defining the soft band as 0.5-2.0 keV and the hard band as 2.0-5.0 keV) and compared them to the hardness ratio expected for a power law with Galactic absorption (this model was chosen because the spectral index is unlikely to be flatter than ). We found that SX2 is significantly harder (at the 99% confidence level on a binomial test) than would be expected for such a model, while SX1 is not inconsistent with it. This suggests either that SX2 is not related to the hotspot (e.g. that it is a background type 2 AGN) or that there is some additional source of absorption, conceivably in the disk galaxy, that affects SX2 but not SX1. We cannot distinguish between these models with the available data.
4.3 3C 390.3
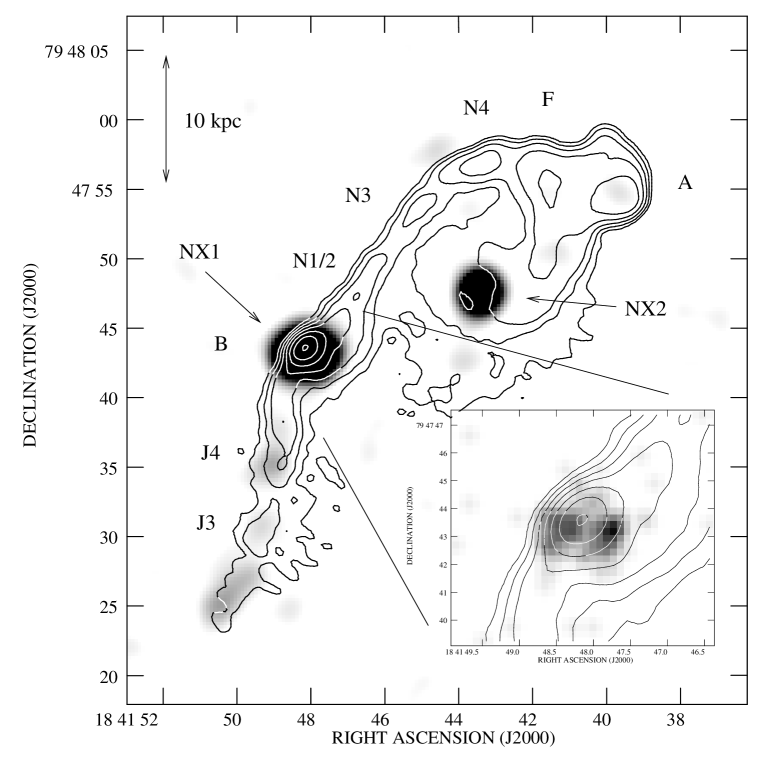
The northern compact hotspot of 3C 390 is a well-known X-ray source (Prieto, 1997; Harris et al., 1998; Hardcastle et al., 2004). Diffuse X-ray emission from the large hotspot region of the S lobe was discussed by Hardcastle & Croston (2005). A detailed examination of the Chandra data shows that several components of the N hotspot complex are X-ray sources (Fig. 7). The radio jet, which is detectable throughout the N lobe (Leahy & Perley, 1995) brightens strongly in the area shown by our image, and there is faint but clear X-ray emission associated with this section of the jet. The strongest X-ray ‘source’ is the known X-ray counterpart of the primary hotspot (Leahy & Perley, 1995), knot B, here denoted NX1. The centroid of this region is only slightly (, 0.4 kpc) offset to the S of the peak of the radio emission, but the resolution of Chandra shows that the X-ray feature is actually resolved into two components, separated by 1.5 arcsec (1.6 kpc) and placed symmetrically on either side of the radio peak. This is a much smaller distance than that of the nearby galaxy, possibly interacting with the jet, described by Harris et al. (1998), which is to the NE. At higher radio resolutions (e.g., in Figure 5 of Leahy & Perley 1995) knot B is resolved into a linear structure which lies between the two X-ray peaks – there is no sign of any double structure in the radio. Nor is there any evidence in the optical image of Prieto & Kotilainen (1997) or in the archival Spitzer data for resolution of the hotspot in the E-W direction: Prieto & Kotilainen show that the optical hotspot is in fact extended in the same direction as the radio. Another bright X-ray source in the hotspot region is the object we denote NX2. This has no radio counterpart and is well separated from any compact structure in the radio, so it seems most likely to be a chance superposition with a background object, although it is detected in the optical and infrared and its properties at these wavelengths are consistent with it being similar to knot B (its infrared colors mean that it is certainly not a background normal galaxy). Radial profile analysis shows that it is consistent with being a point source. Finally, the secondary hotspot (knots F and A) shows no significant X-ray emission, even though in 3C 390.3 there is clear evidence (in the form of the continued collimated outflow from knot B, features N1–4 in Fig. 7) that this hotspot is connected to the jet. The radio/X-ray ratio in the secondary hotspot region is a factor greater than in knot B. There is no optical detection of the secondary (Prieto & Kotilainen, 1997), nor is it detected in the archival Spitzer data. We extracted spectra for the jet, for the counterpart to knot B (NX1) as a whole, for its two subcomponents (denoted NX1E and NX1W) and for the possibly unrelated source NX2, taking background from a nearby blank-sky region. The overall spectrum of NX1 is not particularly well fitted with a single power-law model (; ). The E component of the X-ray source is well fitted with a power-law model (, ) but the W component is not (, ), the poor fit being the result of one high bin at soft energies. Neither component is acceptably fitted with a thermal model. Within the limited statistics, it seems likely that the two components of knot B have significantly different X-ray spectra. The total 1-keV unabsorbed flux density of knot B in our extraction is nJy, with the two sub-components being roughly equal in flux. The few counts in the jet are well fitted () with a power-law model with , and a flux density nJy. Finally, NX2 is well fitted () with a power-law model with — comparable to the spectral indices of NX1 or its components — and has a 1-keV flux density of nJy.
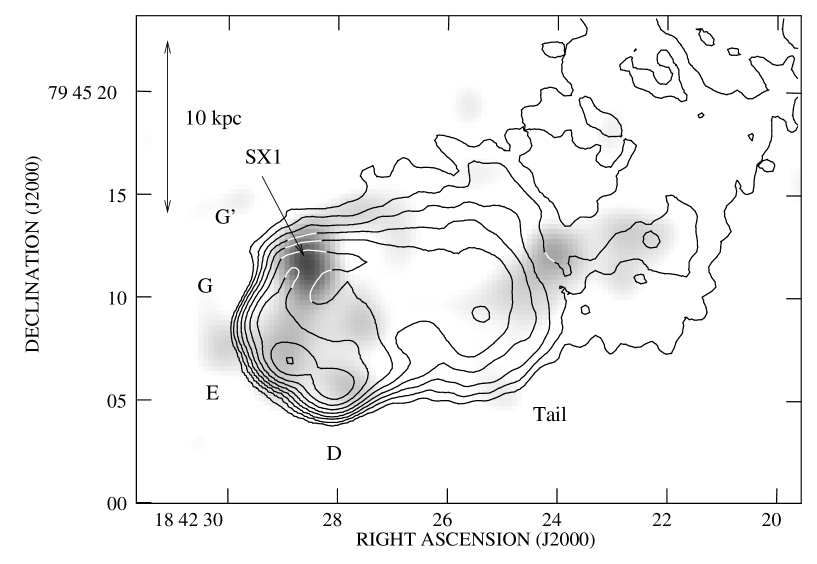
Fig. 8 shows the X-ray emission from the southern hotspot. The brighest compact feature, denoted SX1 in the figure, is not coincident with any named radio feature, but appears at the N end of the bright ‘rim’ of the hotspot discussed by Leahy & Perley (1995). The nearest discrete compact feature, further around the rim, is a weak radio knot (which we denote G′) visible in the high-resolution radio map of Leahy & Perley (1995). This feature may be considered the primary hotspot or may just be a jet knot. Otherwise there is no particular association between the detected X-ray emission and the radio: none of the bright knots G, E, D clearly has a compact associated X-ray source, though all have X-ray emission coincident with them, and the X-rays from the ‘tail’ region bear no relation to the radio structure seen here. Archival Spitzer images show that the S hotspot has a 24-m infrared counterpart, which appears to be peaked where the radio is brightest (i.e. in hotspots E and D), but the low resolution of Spitzer at this wavelength prevents us from examining this in detail. Taking a single spectrum of all the detectable X-ray structure in Fig. 8, we find it to be poorly fitted () with a single power law with and a total 1-keV flux density of nJy. The poor fit probably indicates that more than one spectral component is present, but there are too few counts to try to separate these spatially. Using the parameters of this fit, the compact component SX1 would have a flux density nJy.
4.4 3C 403
The hotspots of 3C 403 were discussed extensively by Kraft et al. (2005), and so we do not present images or spectral fits here. To summarize the results that are most important for this paper, the hotspots F1 and F6 in the E lobe have clear X-ray detections, with measured photon indices . F6 may be a jet knot, consistent with the detection of jet-related X-ray emission in the same lobe, and if so F1 is the primary hotspot. The peaks of the X-ray emission from F1 and F6 are clearly coincident with the peaks in the radio, unlike several of the other hotspots considered in this paper, but both have X-ray extensions back towards the nucleus that are not present (or at least not nearly as prominent) in the radio. There is no detection of the radio-bright secondary hotspots F2 and F3 and there is no diffuse X-ray emission from the hotspot region.
5 Discussion
5.1 Offsets and emission mechanisms
The observations of 3C 227, 327 and 390.3 almost all show differences between the structure observed in the radio and that observed in the X-ray. To summarize, the only ‘simple’ hotspots seen in these three objects are the weak compact components in the E hotspot of 3C 227 and (probably) the S hotspot of 3C 390.3, SX1. 3C 227 shows a striking 1.5-kpc offset between the radio emission from the primary W hotspot and its X-ray counterpart, in the sense that the X-ray emission is nearer the nucleus, while having similar structure in the radio and X-ray. The well-known counterpart to 3C 390.3’s hotspot B turns out to have two components, neither of which is coincident with the radio or optical detection, and which are displaced from it in a direction perpendicular to the jet axis. Neither of the two features most obviously related to the E hotspots of 3C 327 is coincident with the peak of the radio: one is 4 kpc along the jet axis from the primary hotspot, the other at least 1 kpc away from the secondary along the primary-secondary axis.
What physical processes can account for these diverse behaviors? One possibility is of course that the compact components are nothing to do with the radio sources. This is our preferred explanation for the compact feature NX2 in 3C 390.3 N (§8): it may also explain one or, at a stretch, both of the features we see in 3C 327 E, where we have no deep optical information to constrain whether a background object could be responsible. It seems very unlikely that it could account for the observations of 3C 390.3 NX1 or 3C 227, where the X-ray features are clearly resolved. We therefore consider the possible emission processes that could be responsible for producing the observed X-rays from the sources themselves. As the available X-ray data suggest power-law spectra and thus non-thermal emission, we focus on inverse-Compton and synchrotron processes.
As discussed by Hardcastle et al. (2002) in the context of the more distant double-hotspot source 3C 351 (where inverse-Compton emission almost certainly plays some role in the complex X-ray structures seen), synchrotron self-Compton emission (SSC) or inverse-Compton scattering of the CMB (CMBIC) cannot produce offsets between the radio and X-ray unless there is very strong spatial variation in the positions of the low-energy electrons and/or important beaming effects. We first consider a model in which there are strong point-to-point variations in the number density of low-energy electrons. To produce offset X-ray emission via inverse-Compton processes, we require a large population of low-energy () electrons at the location of the X-ray emission, while either the electron spectrum or the magnetic field strength must be tuned so as to avoid significant emission from this population of electrons at radio frequencies. We used the code of Hardcastle et al. (2002) to calculate the expected inverse-Compton emission from components matching P1, P2 and the X-ray source in 3C 227, using an upper limit on the radio flux density of the X-ray component of 2 mJy to normalize the radio spectrum and using the observed sizes in the radio and X-ray to choose component sizes. We modeled the three components for simplicity as uniformly filled ellipsoids in the plane of the sky. We found that for standard broken power-law spectra for the three components we require the X-ray source to have a departure from equipartition of a factor in magnetic field strength, and an electron energy density that is times greater than that in P2, in order to produce the observed X-rays by inverse-Compton processes (where the upper limits come from the fact that we have no unambiguous detection of a radio counterpart of the X-ray source). In this situation we find that the dominant photon field is the CMB, and so the conclusions are robust against uncertainties in the geometry, which affect only the number density of synchrotron photons from P1/2. Such an electron distribution seems highly unlikely simply on energetic grounds, since it requires essentially all the energy in the hotspot to be concentrated in an offset, radio-invisible region. A similarly implausible electron distribution would be required for 3C 327 and 3C 390.3. In addition, we show in Table 5 that the parameters of all detected and non-detected hotspots predict inverse-Compton flux densities (derived using the code of Hardcastle et al. 1998) for equipartition magnetic fields that are much less than the observed values or limits, as was shown previously in some cases by Hardcastle et al. (2004). We therefore rule out simple inverse-Compton models in what follows.
| Source | Lobe | Radio | Size | Radio frequency | Radio flux | 1-keV flux | Predicted IC flux | X-ray/radio | Notes |
|---|---|---|---|---|---|---|---|---|---|
| name | (arcsec) | (GHz) | (mJy) | (nJy) | (nJy) | () | |||
| 3C 227 | W | P1 | 8.35 | 16 | 0.0010 | 0.09 | Offset X-ray | ||
| P2 | 8.35 | 25 | 0.0019 | 0.06 | Offset X-ray | ||||
| P3 | 8.35 | 13 | 0.0014 | 0.02 | Offset X-ray | ||||
| P4 | 8.35 | 1.2 | 0.3 | Jet knot? | |||||
| E | F1 | 8.35 | 5.3 | 0.06 | |||||
| 3C 327 | E | S1 | 8.35 | 15 | 0.02 | Offset X-ray | |||
| S2 | 0.32 | 8.35 | 3.2 | 0.09 | Offset X-ray | ||||
| 3C 390.3 | N | B | 4.99 | 66 | 0.003 | 0.08 | 2 sub-components | ||
| F | 3.7 | 4.99 | 190 | 0.009 | Upper limit | ||||
| S | G′ | 0.5 | 4.99 | 20 | 0.02 | Offset X-ray | |||
| S | G | 0.5 | 4.99 | 36 | 0.0013 | Upper limit | |||
| S | E | 0.7 | 4.99 | 106 | 0.0056 | Upper limit | |||
| S | D | 1.2 | 4.99 | 206 | 0.011 | Upper limit | |||
| 3C 403 | E | F1 | 0.275 | 8.35 | 16 | 0.04 | |||
| F1b | 0.256 | 8.35 | 7.7 | 0.06 | Jet knot? | ||||
| F2 | 8.35 | 27 | 0.0011 | Upper limit | |||||
| F6 | 0.272 | 8.35 | 27 | 0.0014 | 0.06 | Jet knot |
Note. — Columns 1, 2 and 3 are as in Table 4. Column 4 gives the size used in modeling, derived from fits to the high-resolution radio data. The angular sizes used are the radii of homogenous sphere models fitted to the data, as described by Hardcastle et al. (2004), except where two numbers are quoted, in which case they are the length and radius of a cylinder. Columns 5 and 6 give the frequency and flux of the radio data used to normalize the inverse-Compton models. Column 7 is the 1-keV X-ray flux density of the X-ray counterpart, where present, taken from or derived as in Table 4. Column 8 gives the 1-keV inverse-Compton prediction (SSC+CMBIC). Column 9 gives the ratio of the X-ray and radio flux densities, corrected to 8.35 GHz assuming . Column 10 gives any comments on the relationship between the X-ray flux quoted and the radio hotspot for which the inverse-Compton calculation was made. Data for 3C 403 are taken from Kraft et al. (2005).
Georganopoulos & Kazanas (2003) (hereafter GK03) proposed to explain the X-ray properties of hotspots in objects aligned close to the line of sight using a model involving emission from the decelerating relativistic jet. At the time they were writing, there was an apparent correlation between observations of hotspots with X-ray emission too bright to be SSC in origin and the jet side of broad-line objects, such as broad-line radio galaxies and radio-loud quasars, that are expected to lie at small angles to the line of sight in unified models. Since then, further observations have established that these non-SSC hotspots can occur in objects in all orientations (Hardcastle et al., 2004). However, the GK03 model is still interesting because it predicts spatial offsets between the peak of the X-ray and that of the radio. They proposed that the jet decelerates on kpc scales and that X-ray emission from the fast-moving component can be produced by inverse-Compton scattering of the synchrotron photons from the slower, downstream component. This external inverse-Compton process is strongly directional and can only be seen if the jet is aligned close to the line of sight (and, of course, is approaching rather than receding). The GK03 model should not be confused with the process of inverse-Compton scattering of the CMB that has been proposed to explain the X-ray jets in core-dominated quasars (e.g., Tavecchio et al., 2000): in the GK03 model the photon energy density is dominated by synchrotron photons from the upstream hotspot, and as a consequence the beaming factors required (for given jet properties) are less extreme and the range of plausible angles to the line of sight can be greater. In the beamed CMB models the X-ray emission should have no particular relationship to the radio hotspot, and the angle to the line of sight of the jet is required to be small: we therefore do not consider these models further.
The GK03 model might be applied to the offset between the primary hotspot of 3C 227, P1/2, and its X-ray counterpart. 3C 227 is a broad-line object, so that the lobes make a relatively small angle to the line of sight () and, if we take P4 to be a jet knot, the only evidence that we have suggests that the W lobe is likely to contain the jet pointing towards us, though the comparatively weak radio core, the non-detection of any other components of the jet, and the presence of intrinsic absorption in the X-ray spectrum (§2) suggest that it is not at a very small angle to the line of sight (compared to, say, 3C 390.3, with its bright radio core, unabsorbed nuclear X-ray emission and well-detected kpc-scale jet). The flat X-ray spectrum of the X-ray counterpart of P1/2 is consistent with an inverse-Compton model. If we suppose that the jet decelerates on scales of a few kpc (set by the observed projected size of the offset between radio and X-ray) from relativistic to sub-relativistic speeds, is it possible that the GK03 model could explain the observed offset in 3C 227? In principle the answer is ‘yes’ since the GK03 model can explain any observation with a suitable choice of the (observationally unconstrained) parameters of the position-dependent bulk flow speed and electron energy spectrum of the jet. The jet would have to be quite wide at the position of P1/2 to produce the observed X-ray morphology, but not impossibly so: the distribution of emitting particles and jet velocities would also require some fine tuning in order to produce an offset X-ray peak rather than some more jet-like X-ray structure. However, we consider an explanation in terms of the GK03 model to be hard to sustain when all the observations of our sample are considered together. The secondary hotspot of 3C 227 shows a similar offset, yet the bulk flow clearly cannot decelerate to sub-relativistic speeds twice — and the direction of any flow between the primary and secondary is not the same as the direction between P4 and P1/2. A series of coincidences is required to explain the similarity between the primary and secondary hotspots in 3C 227, therefore. The model clearly cannot explain the offsets between radio and X-ray peaks in 3C 390.3 (not in the direction of the jet) or the offsets and variations in radio/X-ray ratio seen in 3C 327 and 3C 403 (too large an angle to the line of sight). We conclude that the GK03 model, while not ruled out by the data for the primary hotspot of 3C 227, is of little use in providing a general explanation of the problems posed by our observations.
Since inverse-Compton explanations seem difficult to accept, we next consider synchrotron emission. Synchrotron explanations also require point-to-point electron spectrum (or possibly magnetic field strength) variations to account for offsets between the radio and X-ray emission. However, the magnitude of the variation is comparatively very small: the high-energy tail of the electron population responsible for the X-ray emission is energetically, and a fortiori numerically, a negligible fraction of the total, whereas for the inverse-Compton process a doubling of the emissivity by adjusting the electron spectrum requires a doubling of the number density of low-energy electrons, and so effectively a doubling of the energy density of the system. Energetically, therefore, it is not difficult to produce what we see via synchrotron radiation. Since the electron energy loss timescale is likely to be very short (for field strengths close to the equipartition value) what is required to produce the observed X-ray structures is some process that can accelerate particles wherever we observe X-ray emission. As we discussed in §1, there is strong evidence from radio and optical data that hotspots are sites of particle acceleration, and their spectra are consistent with models involving a single shock followed by downstream losses. In some cases the X-ray emission from hotspots lies on an extrapolation of these models (Kraft et al., 2005). But observations of diffuse X-ray emission, often poorly matched to the observed radio structures (e.g. in Pictor A, Hardcastle & Croston 2005; 3C 33, Kraft et al. 2007; 3C 390.3 S, this paper) make it hard to sustain a model in which the particle acceleration at the hotspots is only occurring at jet termination shocks. Similar conclusions have been reached by other authors based on optical data (e.g., Röser & Meisenheimer, 1987; Prieto et al., 2002).
Observations of compact but offset X-ray emission, as in 3C 227, present a different problem. Here it seems possible that there is a discrete acceleration region that is related to the jet termination shock, but, if so, the shock is not where we would have inferred it to be from radio observations. For 3C 227 we could imagine a picture in which the X-ray emission in both primary and secondary hotspots tells us where the shock is now, while the radio traces material that has passed through this shock region, expanded and decelerated. This would imply that the X-ray emission should have a radio/optical counterpart, but for a flat synchrotron spectrum () extending between radio and X-ray the emission at other wavebands could be undetectably faint, at the 10 Jy level in the radio (i.e., substantially below the upper limit of mJy on the flux density of this component from radio maps). Such a flat synchrotron spectrum extending all the way to the X-ray has never been observed (precisely because of the difficulty of detecting the radio counterparts) but might be expected in models of shock acceleration. The bulk of the optical emission in 3C 227 P1/2 seems to lie in between the X-ray and radio peaks, which is qualitatively consistent with this picture. The questions to be asked are then why other hotspots seen with similar spatial resolution, such as those in 3C 403, do not show the same radio/X-ray offsets; why the offsets in 3C 327, if they have the same origin, are so much larger; and what the origin is of the compact structure transverse to the jet direction in the hotspot of 3C 390.3.
Recent numerical simulations suggest that the picture of particle acceleration in the lobes of FRII sources may be less simple than in the traditional model of acceleration at strong shocks in one or more hotspots. Tregillis, Jones & Ryu (2001) carried out three-dimensional MHD simulations that modeled the transport of relativistic electrons and of particle acceleration at shocks. They found that the interaction of the jet and the backflowing plasma at the head of the jet produced what they called a ‘shock-web complex’, “a region of shocks of varying strengths and sizes spread throughout the source”. Even when there was a simple terminal shock, not all the jet material necessarily passed through it, and the terminal shock was not always the strongest shock in the system. While it is not clear that their simulations are perfectly matched to real radio sources, they are capable of producing simulated synchrotron images that show apparent clear discrete multiple hotspots (Tregillis et al., 2002) and in these cases the particle acceleration is not necessarily well matched to the locations of the hotspots: hotspot locations in their model can have more to do with magnetic field amplification than with particle acceleration. The notion of a ‘shock-web complex’ at the head of the jet could help to explain the diffuse X-ray emission now seen in the radio-bright but non-compact source head regions of a number of objects, as discussed above, while the idea that the particle acceleration region may not always be co-spatial with the observed radio hotspot might help to explain observed offsets. It should be possible to carry out numerical simulations that allow synthetic maps of the location of high-energy synchrotron-emitting particles to be generated for qualitative comparison with the range of structures seen in X-ray observations.
We can also compare the X-ray observations of hotspots with observations of systems in which the X-ray emission is almost certain to be synchrotron in origin, the FRI jets (§1). In the nearest FRI jet, Centaurus A (Hardcastle et al., 2003) there is direct dynamical evidence for shock-acceleration of particles, as we believe is going on in FRII hotspots. There are also offsets, albeit on scales of only tens of pc rather than kpc, between the peak of the X-ray emission and the brightest radio emission, in the sense that the radio emission peaks downstream of the X-ray. And there is diffuse X-ray emission, not associated with any compact radio source or dynamical feature of the jet, which in some cases has a diffuse optical counterpart (Hardcastle et al., 2006). Other FRI jets show similar features. At present we do not understand the nature of the radio/X-ray peak offsets in FRI jets or the distributed particle acceleration process responsible for the diffuse X-ray emission, but the qualitative similarity between the Cen A jet and a jet termination region like 3C 390.3 S or 3C 33 S means that we might hope to gain some insight into one problem by studying the other. In both cases the observational requirement is sensitive, multi-frequency observations that allow us to construct a detailed map of the synchrotron SED as a function of position.
5.2 The nature of multiple hotspots
Our two new targets, 3C 227 and 3C 327, provide at least one clear example (3C 227 W), and possibly two, of an object where the primary and secondary hotspot are both detected in the X-ray, setting aside the problem of offsets between the components. 3C 33 N (Kraft et al., 2007) is another example of a source with multiple X-ray hotspots. 3C 390.3 N, on the other hand, behaves more similarly to 3C 403 E: the bright secondary hotspot is not an X-ray (or optical) synchrotron source even though there is an apparently clear connection between the primary and secondary hotspot indicative of continuing energy supply (but cf. the discussion of this point in Leahy & Perley 1995). Taking SX1 and its radio counterpart G′ to be the primary hotspot of the southern hotspot complex, a similar statement can be made for this system too. In both these cases, the upper limit on the X-ray to radio flux ratio in the non-detected hotspots, which are generally brighter in the radio, is 1–2 orders of magnitude below the measured value for the primary hotspots (Table 5). If we assume, as discussed in the previous section, that the X-ray emission mechanism is synchrotron, then this tells us that secondary hotspots can be different: some, at least, are able to accelerate particles to the highest observable energies, but others are at least an order of magnitude less efficient than the primaries in producing X-ray emission for a given radio emissivity. This conclusion would be stronger if the nature of the X-ray emission in the secondary hotspots were more obvious.
If some secondary hotspots can accelerate particles to high energies and some do not, what is the difference between them? Relic hotspots left behind by a jet that has moved (‘dentist’s-drill’ model) would certainly not be expected to have high-energy particle acceleration. But in our observations one secondary that apparently is connected to the jet (3C 390.3 N) does not have high-energy particle acceleration, while one that has no apparent connection in sensitive radio observations (3C 227 W) does. Radio morphology is therefore not a good guide to a hotspot’s ability to accelerate particles, or to its relationship to the energy supply. Nor is the radio brightness of the hotspot.
One trend that is apparent in the data is that a hotspot is more likely to be an X-ray emitter (and therefore a privileged site for high-energy particle acceleration?) if it is compact. The secondary hotspots in 3C 227 and 3C 327 are similar in size to the primaries. Those in 3C 390.3 and 3C 403 are several times larger. ‘Compact’ here appears to mean less than a few kpc in size. However, though this may be a necessary condition, it is not a sufficient one, as the non-detection of relatively compact hotspots in e.g. 3C 390.3 S shows. Secondary hotspot compactness could thus be an indicator of relatively well-collimated continued outflow from the primary hotspot to the secondary (or, in the case of the Cox et al. 1991 model, of a well-collimated disconnected jet); this makes sense, since (for a given luminosity) a more compact hotspot is more overpressured with respect to the lobe material and will have a shorter timescale for disappearance via adiabatic expansion in the absence of the energy supply. But the lack of a one-to-one correlation reinforces what we already know from observations of single hotspots: the ability of even low-luminosity, low--field hotspots, even when clearly connected to the energy supply, to produce X-ray emission is very variable and must depend on details of the microphysics that are not yet accessible to us.
6 Conclusions
We have looked with very high spatial resolution at the hotspot X-ray emission from a small sample of radio galaxies that show multiple radio hotspots. As in earlier work, we argue that the X-ray emission from the hotspots comes predominantly from the synchrotron process, and so traces high-energy particle acceleration. To our knowledge this paper represents the first attempt to use synchrotron emission to probe the particle acceleration properties in a sample of FRII sources, though several individual objects have previously been studied in detail.
Our principal results can be summarized as follows:
-
•
The cores and lobes of the two new sources in our sample have X-ray properties that are entirely consistent with expectations and with the sources’ places in unified models. There is evidence for intrinsic absorption in the spectrum of the BLRG 3C 227.
-
•
All the target sources exhibit structure in the X-ray images of their hotspots that would not have been predicted in a simple model in which particle acceleration occurs only at the jet termination as traced by the bright radio hotspot. This structure ranges from small-scale offsets in the radio and X-ray peaks (e.g. in 3C 227 W or 3C 390.3 N) through diffuse X-ray emission that is not well correlated with compact radio structure (e.g. 3C 390.3 S: see also 3C 33 S, Kraft et al. 2007; Pictor A E, Hardcastle & Croston 2005) to point-like sources in the jet termination region that bear little obvious relationship to the current radio hotspots (3C 327 E). If most or all of these structures can be taken to indicate the location of particle acceleration in these sources, then our observations support models in which the particle acceleration history in FRIIs can be complicated, non-localized, and not well traced by radio observations.
-
•
Our observations were obtained to investigate the nature of multiple hotspots, and we have found some evidence that some secondary hotspots are indeed associated with acceleration of particles to the highest observable energies, while others (as we had found previously) are not. This implies that at least some secondary hotspots have ongoing access to a supply of energy. All X-ray-synchrotron emitting hotspots appear to be compact, but not all compact hotspots are detected in X-rays. We cannot at present say whether this is because some of these compact hotspots are true relics, disconnected from the energy supply, or whether they are X-ray faint for some other reason related to the microphysics of their particle acceleration. Sensitive multi-wavelength observations in radio and optical will be required to make further progress.
References
- Allen et al. (1997) Allen, S.W., Fabian, A.C., Idesawa, E., Inoue, H., Kii, T., & Otani, C., 1997, MNRAS, 286, 765
- Black et al. (1992) Black, A.R.S., Baum, S.A., Leahy, J.P., Perley, R.A., Riley, J.M., & Scheuer, P.A.G., 1992, MNRAS, 256, 186
- Blandford & Rees (1974) Blandford, R.D., & Rees, M.J., 1974, MNRAS, 169, 395
- Brunetti et al. (2001) Brunetti, G., Bondi, M., Comastri, A., Pedani, M., Varano, S., Setti, G., & Hardcastle, M.J., 2001, ApJ, 561, L157
- Brunetti et al. (2003) Brunetti, G., Mack, K.H., Prieto, M.A., & Varano, S., 2003, MNRAS, 345, L40
- Cohen et al. (1999) Cohen, M.H., Ogle, P.M., Tran, H.D., Goodrich, R.W., & Miller, J.S., 1999, AJ, 118, 1963
- Cox et al. (1991) Cox, C.I., Gull, S.F., & Scheuer, P.A.G., 1991, MNRAS, 252, 588
- Crawford & Fabian (1995) Crawford, C.S., & Fabian, A.C., 1995, MNRAS, 273, 827
- Croston et al. (2005) Croston, J.H., Hardcastle, M.J., Harris, D.E., Belsole, E., Birkinshaw, M., & Worrall, D.M., 2005, ApJ, 626, 733
- Evans et al. (2006) Evans, D.A., Worrall, D.M., Hardcastle, M.J., Kraft, R.P., & Birkinshaw, M., 2006, ApJ, 642, 96
- Fanaroff & Riley (1974) Fanaroff, B.L., & Riley, J.M., 1974, MNRAS, 167, 31P
- Georganopoulos & Kazanas (2003) Georganopoulos, M., & Kazanas, D., 2003, ApJ, 589, L5 [GK03]
- Hardcastle & Croston (2005) Hardcastle, M.J., & Croston, J.H., 2005, MNRAS, 363, 649
- Hardcastle et al. (1997) Hardcastle, M.J., Alexander, P., Pooley, G.G., & Riley, J.M., 1997, MNRAS, 288, 859
- Hardcastle et al. (1998) Hardcastle, M.J., Birkinshaw, M., & Worrall, D.M., 1998, MNRAS, 294, 615
- Hardcastle et al. (2001) Hardcastle, M.J., Birkinshaw, M., & Worrall, D.M., 2001, MNRAS, 323, L17
- Hardcastle et al. (2002) Hardcastle, M.J., Birkinshaw, M., Cameron, R., Harris, D.E., Looney, L.W., & Worrall, D.M., 2002, ApJ, 581, 948
- Hardcastle et al. (2006) Hardcastle, M.J., Evans, D.A., & Croston, J.H., 2006, MNRAS, 370, 1893
- Hardcastle et al. (2004) Hardcastle, M.J., Harris, D.E., Worrall, D.M., & Birkinshaw, M., 2004, ApJ, 612, 729
- Hardcastle et al. (2006) Hardcastle, M.J., Kraft, R.P., & Worrall, D.M., 2006, MNRAS, 368, L15
- Hardcastle et al. (2003) Hardcastle, M.J., Worrall, D.M., Kraft, R.P., Forman, W.R., Jones, C., & Murray, S.S., 2003, ApJ, 593, 169
- Harris et al. (1998) Harris, D.E., Leighly, K.M., & Leahy, J.P., 1998, ApJ, 499, L149
- Harris et al. (2000) Harris, D.E., et al., 2000, ApJ, 530, L81
- Heavens & Meisenheimer (1987) Heavens, A.F., & Meisenheimer, K., 1987, MNRAS, 225, 335
- Jahoda et al. (1985) Jahoda, K., McCammon, D., Dickey, J.M., & Lockman, F.J., 1985, ApJ, 290, 229
- Kataoka & Stawarz (2005) Kataoka, J., & Stawarz, L., 2005, ApJ, 622, 797
- Kraft et al. (2005) Kraft, R.P., Hardcastle, M.J., Worrall, D.M., & Murray, S.S., 2005, ApJ, 622, 149
- Kraft et al. (2007) Kraft, R.P., Birkinshaw, M., Hardcastle, M.J., Evans, D.A., Croston, J.H., Worrall, D.M., & Murray, S.S., 2007, ApJ in press (astro-ph/0701458)
- Leahy et al. (1997) Leahy, J.P., Black, A.R.S., Dennett-Thorpe, J., Hardcastle, M.J., Komissarov, S., Perley, R.A., Riley, J.M., & Scheuer, P.A.G., 1997, MNRAS, 291, 20
- Leahy & Perley (1995) Leahy, J.P., & Perley, R.A., 1995, MNRAS, 277, 1097
- Lonsdale & Barthel (1986) Lonsdale, C.J., & Barthel, P.D., 1986, AJ, 92, 12
- Mack et al. (2003) Mack, K.-H., Prieto, M.A., & Brunetti, G., 2003, NewAR 47 501
- Meisenheimer et al. (1989) Meisenheimer, K., Röser, H.-J., Hiltner, P.R., Yates, M.G., Longair, M.S., Chini, R., & Perley, R.A., 1989, A&A, 219, 63
- Murphy et al. (1996) Murphy, E.M., Lockman, F.J., Laor, A., & Elvis, M., 1996, ApJS, 105, 369
- Nicastro et al. (1999) Nicastro, F., Fiore, F., Perola, G.C., & Elvis, M., 1999, ApJ, 512, 136
- Prieto (1997) Prieto, M.A., 1997, MNRAS, 284, 627
- Prieto & Kotilainen (1997) Prieto, M.A., & Kotilainen, J.K., 1997, ApJ, 491, L77
- Prieto et al. (2002) Prieto, M.A., Brunetti, G., & Mack, K.H., 2002, Sci 298 193
- Röser & Meisenheimer (1987) Röser, H.-J., & Meisenheimer, K., 1987, ApJ, 314, 70
- Sambruna et al. (1999) Sambruna, R.M., Eracleous, M., & Mushotzky, R.F., 1999, ApJ, 526, 60
- Saslaw et al. (1978) Saslaw, W.C., Tyson, J.A., & Crane, P., 1978, ApJ, 222, 435
- Scheuer (1982) Scheuer, P.A.G., 1982, in Heeschen, D.S., Wade C.M., eds, Extragalactic Radio Sources, IAU Symposium 97, Reidel, Dordrecht, p. 163
- Spinrad et al. (1985) Spinrad, H., Djorgovski, S., Marr, J., & Aguilar, L., 1985, PASP, 97, 932
- Stark et al. (1992) Stark, A.A., Gammie, C.F., Wilson, R.W., Bally, J., Linke, R.A., Heiles, C., & Hurwitz, M., 1992, ApJS, 79, 77
- Tavecchio et al. (2000) Tavecchio, F., Maraschi, L., Sambruna, R.M., & Urry, C.M., 2000, ApJ, 544, L23
- Tregillis et al. (2001) Tregillis, I.L., Jones, T.W., & Ryu, D., 2001, ApJ, 557, 475
- Tregillis et al. (2002) Tregillis, I.L., Jones, T.W., Ryu, D., & Park, C., 2002, NewAR 46 387
- Williams & Gull (1985) Williams, A.G., & Gull, S.F., 1985, Nature, 313, 34