A Silver Anniversary Observation of the X-Ray Luminous SN 1978K in NGC 1313
Abstract
We describe the results of a 2003 Chandra ACIS-I observation of SN 1978K. The spectrum shows little flux below 0.6 keV, in contrast to the 2002 Chandra ACIS-S observation which showed flux to 0.4 keV. Fitting the ACIS-I spectrum alone leads to two solutions depending upon the value of the column density. A joint fit using a dual thermal plasma model applied to the ACIS-I and a contemporaneous XMM spectrum, which if fit alone also leads to a two-column solution, yields a single column density fit. The fitted temperature of the joint fit for the soft component remains constant within the errors from previous Chandra, XMM, and ASCA data. The hard temperature recovers from its 2000-2002 decline and corresponds to an increase in the column density during that time. The hard (2-10 keV) light curve is confirmed to be declining. The derived number density represents a lower limit of 105 depending upon the adopted filling factor of the emitting volume, leading to an estimated mass cooling rate of 0.1-0.15 M⊙ yr-1.
1 Introduction
The late X-ray emission of supernovae remains relatively unexplored. SN 1987A’s initial emission turned on near day 115 and merged into the background near day 400 post-explosion (Inoue et al., 1991). Recent observations show a reappearance of the emission as the shock propagates into circumstellar matter (Zhekov et al., 2006). Other than SN 1987A, the only supernovae studied beyond 500 days have been SN 1978K (Schlegel et al. (2004), and references therein, hereafter, S04), SN 1995N (Chandra et al., 2005), SN 1993J (Zimmermann & Aschenbach, 2003), and SN 1986J (Temple, Raychaudhury, & Stevens, 2005) plus a few objects recovered at late times (eg, SN 1979C and SN 1970G; Immler & Kuntz 2005; Immler et al. 2005) that presumably will continue to be studied. Of these, SN 1978K has been the most luminous and hence the most frequently observed.
Though SN 1978K was first detected as a powerful radio source in 1982 (Ryder et al., 1993), it was not realized that it emitted X-rays until an observation was obtained with the ROSAT PSPC in 1992. The subsequent investigation examined archival optical plates, uncovered a light curve and assigned an explosion date near 1978 May 22 (Ryder et al., 1993). Follow-up observations of SN 1978K in the X-ray, ultraviolet, optical, and radio bands were obtained during the mid- and late-1990s with ASCA, the Hubble Space Telescope, the ROSAT High Resolution Imager (HRI), the Australia Telescope Compact Array (ATCA), and the Anglo-Australian Observatory (AAO) (Schlegel et al., 1999).
S04 described a 2002 Chandra and a 2000 XMM-Newton observation of SN 1978K. The spectra were best fit by a two-temperature variable-abundance optically thin gas model with temperatures of 0.6 and 3 keV. The authors reported Si emission in the soft component at 90% significance. The flux in the 2-10 keV band showed the first hint of a decline in the X-ray flux from the 1990s plateau.
Since the 2004 paper, additional data have become available. Here we briefly describe a Chandra ACIS-I observation of SN 1978K obtained in 2003 October and an XMM-Newton observation obtained in 2003 November. We first describe the data and the spectral fit, then discuss the results in the context of the previous observations. Throughout we adopt a distance to NGC 1313 of 4.130.11 Mpc (Méndez et al. 2002).
2 Data and Analysis
Chandra observed SN 1978K and the other X-ray emitting sources in NGC 1313 on 2003 Oct 2 for 14,827 seconds with the ACIS detector (observation ID 3551, PI G. Garmire) (Garmire et al., 2003). The aim point of the detector fell on the front-illuminated I3 CCD. The aimpoint on the I3 CCD differs from previous observations that were obtained with the back-illuminated S3 CCD; the effective area behaviors of the two types of CCDs differ. We discuss our approach to this difference below.
We extracted a background light curve and spectrum from a region proximal to the source. This much larger, source-free region was 1′.5 in radius and was positioned immediately west of SN 1978K. We examined the light curve for bright transients or flaring events and did not detect any evidence for either, consequently the good exposure time was not reduced from 14.8 ksec. The net source count rate was 0.083 0.002 counts s-1.
We fit the extracted spectra using XSPEC version 12.2.1 (Arnaud, 1996); for the background spectrum, we adopted a simple power law continuum with a gaussian at 1.8 keV to model the possible Si fluorescent feature present in the ACIS background (S04).
The source events were extracted and binned to a spectrum using a region at the location of SN 1978K with an aperture of radius 18′′.5. Though the sharp point-spread function of the Chandra mirrors may cause concern about possible event pileup, the large off-axis angle of 2′.6 and low net count rate ensure that pileup in this case is negligible.
A single spectral bin exists below 0.6 keV which is consistent with the background; this is in marked contrast to the 2002 spectrum for which source events were detected to 0.4 keV. We refer the reader to S04 for a description of a variety of models that did not provide good fits to that data. Our adopted best-fit model is described below and is based on the best-fit model from 2004 paper.
In S04, we used variable-abundance thermal plasma models (’VMEKAL’ in xspec, Arnaud 1996). In the interim, updated atomic parameters have become available through the APED project (Smith, Brickhouse, & Liedahl, 2003). Along with the database, the project has developed a new thermal plasma model for xspec (’VAPEC’) that we have used in fitting the data discussed here.
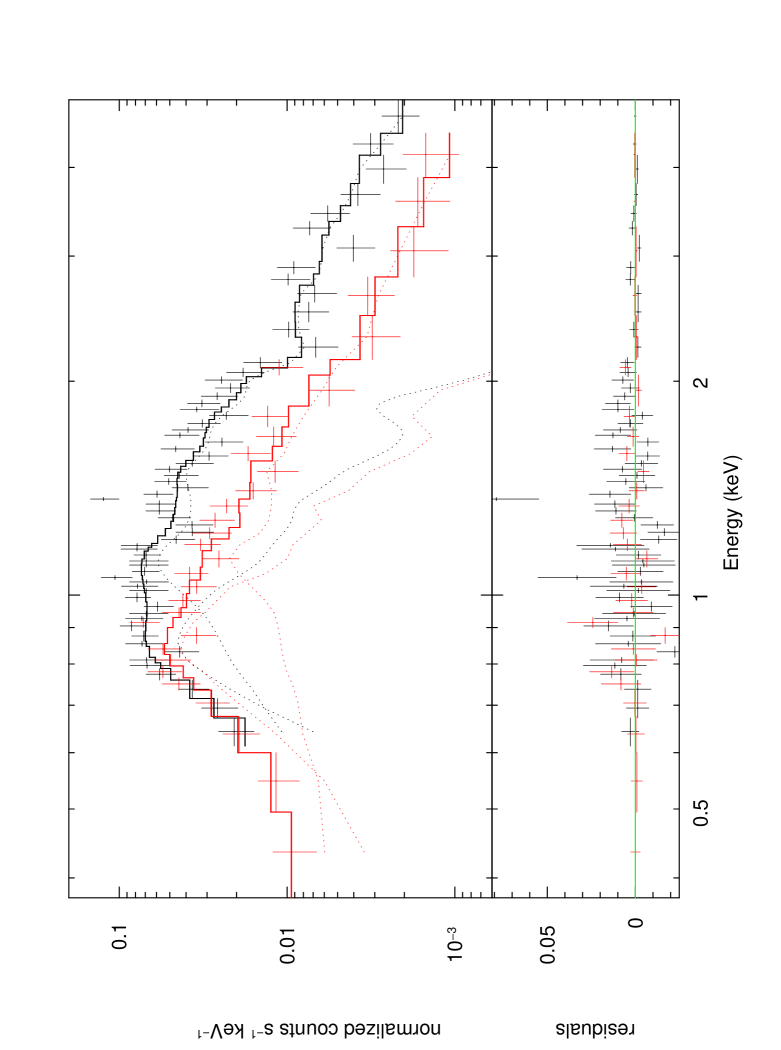
To fit the 2003 October Chandra spectrum, we may either fit the data without regard to previous fits, or constrain the fit assuming little change over the intervening twelve months. This consideration is critical because of the differing spectral responses of the -S and -I chips. Given the effective area behavior of the ACIS-I3 CCD, the critical parameter to constrain is the column density. Fixing its value at 0.15, the best fit from the 2004 paper, we obtain a fit that differs largely in flux: the soft and hard temperatures are essentially identical (Figure 1, Table 1, referred to as VAPEC-L, for Low NH).
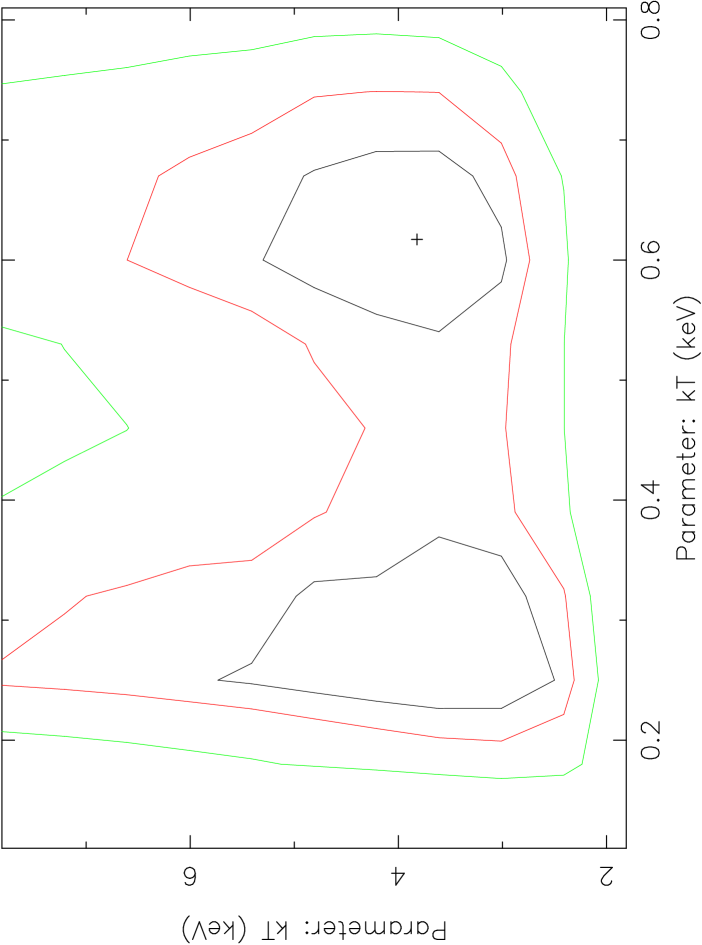
If we do not place any constraints on the 2003 spectrum, the fit with the lowest yields a high column, NH 0.631022 cm-2 and a low soft temperature of 0.28 keV (Table 1, referred to as VAPEC-H, for High NH). The hard temperature drops slightly to 2.22 keV but the error bars cover the value from the dual fit. The anti-correlation between NH and the soft temperature is expected given that there are few data points below 0.8 keV to constrain the parameters separately. We note that the 99% contour includes the values obtained from the 2000 and 2002 data sets. We will include both possibilities in our discussion.
The seemingly abrupt change in the NH parameter could stem solely from the differing behaviors of the effective areas of the -I vs -S CCDs which differ, particularly at energies below 0.7 keV and above 4 keV (Chandra IPI Teams, 2005). Consequently, a spectral fit to the I spectrum could lead to systematic differences from the previous spectrum.
To investigate any possible systematic differences, we extracted a spectrum from an XMM-Newton observation of SN1978K. The XMM-Newton observation was obtained on 2003 November 25 (obsid 0150280101, PI I. Smith) for 12 ksec. The spectrum was extracted after filtering the data to eliminate times of high background that generally afflict XMM observations. The extracted net spectrum contains 600 counts. The background spectrum was obtained from 1′.6 south of SN1978K’s location. It was featureless in the area of interest (0.5-3 keV) and represents 15% of the source signal.
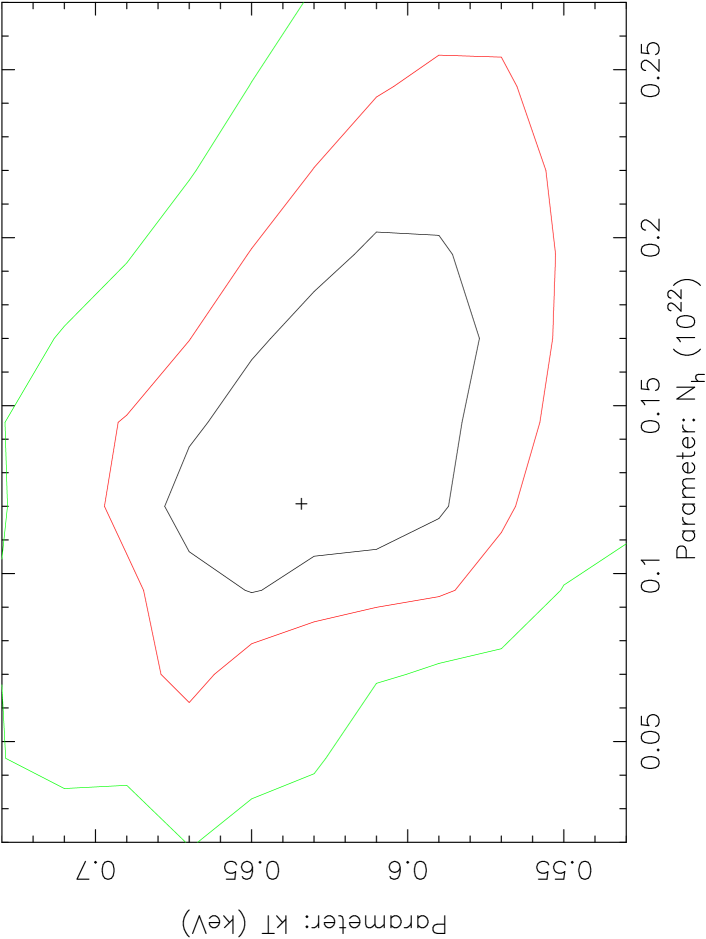
In fitting the VAPEC model to the XMM spectrum, we again obtain a dual solution to the soft temperature because of differing values of the column density (Figure 2). Otherwise, the Chandra-only and XMM-only fits are similar.
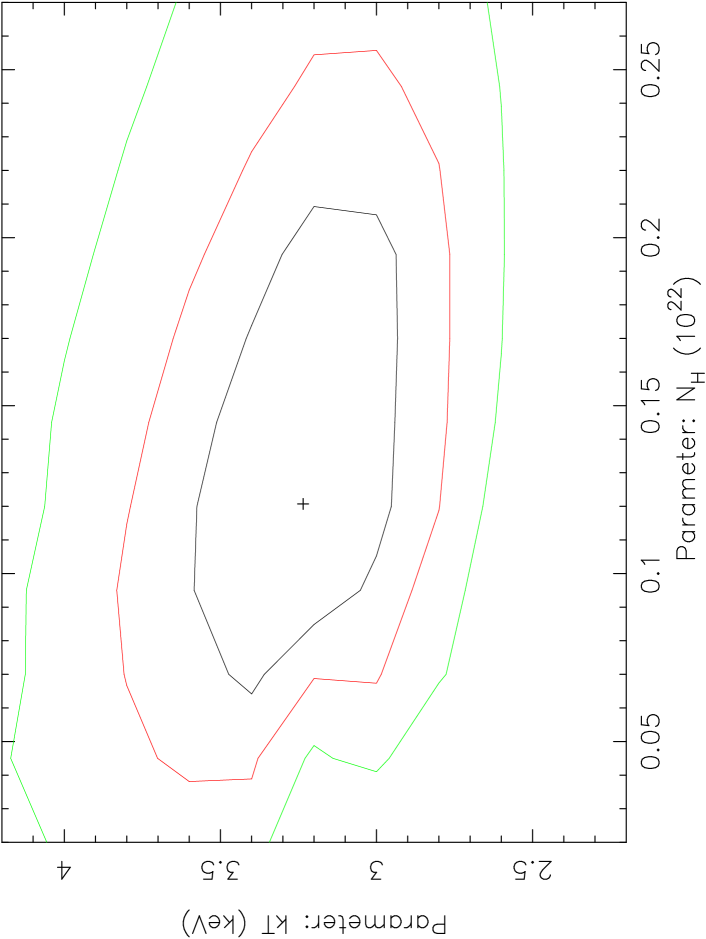
To extract the best spectral fit parameters with the least number of constraints, we fit the ACIS-I3 and XMM data simultaneously. Figure 3 shows the resulting spectral fit; Figure 4 shows the temperature contours. The simultaneous fit yields a lower value for the column density than described in S04 (0.12 vs. 0.23 in units of 1022 cm-2), an identical soft temperature (0.64 keV vs. 0.61 keV) and a higher hard temperature (3.36 keV vs. 3.16 keV), although the 90% confidence ranges of the hard temperatures overlap.
Variable models such as VMEKAL and VAPEC permit altering the abundances of elements known to produce emission lines. We investigated elemental abundances because S04 reported Si to be present in the soft spectral component. We started with all element abundances frozen at 1.0 and checked the spectrum for visible lines. We in turn relaxed and fixed each element’s abundance, each time looking for significant changes in the /. In all cases, including Si, within the errors, the abundances were consistent with 1.0 (Figure 3). We report upper limits only for Si (Table 1).
3 Discussion
We base our discussion on the dual Chandra-XMM spectral fit because the evidence shows that fitting only one spectrum leads to systematic differences with the prior Chandra ACIS-S spectra (S04).
The normalization values in the hard and soft components for the 2003 data (Table 1) are nonzero at the 90% level, so it is evident that the two components remain significantly detected as was true in the 2002 Chandra observation.
To maintain consistency between the 2003 Chandra data and the earlier XMM-Newton, ASCA, and 2002 Chandra data, we also refit the previously-published spectra using the dual-component VAPEC model. The fits yielded values very similar to those of the published VMEKAL values. The updated numbers are shown in Table 2 and are included for completeness. Differences between column densities and temperatures were generally within 5% of the values published in S04. The ASCA-1 and ASCA-2 values appeared to differ the most (10-20%), likely due to the poor low-energy response.111For additional information, see the ASCA Guest Observer Facility’s ”Watch Out” page (heasarc.gsfc.nasa.gov/docs/asca/watchout.html).
We include in Table 3 the fluxes for the Chandra and XMM-only model fits, the joint Chandra-XMM fit, as well as the re-fitted spectra from S04. Of particular interest is the soft Chandra component that shows a high column density. The corresponding unabsorbed flux is very high, demonstrating the necessity for care in handling the ACIS-I spectrum.
With a consistent set of model fits, the light curves of the soft and hard components may be constructed. Figure 5 displays the soft (top) and hard (bottom) unabsorbed light curves. Both light curves shows a continuing decrease in flux, confirming the decline reported in S04.
Though the 2002 and 2003 data share the dual-component structure, significant differences exist between the two epochs. The results are shown schematically in Figure 6. Note that the values of two of the parameters have been divided by a constant to place the points into the plot.
The soft component kT has held steady within the errors at 0.6 keV. In contrast, the hard component temperature has held steady at 3.2-3.4 keV with the exception of the day 8910 spectrum, when it dropped to 2.4 keV at the same time that the column density increased.
The column density varied from 0.15 to 0.25 (in units of 1022 cm-2) and back. The known column toward NGC 1313 is 3.71020 cm-2 (S04). As pointed out in S04, the EB-V value from the optical spectrum is 0.31 which corresponds to NH 1.61021 cm-2, a value matched by the fitted NH for days 5531, 8184, and 9209/9263. The EB-V-derived value also matches the day 6401 column within the errors. The difference between the known column to NGC 1313 and the fitted or derived column values requires considerable absorption local to SN1978K. That the column density increased at day 8910 and then declined suggests the existence of a recent, local density enhancement.
Finally, another difference in the two data sets is the abundance of Si. The 2003 spectra show no detection of Si in either component, though the 2002 data showed an abundance well above solar and significant at the 90% level.
The ratio of kTsoft and kThard determines the power law indices, (n and s), of the ejecta and circumstellar matter distribution, respectively (Fransson et al., 1996). The usual adoption of s = 2 allows us to solve for n using one of the predictions of the thin shell model (Fransson et al., 1996): (Tr/Tf) = ((3–s)2/(n–3)2) where Tr is the reverse shock temperature and Tf is the forward shock temperature. Assuming that Tr is given by Tsoft and Tf is given by Thard, n is calculated as 5.290.88 for the 2003 Chandra observation. The n values for the 2002 Chandra, XMM-Newton, ASCA-2 and ASCA-1 observations are 4.960.04, 5.290.10, 7.970.62 and 5.230.83, respectively. The weighted mean value is 5.02. This is a lower value for the power law index than is generally assumed for mass distributions (typically 8-12; Fransson et al. 1996), but within the errors of other X-ray-emitting SNe (eg, SN1993J, S04). Smaller values of the index lead to longer cooling times as is observed in SN1978K.
We may infer X-ray properties following the arguments in Schlegel & Petre (2006) that were based on analyses first used by Immler and co-workers (summarized in Immler & Lewin (2003)). Thermal plasma emission is given by LX = where (T) is the emissivity, ne is the electron density, and VX is the emitting volume. is 10-23 erg s-1 cm-3 for plasmas with temperatures of 0.5-10 keV in the 0.2-5 keV band (Raymond et al., 1976). The quantity n is the volume emission measure. An estimate of the volume then delivers an estimate of the number density from which we may calculate the mass of the cooling gas, MX (Table 4).
Table 4 lists the inferred quantities where we also include a volume filling factor, , that describes the emitting matter within the volume enclosed by the shock. The shock volume is estimated from the maximum observed line width of the 1996 optical spectrum (600 km s-1, Schlegel et al. 1999). To estimate velocities for the other epochs, we adopt the velocity profile from SN 1988Z, t-(5/7), as described by (Aretxaga et al., 1999). We justify the adoption of this velocity profile on the basis of the similar X-ray luminosities and optical spectral line widths. SN1988Z is the only other supernova with sufficient data at late times, hence our adoption of the velocity profile.
If the plasma uniformly fills the shock volume, the density must be 105 cm-3. An order of magnitude higher density requires a filling factor smaller by the factor . These estimates require the assumption of collisional ionization equilibrium which occurs if the product s cm-3. Our estimates at the age of SN 1978K exceed that criterion by at least a factor of 20.
If we take at face value the results of the spectral fits, then the column density increased between 2000 and 2003 from 1.51021 cm-2 to 2.51021 cm-2 and back. Is the increase real? The larger effective area of the ACIS-S CCD in the 2002 observation, as well as the longer exposure time, serve to establish that the increase in column density is not an instrumental effect or an artifact of effective area.
Is the increase physically reasonable? The path length during that interval increased by 31015 cm based on the adopted shock velocity from Table 4. This translates to an increase in the number density from 2–4105 cm-3 to 7-8105 cm-3, or an increase of a factor of 1.7–2. This range has been observed in SN 2001ig where an increase in the radio flux by a factor of 3 was attributed to an increase in the number density by a factor of 2 over a time span of 150 d (Ryder et al., 2004). For SN1978K, the time span could be as long as 400-500 days, assuming the enhancement started immediately after the XMM observation in 2000 and halted immediately before the Chandra observation of 2003. Hence we conclude that the increase in column density is physically possible.
That the Si abundance also appears to have increased implies enhanced emission as a shock overran a density enhancement and specifically a Si enhancement. A Si enhancement requires production of Si which occurs in stars of mass 11-35 M⊙ based on a study of the integrated yield assuming a Salpeter initial mass function (Limongi & Chieffi, 2006).
In summary, with the 2003 observation, we now see a higher column occurring approximately in 2002. The increase in column density can be explained as an local increase in prior mass loss as observed in several X-ray-emitting SNe (eg, SN1979C, SN2001ig). This behavior argues for increased time sampling of the late phases of X-ray-emitting SNe. The benefit of such observations is the possibility of insight into the mass loss of massive stars. Will, for example, the flux from SN1978K increase if the outgoing shock runs over another density enhancement? We also confirm the decrease in the X-ray flux from SN1978K that started in 2000-2002 and was first reported in S04, a forlorn epitaph for a silver anniversary.
4 Acknowledgements
We thank the referee for comments that improved this paper. The research of EL and EMS was supported in part by Grant GO4-5017A from the Chandra X-ray Center operated by the Smithsonian Astrophysical Observatory under contract to NASA.
References
- Arnaud (1996) Arnaud, K. A. 1996, in ASP Conf. Ser. 101, Astronomical Data Analysis Software and Systems V, ed. G. H. Jacoby & J. Barnes (San Francisco: ASP), 17
- Aretxaga et al. (1999) Aretxaga, I., Benetti, S., Terlevich, R., Fabian, A. C., Cappellaro, E., Turatto, M., & Della Valle, M. 1999, MNRAS, 309, 343
- Chandra IPI Teams (2005) Chandra Proposer’s Observatory Guide (Cambridge: Chandra X-ray Center)
- Chandra et al. (2005) Chandra, P., Ray, A., Schlegel, E. M., Sutaria, F., & Pietsch, W. 2005, ApJ, 629, 933
- Dopita & Ryder (1990) Dopita, M., &Ryder, s. 1990, IAU Circ., 4950, 3
- Dotani et al. (1987) Dotani, T., et al. 1987, Nature, 330, 230
- Fransson et al. (1996) Fransson, C., Lundqvist, P., & Chevalier, R. 1996, ApJ, 461, 993
- Garmire et al. (2003) Garmire, G. P., Bautz, M. W., Ford, P. G., Nousek, J. A., & Ricker, G. R., Jr. 2003, Proc. SPIE, 4851, 28
- Immler et al. (2005) Immler, S. et al. 2005, ApJ, 632, 283
- Immler & Kuntz (2005) Immler, S. & Kuntz, K. 2005, ApJ, 632, L99
- Immler & Lewin (2003) Immler, S., & Lewin, W. 2003, in Supernovae and Gamma-Ray Bursters, ed. K. Weiler (New York: Springer), 91
- Inoue et al. (1991) Inoue, H., Hayashida, K., Itoh, M., Kondo, H., Mitsuda, K., Takeshima, T., Yoshida, K., & Tanaka, Y., et al. 1991, PASJ, 43, 213
- Kaastra (1992) Kaastra, J. S. 1992, An X-Ray Spectral Code for Optically Thin Plasmas (Internal SRON-Leiden Rep., ver 2.0; Leiden: SRON)
- Liedahl, Osterheld & Goldstein (1995) Liedahl, D. A., Osterheld, A. L., & Goldstein, W. H. 1995, ApJ, 438, L115
- Limongi & Chieffi (2006) Limongi, M. & Chieffi, A. 2006, astro-ph/0611140
- Méndez et al. (2002) Méndez, B., Davis, M., Moustakas, J., Newman, J., Madore, B. F. & Freedman, W. L. 2002, AJ, 124, 213
- Mewe, Gronenschild & van den Oord (1985) Mewe, R., Gronenschild, E. H. B. M., & van den Oord, G. H. J. 1985, A&AS, 62, 197
- Mewe, Lemen & van den Oord (1986) Mewe, R., Lemen, J. R., & van den Oord, G. H. J. 1986, A&AS, 65, 551
- Raymond et al. (1976) Raymond, J. C., Cox, D. P., & Smith, B. W. 1976, ApJ, 204, 290
- Ryder et al. (1993) Ryder, S., Staveley-Smith, L., Dopita, M., Petre, R., Colbert, E. J. M. 1994, PASJ, 46, 167
- Ryder et al. (2004) Ryder, S., Sadler, E. M., Subrahmanyan, R., Weiler, K. W., Panagia, N., Stockdale, C. 2004, MNRAS, 349, 1093
- Schlegel (1995) Schlegel, E. M. 1995, Rep. Prog. Phys., 58, 1375
- Schlegel & Petre (2006) Schlegel, E. M. & Petre, R. 2006, ApJ, 646, 378
- Schlegel et al. (1999) Schlegel, E. M., Ryder, S., Stavely-Smith, L., Petre, R., Colbert, E. J. M., Dopita, M., & Campbell-Wilson, D. 1999, AJ, 118, 2689
- Schlegel et al. (2004) Schlegel, E. M., Kong, A., Kaaret, P., DiStefano, R., Murray, S. 2004, ApJ, 603, 644
- Smith, Brickhouse, & Liedahl (2003) Smith, R. K., Brickhouse, N. S., & Liedahl, D. A. 2003, IAU JD 23, Atomic Data for X-ray Astronomy
- Temple, Raychaudhury, & Stevens (2005) Temple, R., Raychaudhury, S., & Stevens, I. 2005, MNRAS, 362, 581
- Zhekov et al. (2006) Zhekov, S. A., McCray, R., Borkowski, K. J., Burrows, D. N., Park, S. 2006, ApJ, 645, 293
- Zimmermann & Aschenbach (2003) Zimmermann, H. U. & Aschenbach, B. 2003, A&A, 406, 969
| NH | Tsoft | Thard | ||||||
| Model | DoF | (1022 cm-2 | (keV) | (keV) | Si1, Si2 | Norm-1 | Norm-2 | |
| October 2003 Chandra Spectrum only | ||||||||
| VMEKAL | 1.220 | 87 | 0.72 | 0.22 | 1.97 | 5.3, 54 | 3.62E-3 | 49E-5 |
| VAPEC-L | 1.22 | 72 | 0.15f | 0.63 | 2.61 | 1.0, 3.19 | 7.90E-5 | 3.32E-4 |
| VAPEC-H | 1.17 | 71 | 0.63 | 0.28 | 2.22 | 1.0f, 2.75 | 1.58E-3 | 4.03E-4 |
| November 2003 XMM Spectrum only | ||||||||
| VAPEC | 0.89 | 29 | 0.15 | 0.62 | 3.83 | 3.5, 3.0 | 8.91E-5 | 22.89E-5 |
| Dual Chandra/XMM Spectra | ||||||||
| VAPEC | 0.98 | 95 | 0.12 | 0.64 | 3.36 | 4.5, 3.3 | 6.71E-5 | 43.62E-5 |
| 7.18E-5 | 23.38E-5 | |||||||
| Observation | AgebbAge based on date of optical maximum = 1978 May 22, MJD 43650. | NH | Tsoft | Thard |
|---|---|---|---|---|
| Chandra | 8910 | 0.250.02 | 0.630.02 | 2.430.16 |
| XMM-Newton | 8184 | 0.150.01 | 0.710.02 | 3.170.21 |
| ASCA-2 | 6401 | 0.410.22 | 0.640.09 | 3.191.18 |
| ASCA-1 | 5531 | 0.110.02 | 0.770.12 | 3.831.80 |
| Age | Band | Complete | Soft | Hard | ||||
|---|---|---|---|---|---|---|---|---|
| Observation | (days) | (keV) | Abs’d | Unabs’d | Abs’d | Unabs’d | Abs’d | Unabs’d |
| joint Chandra | 9209 | 0.5-2 | 3.33 | 4.65 | 1.06 | 1.59 | 2.27 | 3.07 |
| 2-10 | 3.58 | 3.64 | 0.04 | 0.05 | 3.54 | 3.59 | ||
| + XMM | 9263 | 0.5-2 | 2.35 | 3.34 | 1.13 | 1.70 | 1.61 | 1.92 |
| 2-10 | 1.90 | 1.93 | 0.05 | 0.05 | 1.85 | 1.88 | ||
| XMM only | 9263 | 0.5-2 | 2.36 | 3.72 | 1.22 | 2.09 | 1.13 | 1.63 |
| 2-10 | 2.20 | 2.24 | 0.05 | 0.05 | 2.15 | 2.18 | ||
| Chandra only | 9209 | 0.5-2 | 3.29 | 4.86 | 1.56 | 2.28 | 2.24 | 3.00 |
| Low NH | 2-10 | 3.58 | 3.64 | 1.10 | 1.11 | 3.51 | 3.56 | |
| Chandra only | 9209 | 0.5-2 | 3.30 | 27.2 | 2.25 | 23.8 | 1.46 | 3.76 |
| High NH | 2-10 | 3.41 | 3.63 | 1.15 | 1.12 | 3.35 | 3.60 | |
| 2002 ChandraccFluxes recalculated for VAPEC model; values should be considered to replace those presented in S04. | 8910 | 0.5-2 | 4.25 | 6.57 | 2.06 | 3.37 | 2.21 | 3.20 |
| 2-10 | 2.78 | 2.84 | 0.11 | 0.12 | 2.67 | 2.72 | ||
| XMM-NewtonccFluxes recalculated for VAPEC model; values should be considered to replace those presented in S04. | 8184 | 0.5-2 | 4.50 | 7.45 | 2.15 | 3.79 | 2.35 | 3.65 |
| 2-10 | 3.44 | 3.53 | 0.17 | 0.18 | 3.27 | 3.35 | ||
| ASCA-2ccFluxes recalculated for VAPEC model; values should be considered to replace those presented in S04. | 6401 | 0.5-2 | 6.29 | 16.9 | 4.08 | 11.8 | 3.40 | 6.23 |
| 2-10 | 8.62 | 8.94 | 1.03 | 1.06 | 8.35 | 8.67 | ||
| ASCA-1ccFluxes recalculated for VAPEC model; values should be considered to replace those presented in S04. | 5531 | 0.5-2 | 4.25 | 5.30 | 1.02 | 1.31 | 3.21 | 3.96 |
| 2-10 | 6.37 | 6.43 | 0.08 | 0.09 | 6.29 | 6.34 | ||


| Age | VelocityaaVelocity estimated adopting velocity profile of t-(5/7) from Aretxaga et al. (1999) and based upon the optical emission line width (described in text). | Radius | nbb is the dimensionless filling factor; n is the emission measure; an estimate of the volume V leads to an estimate of the number density ne. | n | MXddMX is the mass of cooling gas in M⊙. | |
| (days) | (km s-1) | (pc) | (1061 cm3) | (105 cm-3) | cc assumes ne = 107 cm-3. | (M⊙) |
| Soft Component | ||||||
| 5531 | 690 | 0.010 | 2.84 | 4.82 | 4.810-2 | 0.05 |
| 6401 | 620 | 0.011 | 26.11 | 12.66 | 1.310-1 | 0.17 |
| 8184 | 520 | 0.011 | 8.06 | 7.03 | 7.010-2 | 0.10 |
| 8910 | 490 | 0.012 | 7.08 | 5.79 | 5.810-2 | 0.10 |
| 9209 | 480 | 0.012 | 3.33 | 3.97 | 3.910-2 | 0.07 |
| 9263 | 475 | 0.012 | 3.55 | 4.10 | 4.110-2 | 0.07 |
| Hard Component | ||||||
| 5531 | 690 | 0.010 | 20.91 | 13.09 | 1.310-1 | 0.13 |
| 6401 | 620 | 0.011 | 30.25 | 13.62 | 1.410-1 | 0.18 |
| 8184 | 520 | 0.011 | 14.21 | 9.34 | 9.310-2 | 0.13 |
| 8910 | 490 | 0.012 | 12.02 | 7.55 | 7.510-2 | 0.13 |
| 9209 | 480 | 0.012 | 13.52 | 8.00 | 8.010-2 | 0.14 |
| 9263 | 475 | 0.012 | 7.71 | 6.04 | 6.010-2 | 0.11 |