ANL-HEP-PR-07-47
July 9, 2007
On influence of experimental resolution on
the statistical significance of a signal:
implication for pentaquark searches
S.V. Chekanov a and B.B. Levchenko b
-
a
HEP Division, Argonne National Laboratory, 9700 S.Cass Avenue,
Argonne, IL 60439 USA -
b
Skobeltsyn Institute of Nuclear Physics, Moscow State University,
119992 Moscow, Russian Federation
Abstract
An analytical relationship between the statistical significance of an observed signal and the signal width in case of a large background was obtained. It can help to explain why high-energy experiments may have different conclusions on the existence of new particles. We illustrate our approach using the experimental data on searches for the pentaquark state. The obtained relationship is also useful for planning of future experiments designed to search for signals of new particles in invariant-mass distributions.
1 Introduction
With increase of the energy of colliding beams, high-energy experiments have to deal with the problem of a large combinatorial background which makes searches for new narrow states111We define narrow states as the states which have the natural width less than , where is a particle mass. in invariant-mass distributions to be rather difficult. This was the case with the top-quark discovery, searches for new charmonium states or pentaquark searches. Usually, observed signals do not have high statistical significance, and the decision has to be made about whether the observed peak has a sufficient significance to claim the observation, or it should be disregarded.
The situation with particle searches could be rather complicated and confusing, especially when several similar experiments have different conclusions on a signal existence. In such cases, instrumental differences between these experiments are important to know. For the signal reconstruction in invariant-mass distributions, it becomes crucial to understand the influence of experimental resolution on the statistical significance of a signal. In this paper, we have obtained a relationship between the statistical significance of a signal and its width. For narrow states, the peak width is mainly determined by the experimental resolution which can be different for different experiments. Therefore, the obtained relationship could clarify some cases when several experiments observe a signal, while others do not see it.
To be more specific, let us remind that two similar collider experiments at DESY (Hamburg) [1, 2] and two similar fixed-target experiments at IHEP (Protvino) [3, 4] do not agree on the existence of an exotic state with the mass close to 1530 MeV, which may be interpreted as a strange pentaquark (PQ) state [5]. While the ZEUS [1] and SVD-2 [3] experiments claim the observation of a narrow peak near 1530 MeV in the decay mode , the H1 and SPHINX collaborations do no see it.
It should be mentioned that the decay channel is not exotic, since the standard baryons can decay to this channel as well. However, the observed peak position and the narrow width are very close to the theoretical expectation for the state [5]. In addition, a state near 1530 MeV is unknown [6] and it was never seen in previous exclusive reactions where experimental conditions were favorable for the observation of the states. There are several indications that the observed particle has different properties from those of the usual baryons produced in quark and gluon fragmentation [7, 8].
In this paper, we illustrate the influence of the track resolution on the statistical significance using the decays. Our analysis is rather general and can be used to establish a relationship between the width of the observed signal and its statistical significance in any experiment where a large background is expected.
2 Influence of inactive material on the
reconstruction
First, let us study the effect of an inactive material in front of a tracking device on the reconstructed mass resolution for the decay channel. Clearly, the reconstructed width depends on the quality of a tracking device itself, as well as on the software reconstruction. For simplicity of our toy simulation, we ignore these facts completely; our set-up represents an ideal case when the mass resolution is mainly due to unrecoverable loss of the information on the original particle momenta after rescattering on inactive material. For example, a beam pipe and/or the inner wall of a tracking device represent an inactive material leading to a degradation of the track resolution. In case if a micro-vertex detector is not used as an active detector in the reconstruction of the and the proton, the amount of material further increases and, as we show below, the penalty is a significant worsening of the resolution for the reconstruction.
For this study, a Geant [11] simulation was used. We made a simple detector set-up which consists of an aluminum target followed by a tracking chamber. Each simulated event consists of a single initial particle with the momentum vector perpendicular to the target, which is located 1 cm away from the injection point. Only the decay mode was considered. The initial momentum of was . In this case, the proton absolute momentum is below , ensuring that the identification is possible. We assume no energy loss in the tracking simulation.
Below we will study the dependence of the reconstructed width, , on the amount of material. We use the word “width” to denote the standard deviation of a Gaussian distribution used to describe the mass resolution.
The mesons from the decays interact with the aluminum target and then decay into . Our algorithm calculates the invariant mass of two oppositely charged tracks to reconstruct the . For the protons, any track which is not associated with the pions from the is used. Then, is combined with a proton track to reconstruct the mass. Table 1 shows the width for and , when reconstructed tracks are used (the second and third columns), or when the true information on the pion momenta is used (the last column). The latter reconstruction is used to illustrate the effect of the proton reconstruction to the width of . Also shown is the width of the state when the mass is fixed to the PDG value [6]. The latter approach was used in most experiments in order to improve the mass resolution.
An additional material in front of a tracking device leads to a significant rescattering, as illustrated in Fig. 1. Obviously, this is reflected in worsening of the resolution. In addition, this may affect the proton-track reconstruction efficiency, since a reconstruction program has to make the decision about whether the proton track belongs to a “primary-track” category or not (assuming that the is a strong decay). However, without a realistic Monte Carlo simulation, to estimate such an effect is rather difficult.
Even although our simulation represents a rather simplified situation, ignoring many details of a realistic track reconstruction, the resulting width values of and are rather sensible. We illustrate this using two similar experiments at HERA, ZEUS and H1. The ZEUS resolution (from a Monte Carlo simulation) is , while the amount of material in front of the central tracking is cm [12] of aluminum. This agrees with resolution given in the Table 1 (forth column for cm).
For the , ZEUS fits the peak using two Gaussian distributions with a common peak position. The first Gaussian has the width of about and describes the main peak, while the second Gaussian with the width of describes the tails (which typically contain about 27% of all reconstructed candidates) [1]. Thus, the total mass resolution is and it can reasonably be approximated by the first Gaussian. As a cross check, the Half Width at Half Maximum (HWHM) was calculated using the plot shown in [1] to restore the Gaussian width of the signal. The width was found to be around , and agrees with the single-Gaussian width for given in a previous ZEUS publication [13]. The ZEUS mass resolution reasonably agrees with the width given in Table 1 for cm.
In case of H1, the mass peak has the width of , two times larger than for ZEUS. This was obtained by analysing the HWHM of the mass distribution shown in [2]. The quoted RMS for the mass spectrum is [14]. This width is equivalent to twice larger amount of inactive material, as it follows from Table 1. Indeed, H1 has an additional detector in front of the central tracking[2] which was absent in ZEUS case.
Table 2 demonstrates the relationship between the mass resolutions and the conclusions from the searches in the experiments which have studied identical reactions. It is obvious that the experiments with positive evidence for the state have better tracking resolution222ZEUS has also higher statistics for the combinations compared to H1. than those which have null evidence. The resolution can be translated to the resolution expected for the state using Table 1. For example, for the quoted above values, the resolutions of are and 5–6 MeV for ZEUS and H1 case, respectively. These numbers from our simulation agree with those quoted in ZEUS and H1 papers [1, 2].
It is conceivable that the different conclusions on the existence of the state may be related to differences in the mass resolution, which determines the observed peak width in case of narrow resonances. Below we will study the dependence of the statistical significance of the signal observation on its width in case of a large background.
3 Statistical significance and the peak width
There are several ways to define the statistical significance, , of an observed signal. We will use the most practical definition, which is often used in experimental papers. We define through the ratio of the total number of reconstructed signal entries, , divided by its error , i.e. as . The numbers and can be found from a fit using a Gaussian plus a background function. The standard deviation, , provides a best estimation for the statistical error [15] and therefore often the statistical significance is quoted in the form . We do not use the definition of in terms of the probability of the background to fluctuate to a “signal” with a certain number of observed events, since such a definition would require a significant computational time for the studies to be discussed below.
The statistical significance of a signal observation depends on several factors, and the most crucial are: 1) the production cross section; 2) the background level under the peak; 3) experimental resolution; 4) the shape of the background. Below we will consider somewhat simplified situation, assuming that a Gaussian-like signal is located on a smoothly falling convex-like background, since this is the most common situation for many experiments. The location of the signal is assumed to be known. The case when the signal is expected on a background hump is more difficult and, in some cases, could be avoided by changing selection cuts.
The statistical significance is usually expressed via the numbers of the signal events and the background events. Thus, such a definition does not contain explicitly the signal width. Therefore, we will use different variables for our analysis. We define as the density of the background at the mass region where the signal is expected. It is calculated as the number of combinations at the expected location of the peak position divided by the bin width. The does not depend very strongly on the shape of the background in the signal region, assuming that the signal is narrow and the background is sufficiently smooth. This variable is determined by the available statistics and combinatorial background contributing to the invariant mass.
Another independent variable, , is the ratio of the number of expected signal events over the background density, . This variable can be calculated from the expected signal cross section, available luminosity and acceptance. It should be noted that we do not use the definition of the fraction as the number of signal events divided by the number of background events under the peak. In this case, such a definition will have a dependence on the peak width, . This has to be avoided; the peak width will be another independent variable.
Our task is to obtain a relationship between and three independent variables, , and . For this, we have carried out several Monte Carlo “experiments” by generating background distributions combined with a Gaussian signal with a fixed peak position at . The shape of the background was taken from [1, 2]; in fact, such a threshold shape is rather typical for many searches. The width of the Gaussian distribution was varied between 3 MeV and 14 MeV. The fraction of the signal events, , and the background density were also varied in a wide range. For each generated distribution with the background plus the Gaussian signal, the statistical significance was estimated by fitting the peak using exactly the same functions as those used to generate the mass spectra. To reduce the number of unstable fits, the peak position was fixed to the expected value during the fit procedure.
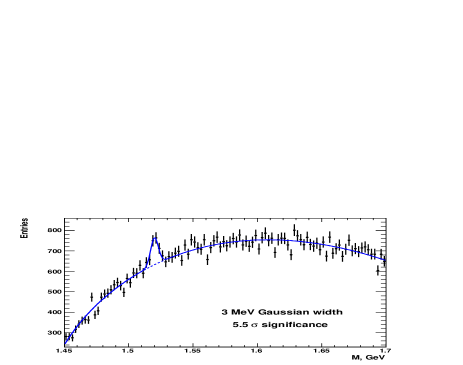
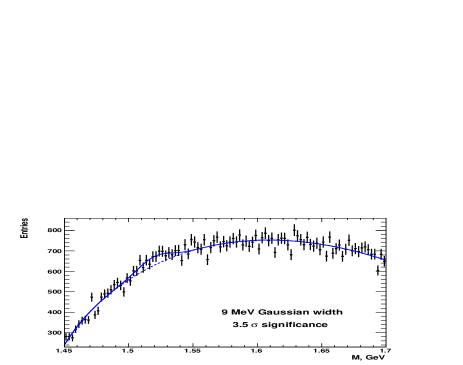
Figure 2 shows the mass distributions simulated using a threshold function plus a Gaussian with the peak widths 3, 6 and 9 MeV, respectively. The statistical significance, under the assumption that the location of the signal is known, was estimated by performing a Gaussian fit plus the threshold function. The fraction of the signal events, as well as the total number of the background events, was the same in all cases. It is seen that the statistical significance decreases with increase of the peak width; for , one can claim a discovery, while for , the statistical significance of the observation is low.
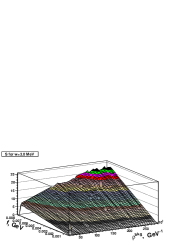
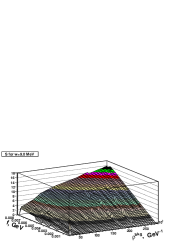
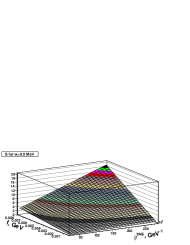
Figure 3 shows the calculated statistical significance as a function of and for 3 MeV and 9 MeV widths, respectively. The statistical significance was estimated as for Fig. 2, i.e. using a fit with the Gaussian distribution to extract the number of the signal events. As expected, increases with increase of and . The irregularities seen in Fig. 3 are due to unstable fits, when the resulting Gaussian width is different from the expected width by a factor two. In such cases, the statistical significance was set to zero. The fraction of unstable fits was , and it increases at small and .
For a fixed peak width , the statistical significance as a function of the variables and can be fitted using the function:
| (1) |
Figure 3 shows the fit results using the above function (bottom plots). The function gives a reasonable fit with typical values for the around 0.9–1.4.
Next, and as functions of were fitted using a second order polynomial. This ultimately leads to the following parameterisation of the statistical significance as functions of , and
| (2) |
where , , , , and (here we drop unites for simplicity). This parameterisation is expected to be correct within accuracy in a region close to the usual discovery threshold of , and when is much smaller than the convex radius of the background shape. For very large values of or a very complex background shape it may fail. Using Eq. (2), one can easily reproduce the significance numbers shown in Figure 2.
Thus, for a known background density, the expected signal fraction (or cross section) and the expected signal width (which could be due to the detector resolution, a natural peak width or combinations of both), one can predict the expected signal significance for a convex-like background. This does not require a Monte Carlo simulation.
4 Analysis of similar experiments searching
for the bump
The previous analysis can directly be applied to the experiments searching for the state. Let us consider the case when the production cross sections are expected to be the same, while two experiments have different conclusions on the existence of the state, as in case of the ZEUS and H1 experiments. The ZEUS experiment [1] observes a narrow peak near 1522 GeV, while H1 does not see it [2]. In ZEUS case, and , assuming the most conservative single-Gaussian fit which does not take into account the background shape near the peak333The double-Gaussian fit leads to a larger number of candidates and to a higher statistical significance.. The observed width was MeV (see Table 1 in [1]).
At this moment, it is only possible to compare ZEUS and H1 resolutions from Monte Carlo simulations. For ZEUS, the resolution is [1], while it is close to [16, 2] near for H1. For a conservative estimate, we assume that the Monte Carlo simulation turns to underestimate the resolution and the width observed by ZEUS is totally accounted for by the tracking resolution (the natural width of is tiny in this case). Using the above input values and the parameterisation Eq. (2), one obtains the statistical significance of . This is close to the statistical significance for the quoted in the ZEUS paper, taken into account the experimental uncertainty on the extracted width.
In H1 case, width is a factor two larger than in ZEUS case, and this can lead to the mass resolution close to (see Table 1). Again, assuming that has a tiny width, this resolution number should define the peak width. If one sets the background density as in H1 case, [2], while keeping as in the ZEUS case, one obtains , which is low statistical significance observation. It has to be also noted that the fraction of unstable fits is around for the width of 10 MeV, while this fraction is in case of 5 MeV width. This means that the fit will not converge at all in cases, even when the peak position is fixed to the expected value during the Gaussian fit.
When H1 uses the ZEUS cut on the proton momentum to increase the proton purity [2], this leads to a significant decrease in the available statistics for H1: In this case, . With the same as in ZEUS case, one obtains the statistical significance of in accordance with Eq. (2). This value is similar to that estimated for the larger . The small sensitivity of the significance to the background density is due to a smallness of the second term in Eq. (1) when .
Thus, the signal can easily be missed in H1 case, even in the simplest case when the expected cross section, detector acceptance and statistics are the same as for ZEUS. Indeed, the limit on the cross section which has been set by H1 [2] is similar to the cross section measured by ZEUS [17].
The situation could be different if the reconstructed width is mainly determined by the natural width of . In this case, the differences between the H1 and ZEUS tracking are not so important.
A similar consideration is applicable for the SVD-2 and SPHINX experiments [3, 4]. The SVD-2 experiment has the mass resolutions almost factor of two better than SPHINX, see Table 2. Therefore, if all other experimental conditions are similar, the statistical significance for the state is expected to be higher for the SVD-2 experiment.
5 Conclusions
We have shown how the width of a Gaussian-like signal is related to the observed statistical significance in case of a large convex-like background. This observation has a direct consequence for many experiments if the reconstructed width of the signal is mainly determined by the tracking resolution. With the exception of colliding experiments in which the baryon production is expected to be more suppressed compared to proton-initiated reactions, at present, there are two groups of similar experiments which have opposite conclusions on the existence of state in the channel: H1 and ZEUS (at DESY) [1, 2] and SVD-2 and SPHINX (at IHEP) [3, 4]. We have shown that the ZEUS and SVD-2 experiments, which observe a peak near 1530 MeV, have better mass resolutions for () and invariant masses than the H1 and SPHINX experiments. Taking into account the observed relationship between the signal width and the tracking resolution, this fact increases the chances of ZEUS and SVD-2 to find the narrow signal. We have shown that the worsening of the tracking resolution for the searches is the penalty the experiments have to pay if a significant inactive material is located in front of tracking devices.
It has to be noted that this approach cannot be applied blindly to all experiments which observe or do not observe the signal, since such experiments may have very different acceptance, background shape and the production mechanism in the reaction under study. The approach could help to explain differences in experimental results if the kinematics and the production cross section are known to be similar.
Acknowledgements
The authors are grateful to P.F. Ermolov, E. Lohrmann and K. Daum for reading the paper draft, comments and useful discussions. The work of B.B.L. is partially supported by the Russian Foundation for Basic Research under grant no. 05-02-39028gfen-a.
References
- [1] ZEUS Collaboration, S. Chekanov, et al., Phys. Lett. B591 (2004) 7
- [2] H1 Collaboration, A. Aktas, et al., Phys. Lett. B639 (2006) 202
- [3] SVD Collaboration, A. Aleev, et al., Phys. Atom. Nucl. 68 (2005) 974
- [4] SPHINX Collaboration, Y. M. Antipov, et al., Eur. Phys. J. A21 (2004) 455
- [5] D. Diakonov, V. Petrov, M. V. Polyakov, Z. Phys. A359 (1997) 305
- [6] PARTICLE DATA GROUP Collaboration, W. Yao, et al., J. Phys. G 33 (2006) 1
- [7] ZEUS Collaboration, S. Chekanov, et al., 2005, paper contributed to the LP05 and EPS05 Conferences, Abs. 277,369, available on http://www-zeus.desy.de/physics/phch/conf/lp05_eps05/
- [8] Y. Azimov, K. Goeke, I. Strakovsky, hep-ph/0704.3045 (2007)
- [9] S. Chekanov, Eur. Phys. J. C44 (2005) 367
- [10] S. Chekanov, PoS HEP2005 (2006) 086
- [11] GEANT4 Collaboration, S. Agostinelli, et al., Nucl. Instrum. Meth. A506 (2003) 250
- [12] ZEUS Collaboration, S. Chekanov, et al., Preprint hep-ex/0705377, 2007, DESY 07-070
- [13] ZEUS Collaboration, S. Chekanov, et al., Phys. Lett. B578 (2004) 33
- [14] H1 Collaboration, C. Adloff, et al., Z. Phys. C76 (1997) 213
- [15] V. Blobel, E. Lohrmann, Statistische und Numerische Methoden der Datenanalyse, in Teubner-Studienbücher Physik. B.G. Teubner, Stuttgart,Leipzig (Germany), 1998. In German
- [16] K. Daum. Private communication
- [17] ZEUS Collaboration, S. Chekanov, et al., 2005, paper contributed to the LP05 and EPS05 Conferences, Abs. 290,392, available on http://www-zeus.desy.de/physics/phch/conf/lp05_eps05/.
| (cm) | MeV | MeV | MeV | MeV |
|---|---|---|---|---|
| 0.3 | 4.23 | 3.84 | 2.93 | 1.38 |
| 0.4 | 5.10 | 4.89 | 3.38 | 1.57 |
| 0.5 | 5.79 | 5.79 | 3.99 | 1.82 |
| 0.6 | 6.31 | 6.78 | 4.32 | 1.84 |
| 0.7 | 6.60 | 7.43 | 5.49 | 1.90 |
| 0.8 | 7.69 | 8.82 | 5.19 | 2.05 |
| 0.9 | 8.05 | 9.65 | 5.95 | 2.09 |
| 1.0 | 8.33 | 11.46 | 5.97 | 2.28 |
| Experiment | reaction | width, MeV | signal |
|---|---|---|---|
| ZEUS[13] | 4.0 | Yes | |
| , =300 GeV | 1.9 | ||
| H1[14] | 9.2 | No | |
| 2.9 | |||
| SVD-2[3] | 0.08 | Yes | |
| 70 GeV | 0.04 | ||
| SPHINX[4] | 8.4 | No | |
| 3.8 |