On the formation of TeV radiation in LS 5039
Abstract
The recent detections of TeV gamma-rays from compact binary systems show that relativistic outflows (jets or winds) are sites of effective acceleration of particles up to multi-TeV energies. In this paper, we discuss the conditions of acceleration and radiation of ultra-relativistic electrons in LS 5039, the gamma-ray emitting binary system for which the highest quality TeV data are available. Assuming that the gamma-ray emitter is a jet-like structure, we performed detailed numerical calculations of the energy spectrum and lightcurves accounting for the acceleration efficiency, the location of the accelerator, the speed of the emitting flow, the inclination angle of the system, as well as specific features related to anisotropic inverse Compton (IC) scattering and pair production. We conclude that the accelerator should not be deep inside the binary system unless we assume a very efficient acceleration rate. We show that within the IC scenario both the gamma-ray spectrum and flux are strongly orbital phase dependent. Formally, our model can reproduce, for specific sets of parameter values, the energy spectrum of gamma-rays reported by HESS for wide orbital phase intervals. However, the physical properties of the source can be constrained only by observations capable of providing detailed energy spectra for narrow orbital phase intervals ().
1 Introduction
LS 5039 is a binary system consisting of a very bright star and a compact object (a neutron star/pulsar or a black-hole). The source emits X-rays (see e.g. Bosch-Ramon et al. (2007) and references therein; Goldoni et al. (2006); De Rosa et al. (2006)), and presumably also MeV (Strong et al., 2001) and GeV (Paredes et al., 2000, 2002) gamma-rays. Recently, LS 5039 has been detected in very high energy (VHE) gamma-rays by the HESS array of atmospheric Cherenkov telescopes (Aharonian et al., 2005). The TeV radiation of the source is clearly modulated with a period days (Aharonian et al., 2006a), which perfectly coincides with the orbital period of the object (Casares et al., 2005).
The nature of the compact object in LS 5039 is not yet firmly established, given the uncertainty related to the orbital inclination angle, , which does not allow precise estimate of its mass. The optical line analysis, together with the assumption of orbital pseudosynchronization favour a rather small inclination angle, (Casares et al., 2005). This would be an indication of a rather high mass for the compact object, , and therefore could be interpreted as an evidence for its black-hole nature. In such a case, one would expect the realisation of the microquasar scenario, in which the nonthermal processes take place in a jet related to an accreting compact object. The original classification of LS 5039 as a microquasar was based on its extended radio emission features (Paredes et al., 2000). In the framework of this scenario, a number of models have been proposed to explain the TeV gamma-ray emission of LS 5039 based on both leptonic and hadronic interactions (e.g. Dermer & Böttcher (2006); Aharonian et al. (2006b); Paredes et al. (2006); Bednarek (2007)). At the same time, a scenario in which the nonthermal radiation is related to an ultrarelativistic pulsar wind, remains an alternative option (Dubus, 2006a). In this scenario, LS 5039 would behave in a similar manner to the binary pulsar systems (e.g. PSR B1259-63/SS2883), where the production site of gamma-rays is (most likely) related to the pulsar wind termination shock (Maraschi & Treves, 1981; Tavani & Arons, 1997; Kirk et al., 1999; Khangulyan et al., 2007). Whereas in the microquasar scenario, the particle acceleration and gamma-ray production are possible throughout the entire jet (i.e. both inside and outside of the binary system), in the standard pulsar wind model the particle acceleration and radiation take place well inside the system (Dubus, 2006a), namely at distances from the compact object much smaller than the separation between the stars, i.e. (Casares et al., 2005).
The discovery of modulated TeV gamma-ray emission in LS 5039 is a strong indication that gamma-rays are produced close to the binary system. On the other hand, if the gamma-ray production region is located inside or very close to the system, we expect distinct photon-photon absorption features caused by the interaction between the gamma-rays and the stellar radiation field. Within the leptonic models for gamma-ray production, two other effects have a strong, direct or indirect, impact on the formation of the gamma-ray spectrum. One effect is related to the anisotropic IC scattering; the other effect is related to the maximum energy of relativistic electrons determined by the balance between the acceleration and radiative cooling rates. Finally, the production and gamma-ray absorption processes should be coupled with an appropriate treatment of the particle cooling and propagation (e.g. particle diffusion and advection along the jet). Thus, in the context of leptonic models, the spectral shape of the gamma-ray emission, in particular its orbital phase-dependence, contains unique information about the location of the particle acceleration and gamma-ray production regions.
In what follows, we show that the spectral and temporal features of the VHE gamma-radiation reported by HESS from LS 5039 can be reproduced with a leptonic model that invokes anisotropic IC scattering of electrons and absorption of gamma-rays under certain requirements concerning the location and efficiency of the electron accelerator.
2 Physical processes in the system
2.1 Radiation and acceleration processes
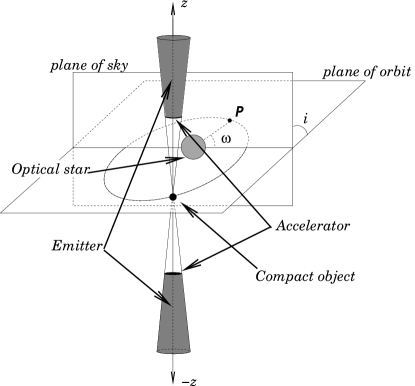
The gamma-ray spectrum of LS 5039 extends to very high energies, up to TeV and beyond (Aharonian et al., 2006a). Since the parent electrons should have even higher energies, the acceleration of TeV electrons requires rather special conditions, especially if the radiation is formed inside the binary system, where electrons suffer strong IC energy losses (Aharonian et al., 2006b). Assuming for simplicity that the gamma-ray emitter is a jet-like structure111The assumption on the jet-like structure here does not necessarily mean adopting the microquasar scenario (i.e. an accreting system with a jet). In fact, a jet-like structure could also be produced in other types of object, e.g. in binary pulsar systems (Bogovalov et al., 2007). perpendicular to the orbital plane, one derives the energy density of the stellar radiation field in the emitting region: , where is the star luminosity and is the distance to the compact object.
A sketch of the geometry of the system is shown in Fig. 1. The radiation of the companion star in LS 5039 is characterised by a black-body spectrum of temperature eV and luminosity (Casares et al., 2005). Since cannot be much larger than the orbital distance (otherwise the periodic component of radiation would be smeared out), the energy density of the target photons typically varies between at , and at the base of the jet around periastron.
The IC scattering of TeV electrons on the starlight photons of average energy eV takes place deep in the Klein-Nishina (KN) regime. The characteristic cooling time of electrons in this regime can be approximated with good accuracy as (Aharonian et al., 2006b):
| (1) |
where is the electron energy in TeV units, , and . The maximum acceleration energy of electrons is achieved when the cooling time approaches the acceleration time (), which it is convenient to present in the following general form:
| (2) |
where is the Larmor radius, and is the strength of the magnetic field in the accelerator. The parameter characterises the acceleration efficiency. Generally, , and only in so-called extreme accelerators (Aharonian et al., 2002). From the condition one obtains:
| (3) |
Formally, for an extreme accelerator () and , the maximum energy of electrons can, under KN IC energy losses, exceed 100 TeV even for a radiation energy density . However, for such a magnetic field strength in the accelerator, synchrotron energy losses dominate over the Compton losses. The synchrotron cooling time is:
| (4) |
thus the condition gives:
| (5) |
Another fundamental condition, , where is the location of the accelerator and taken as an upper-limit of its linear size (), gives:
| (6) |
where .
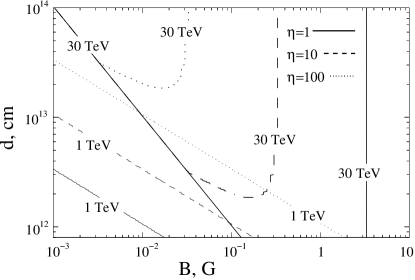
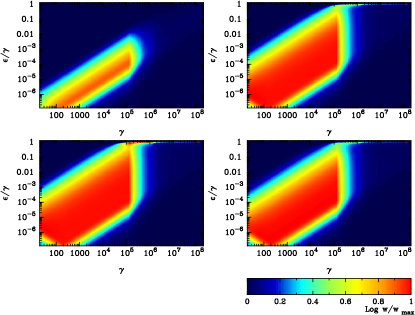
In Fig. 2 we show the maximum-energy contour plot in the parameter plane based on the conditions given by Eqs. (3, 5, 6). The curves correspond to three values of the parameter: and 100. It is seen that electrons can be accelerated up to TeV energies deep inside the binary system ( cm, i.e. ) only in the case of an extreme accelerator with . It is worth noting that in dense radiation environments the acceleration efficiency can be significantly enhanced through the so-called converter mechanism (Derishev et al., 2003; Stern, 2003). Therefore, quite small values of the acceleration efficiency, i.e. , cannot be a priori excluded.
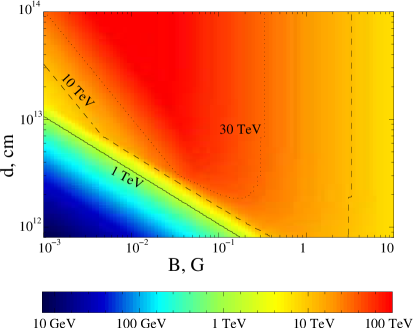
In Fig. 3, we show the maximum electron energy map in the plane for . It is seen that for , electrons can be accelerated to energies TeV only in an environment with G located at cm.
The hardness of the HESS reported spectra of gamma-rays allows us to put constrains on the magnetic field strength in the emitter. Namely, the reported photon indices, ranging from , indicate that the magnetic field energy density in the emitter should be significantly smaller than the target photon energy density. Indeed, if these gamma-rays are produced via IC scattering, the electron differential spectrum must be harder than . For dominant synchrotron cooling, the electron energy distribution at high energies is softer than . Even in case of a monoenergetic injected electron spectrum, synchrotron cooling results in a type electron energy distribution. However, IC energy losses taking place in the KN regime allow such a harder than electron energy distribution. Thus, hard VHE spectra require , or
| (7) |
for the magnetic field in the emitter.
2.2 Propagation of electrons
Relativistic electrons can propagate along the jet. In such a case, their energy cooling proceeds under changing physical conditions. This can have a strong impact on the resulting gamma-ray radiation. We consider here two possible transport mechanisms: diffusion and advection along the jet. The propagation length depends on the diffusion coefficient , on the bulk velocity of the jet (or advection velocity) , and on the radiation cooling time . The particle transport is important when the propagation distance is comparable to the separation between the injection point and the compact object (). Thus, the particle transport can be described by a dimensionless parameter , which is dominated, depending on the propagation regime, by or . The diffusion length , thus:
| (8) |
where is the diffusion coefficient in the Bohm regime, and is the electron energy in TeV units. Thus, electron diffusion has no impact on the TeV radiation, unless the diffusion is far from the Bohm regime () or the magnetic field is very small in the emitter. For advection we obtain:
| (9) |
when energy losses are dominated by IC scattering, and
| (10) |
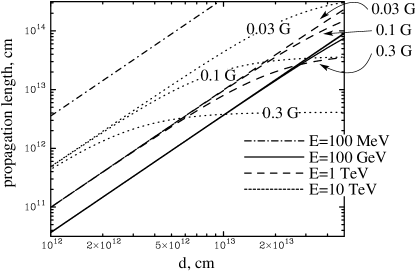
for dominant synchrotron energy losses. Therefore, for a mildly relativistic outflow ( cm/s), can easily exceed 1 under dominant KN IC energy losses. In Fig. 4, the results of the electron advection length calculations are shown for four different energies MeV, GeV, 1 TeV, and TeV. Here we consider a cm/s. Three constant values of the magnetic field were considered: , , and G. The radiation field was assumed to be black-body with K, and energy density corresponding to that of the star at distance (i.e. dilution coefficient , where cm). As seen in Fig. 4, electrons with energy GeV have the shortest advection length. Due to cooling in the Thomson regime (), electrons with smaller energy have a longer propagation length. In case of higher electron energy ( GeV), IC cooling proceeds in KN regime, leading to an increase of the propagation length with the growth of the electron energy unless synchrotron energy losses start to dominate. All this is clearly seen in Fig. 4.
As discussed above, the parameter varies over a rather wide range depending on the electron energy and the accelerator-companion star separation distance. Thus, high energy electrons can propagate far away from the acceleration site. In the next section we show that this effect can significantly change the gamma-gamma optical depth for the produced VHE radiation and the IC scattering angle between electrons and target photons.
2.3 IC and gamma-gamma absorption

Because of the strong anisotropy and inhomogeneity of the target photon distribution, IC scattering and gamma-gamma absorption depend on the electron location and momentum direction. Regarding IC scattering, the interaction angle has a strong impact on the formation of radiation as shown in the past by several authors in different astrophysical scenarios (e.g. Bogovalov & Aharonian (2000); Khangulyan & Aharonian (2005a, b); Dermer & Böttcher (2006)). In Fig. 5, we show the IC spectral energy distribution (SED) produced by a monoenergetic distribution of electrons of TeV interacting with photons with a black-body distribution ( K) at different angles ranging from to . It is seen that, depending on , for electron energies , the IC scattering can proceed either in the KN () or in the Thomson () regimes. In In Fig. 6, we show the computed SED corresponding to the IC scattering between electrons with a powerlaw energy distribution and photons with a black-body distribution ( K). Results are shown for different ranging from to . Since the interaction angle strongly varies along the orbit and with , the final gamma-ray spectra significantly depend on the orbital phase and location of the emitter. Fig. 7, we show a two-dimensional representation of the IC scattering probability in the plane (,; where is electron Lorentz factor and is the outgoing photon energy) for three different , and , which are shown altogether with the average cross-section case. Depending on the electron distribution function, the IC anisotropy could have a different impact on the gamma-ray spectrum. In the case of a monoenergetic or narrow electron distribution (e.g. -function) around 0.1 TeV () the IC scattering at high interaction angles results in higher fluxes and harder spectral shapes (see Fig. 5). For broad (e.g. power-law) electron distributions, IC scattering at small interaction angles leads to a rather low flux, but the spectral shape is harder than for large scattering angles. The hard spectral shape is due to a transition from the Thomson, in which the scattering is sensitive to the interaction angle, to the KN regime, in which the angular dependence is weak. We note that the smaller the interaction angle, the larger the transition energy.

The gamma-ray absorption in close binaries was studied by, e.g., Moskalenko & Karakula (1994), Böttcher & Dermer (2005) and Dubus (2006b). In general, the gamma-gamma optical depth depends on the distance between the emitting electrons and the companion star, and on the scattering angle (assuming a point-like source of target photons) :
| (11) |
where is the angle between the directions of the gamma-ray and the stellar photon at distance from the emitting point. The absorption probability strongly depends on the interaction angle. This is shown in Fig. 8, where the probability of gamma-gamma absorption on a monoenergetic distribution of target photons ( eV) is plotted for the interaction angle . Concerning the -dependence of the optical depth, in the point-like approximation for the geometry of the target photon source, the gamma-gamma optical depths for arbitrary and can be scaled as:
| (12) |
From previous considerations, the smaller the harder the produced radiation. In addition, since implies also in Eq.(11), the threshold energy for gamma-gamma absorption significantly increases up to GeV. Both effects result in hard and unabsorbed gamma-ray spectrum above 1 TeV.

2.4 Radiation of secondary electrons
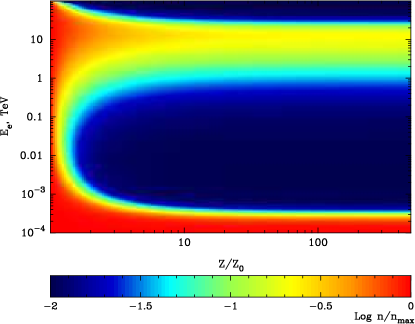
The interaction of gamma-rays with the stellar radiation field produces a population of secondary electron/positron pairs (secondary electrons hereafter) inside the binary system. A significant fraction of the primary gamma-ray energy can be transfered to these particles. In Fig. 9, we show an example of the fraction of gamma-ray energy absorbed in the radiation field of the star. Assuming an isotropic point-like emitter located at distance from the optical star, we calculate the absorbed fraction of primary gamma-ray energy in the energy range TeV (for a spectrum of primaries). One can see that, even for an emitter located rather far from the star, radiation of secondaries can significantly contribute to the observed emission from the source. The secondary electrons radiate via the synchrotron or IC channels. The ratio of these fluxes depends on the energy band, the magnetic field strength and the distance to the companion star. This effect may lead to the formation of an electromagnetic cascade as long as the energy of electrons and gamma-rays exceeds a certain energy:
| (13) |
For the effective development of the cascade, IC energy losses should dominate over synchrotron energy losses. From Eqs. (1) and (4) one obtains:
| (14) |
or
| (15) |
where is the energy density of the ambient magnetic field in the system, which is distinguished here from the magnetic field inside the emitter. This relation allows us to introduce a critical value of the magnetic field in the binary system:
| (16) |
where is the distance between the gamma-ray absorption point and the star. If the magnetic field is stronger than , the electromagnetic cascade will not affect the energy range TeV, implying a purely absorbed spectrum for TeV.

Although the magnetic field within the system is unknown, the magnetic field at the surface of O type stars can be typically G – kG (see e.g. Usov & Melrose (1992); Donati et al. (2002)). Taking into account the value of (see Eq. (16)), efficient cascading at TeV seems unlikely. For such magnetic fields, synchrotron emission is the main radiation channel at these energies, and electromagnetic cascading will be suppressed.
3 Model description

In this work, we adopt a model for gamma-ray emission in LS 5039 in which emission is produced in a jet-like structure perpendicular to the orbital plane. Also, we assume that the acceleration takes place in a compact region located in the jet at ( although the emitting region could be much larger because of particle advection) and does not depend on the orbital phase. In Fig. 1, the accelerator and the emitter are shown as a black and a grey region, respectively.
The acceleration/cooling time-scales in the system are much shorter than the orbital period. Therefore, the electron distribution function can be described by a steady-state equation. In the case of an one-dimensional jet, is determined by the following equation:
| (17) |
where the is the jet bulk velocity; is the electron energy loss rate, which accounts for IC and synchrotron mechanisms and depends both on the electron energy and position in the jet; is the location of the accelerator; and is the injection electron spectrum. We note that and are slow functions of time, i.e. they vary adiabatically along the orbit. Because of a lack of knowledge concerning the acceleration processes occurring in LS 5039, we adopt a phenomenological function for . Namely, we assume a power-law function with an exponential high-energy cutoff:
| (18) |
is the electron cutoff energy determined from the balance between acceleration and energy loss rates (see Sec. 2.1); is fixed to 2, which is a common value for injected spectra of non-thermal electrons, and is a constant.
We have numerically solved Eq. (17) taking into account IC and synchrotron radiation processes. We neglect at this stage ionization or Bremsstrahlung losses because they are not relevant in the present context. We assume that the main targets for IC scattering are provided by the star, and that the magnetic field decreases with the distance as . In order to accelerate electrons to energies 10 TeV the magnetic field should be within G, depending on the acceleration rate and location (see Fig. 2).
To study the impact of the magnetic field on the IC and synchrotron radiation components, three different , and G have been adopted. The rest of relevant parameters have been fixed to the values: cm, , cm/s, and . The corresponding broadband SED is shown in Fig. 10. We note a very hard synchrotron spectra in the interval keV – MeV (with a spectral energy index ). This is explained by the hardening of electron energy distribution due to the radiative cooling in KN regime (Khangulyan & Aharonian, 2005a; Moderski et al., 2005). Since for magnetic fields G the energy losses are dominated by IC scattering, the synchrotron radiation flux is significantly less than the IC gamma-ray flux, and below also the observed fluxes at X-rays (Bosch-Ramon et al., 2007).
It is worth discussing the importance of the electron propagation, already commented on in Sec. 2.2. Namely, we expect the most efficient propagation of electrons at very low (Thomson regime) and at very high (deep KN regime) energies as long as IC energy losses dominate over synchrotron ones. In Fig. 11, we show the distribution of electrons along the jet. It is seen that, the higher the energy, the larger the propagation length of electrons. This is simply the result of the KN effect. However, for the assumed magnetic field, this tendency terminates around 30 TeV, when the IC energy losses are overcome by the synchrotron ones. We note also that, below GeV, the lower the energy, the longer the propagation length of electrons, because in this energy interval the IC scattering occurs in the Thompson regime.
In fact, electrons at large will interact with weaker magnetic and stellar radiation fields, thus it is convenient to introduce a parameter which characterises the effective electron average location:
| (19) |
The -dependence of this effective electron average location is shown in Fig. 12, where the -weighted average locations of the electrons of different energy are shown for three different , , and cm. G and cm/s are adopted for all three cases222We recall (see Eq. 8) that diffusion is negligible for these parameter values.. The -weight comes from the fact that the stellar radiation field decreases as , giving an idea on where electrons of a certain energy will radiate the most via IC. We see that significantly depends not only on the energy but also on the location of the accelerator.
This rather unusual energy-dependence of the propagation of electrons in the jet can be reflected in the features of the electron radiation. We note, however, that the spatial distribution of the gamma-rays along the jet does not simply repeat the distribution of electrons. Two additional effects, related to the interaction angle in the IC scattering and gamma-gamma absorption, lead to a significant modification of the gamma-ray effective distribution along the jet. These effects are shown in Figs. 13 and 14, respectively.

Finally, we want to emphasise the impact of the angular dependence of the IC scattering on the observed spectrum. The importance of this effect for the IC SED is demonstrated by Fig. 15. The two curves shown in this figure are obtained under different assumptions. Whereas curve 1 is calculated using the angle-averaged Compton cross-section, curve 2 is calculated using the precise angular dependent cross-section and the exact interaction geometry, being averaged over the orbital phase interval (see Sec. 4).


4 Results
We now apply the model developed in the previous section to LS 5039. We have computed the SED and the orbital lightcurves for different relevant situations. Some of the SED presented here are calculated for the inferior conjunction of the compact object, i.e. (infc; when the compact object is between the observer and the companion) and the superior conjunction, i.e. (supc; when the compact object is behind the companion star with respect to the observer). HESS has reported on the temporal and spectral characteristics of the emission from LS 5039 (Aharonian et al., 2006a). Because of the lack of statistics, HESS has reported the SED for two different phase intervals: (infc); and (supc). In order to explore the model parameter space by comparing the calculations with the HESS data, some of the calculated SED are averaged over the same phase intervals.
4.1 Exploring the model parameter space
In this section, we fix G, which is weak enough to provide a radiation dominated environment for TeV electrons (see Eq.(7)). We also assume a high acceleration efficiency with , required by the extension of the HESS reported spectrum well beyond TeV (see Fig. 2). Given the discussions in previous sections, we assume the following values for the remaining parameters: cm; cm/s; and . We compute the gamma-ray SED for infc and supc. These are two distinct phases with very different physical conditions for gamma-ray production and absorption. For instance, the maximum gamma-ray absorption (and the minimum of this process) occurs in supc.


In Fig. 16, we show the gamma-ray SED when the electron propagation is negligible, i.e. cm/s, for two different , and cm. This relatively slow advection velocity implies that the gamma-rays are produced at . As seen from Fig. 16, for small inclination angles (left panels), there are no strong spectral differences between supc and infc, and the orbital lightcurve is rather flat, as shown in Fig. 17 (left panel). This is caused by the small changes in the angle of interaction for . We note that the orbital lightcurve would peak more strongly around apastron passage for slightly larger , because of the strong -dependence of the highest energy gamma-rays for the adopted . We note that the counter-jet impact is not strong for low inclination angles but below GeV, because its VHE emission is strongly absorbed. This jet dominance is a purely geometrical effect in the IC interaction and gamma-gamma absorption. For high inclination angles, the interaction and absorption angles change significantly yielding strong spectral and flux variations along the orbit, as shown in Fig. 17 (right panel). Two remarkable features are a double-bump orbital lightcurve, which is already significant at , and a more relevant VHE counter-jet for due to weaker gamma-ray absorption for this component.

For an advection velocity cm/s and a fixed , the dependence of the results on is demonstrated by Fig. 18. For cm (left panels), fast IC energy losses around periastron prevent efficient electron acceleration beyond 1 TeV unless . A result of this effect is a strong steepening in the highest energy part of the unabsorbed SED at supc, and as a dip in the orbital lightcurve around the same phase, as shown in Fig. 19 (left panel). For cm, gamma-ray absorption deforms the observed SED and the orbital lightcurve strongly, producing a maximum in the lightcurve around infc, , although orbital changes of shift the maximum of the emission to slightly earlier phases. For larger , e.g. cm (Fig. 18, right panels), the effect of gamma-ray absorption becomes less relevant, thus only the IC angular dependence determines the shape of the orbital lightcurve yielding a pronounced dip around infc (see Fig. 19, right panel). In this case, the contribution of the counter-jet is significant around infc.


We compute the gamma-ray SED and orbital lightcurves for an order of magnitude faster advection velocity, i.e. cm/s. The other parameters are fixed to cm, G, , and . The results are presented in Figs. 20 and 21. To show the impact of , in Fig. 22 we show the ratios fast flow case ( cm/s) to slow flow case ( cm/s) for the SED (left panel), and orbital lightcurves at different energies ( and 10 TeV; right panel). The SED are averaged over two orbital phase intervals: ; and . For the lightcurves, we focus on the jet radiation because the electron propagation has a weak impact on the counter-jet radiation. As discussed in Sec. 2.2, propagation allows TeV electrons to reach regions for which becomes quite small. This leads to a hardening of the photon spectrum around supc (). Different patterns of variability are seen for different energy bands. We note that for comparison, the three curves are normalised to the same level. At higher energies the emission becomes less variable because the angular dependence of the IC and pair-production cross-sections is weaker than at lower energies.

4.2 Explaining the phase averaged energy spectra of LS 5039
Given the poor time resolution of the experimental data concerning the energy spectrum in LS 5039 ( i.e. high statistic spectra can be only given for two wide orbital phase intervals), we do not intend to make a fit to the HESS data. Nevertheless, below we show that, with a certain choice of key model parameters, we can explain the orbital phase averaged spectra reported by HESS.
In Fig. 23, we present the HESS spectra for two orbital phase intervals (; and ) together with the gamma-ray SED calculated for the following parameters: cm/s, , G, , cm, and an electron acceleration power erg/s. As is seen in Fig. 23, the calculated SED agree reasonably with the data reported by HESS for both phase intervals. Our model shows changes in the flux by a factor along the orbit, similar to the observed ones, and the emission tends to peak around infc. Nevertheless, we note that the lightcurves presented by HESS are derived from fits to the specific flux at 1 TeV. Given the uncertainty of the real observed spectrum, it may well be that the HESS fit lightcurve would be under- or overestimated at that energy, thus we do not carry out a comparison between the observed and calculated lightcurves. We note that some other sets of parameter values could also yield a reasonable agreement with HESS data. Unfortunately, because of the orbital phase averaging, HESS data do not allow us to fix robustly the parameter space. This could be done with time resolved energy spectra obtained within narrow orbital phase intervals (). For similar reasons, we do not show in Fig. 23 the data points of the EGRET source associated to LS 5039 (Paredes et al., 2000) because the data were taken in different epochs and do not contain orbital phase information. Nevertheless, it is interesting to note that the observed (time averaged) ratio GeV (EGRET) to TeV (HESS) fluxes, of about 10, is close to the model results.

4.3 Accelerator deep inside the system
In this section we explore the case when the accelerator is deep inside the system, i.e. . As discussed in Sec. 2.1, only an extreme accelerator with can provide a gamma-ray spectrum extending to TeV. In Fig. 24, we show the SED calculated averaging over two orbital phase intervals (; and ), taking , and G. This case does not depend on the advection velocity. As seen in the figure, we note that the spectrum around supc, i.e. and , can be barely reproduced for any inclination angle, whereas calculations for the phases around infc, , are in reasonable agreement with HESS data, in particular for .
A deep accelerator implies very large optical depths () for photons produced all along the orbit. This leads to an amount of absorbed energy much larger than the one observed in VHE gamma-rays. However, this energy does not disappear, but it is released at other wavelengths. In particular, if the magnetic field in the system is small enough, G (see Sec. 2.4), absorption of gamma-rays will initiate an electromagnetic cascade (Aharonian et al., 2006b; Bednarek, 2007) in the stellar radiation field. In case of a fully developed cascade (), the SED is characterised by a standard shape with a maximum at the threshold , a sharp drop above , and a flat part at . Under an almost monoenergetic, e.g. black-body type, radiation field, the optical depth decreases to larger energies, thus the source becomes optically thin and the energy spectrum at the highest energies is dominated by the unabsorbed intrinsic component. All these features can be seen in Fig. 25, where the cascade SED has been calculated for the supc (non-averaged) case. In LS 5039, the cascade development yields an order of magnitude or larger GeV flux compared to the TeV energy flux. Whereas the flat SED of the cascade radiation could explain the HESS spectral points in the infc phase interval, it hardly matches the steeper spectrum for the supc phase interval.
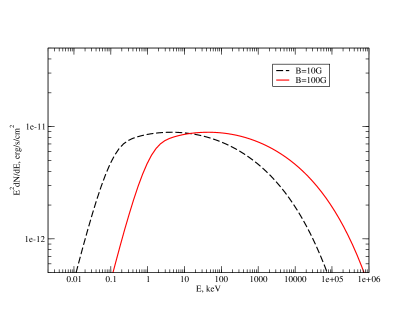
If the magnetic field in LS 5039 exceeds 10 G, the cascade will be effectively suppressed because of dominant synchrotron cooling of the secondary electrons created everywhere in the system. In such a case, the main fraction of nonthermal energy will be released in the X-ray/soft gamma-ray domain. This is shown in Fig. 26, in which the synchrotron radiation is shown for two values of the system average magnetic field: 10 and 100 G. We note that the fluxes shown in Fig. 26 are calculated for an acceleration power of primary electrons , required to explain the TeV fluxes reported by HESS (see Fig. 24). For a system average magnetic field of G, the synchrotron radiation of secondary electrons peaks around 10 keV, with a flux which is close to the observed fluxes (Bosch-Ramon et al., 2007). In the case of a stronger magnetic field (e.g. 100 G), the synchrotron emission peaks in the soft gamma-ray range, being also below the reported fluxes (Strong et al., 2001).


5 Summary
In this paper we present the results of a detailed numerical study of the spectral and temporal properties of the high energy gamma-ray emission from the binary system LS 5039 adopting an IC scenario. The calculations have been conducted in the framework of a specific model which assumes that gamma-rays are produced in a jet-like structure perpendicular to the orbital plane. However, the obtained results and conclusions concerning the electron accelerator and the gamma-ray emitter have broader implications. The sheer fact that we see a modulated gamma-ray signal with a day period, with a hard energy spectrum extending to 10 TeV and beyond, implies that: (a) the gamma-ray emitter is located close to the binary system, i.e. at distances comparable to ; and (b) we deal with an efficient accelerator with acceleration rate not far from the theoretically maximum possible rate, i.e. ( for an accelerator located deep inside the binary system). Another interesting model-independent conclusion is that if the gamma rays have an inverse Compton origin, then we can restrict the magnetic field in the gamma-ray emitter within a quite narrow range. The fact that the IC scattering which produces the TeV photons occurs deep in the KN regime implies that the observed spectrum with photon index requires a very hard electron energy distribution with power-law index . Such a hard spectrum cannot be formed even in the case of a monoenergetic (e.g. Maxwellian type) injection electron spectrum unless they cool through the IC scattering in the KN regime333Synchrotron/Thomson IC cooling would yield a electron energy distribution. (see Eq.(7)). On the other hand the magnetic field cannot be much smaller than 0.1 G in order to provide an adequate acceleration rate. Thus, the accelerator emitter magnetic field should be confined in a band around 0.1 G.
Because of the close location of the gamma-ray emitter to the companion star, the modification of the spectrum of gamma-rays due to the gamma-gamma absorption process is unavoidable. Moreover, gamma-ray absorption strongly depends on the orbital phase. Because of the slightly elliptical orbit, the phase-dependence of the photon density is moderate. However, the orbital change of the interaction angle results in a change in the threshold of the interaction, and thus leads to strong modulation of the optical depth. Interestingly, the energy-dependent modification of the gamma-ray energy spectrum produced by gamma-gamma absorption cannot explain the data reported by HESS for two phase intervals. In particular, whereas one should expect the strongest variation of the gamma-ray flux at GeV; HESS results show just the opposite. Nevertheless, the anisotropy of the radiation field has a strong impact not only on the gamma-gamma absorption, but also on the spectral characteristics of the IC scattering. We show here that the combination of these two effects, both related to the anisotropic character of the interaction of the stellar radiation field with relativistic electrons (IC) and gamma-rays (pair production), can satisfactorily explain the HESS observations reported for the supc and infc phase intervals. In addition, we note that the phase-dependence of the electron maximum energy and the electron advection along the jet could play an important role in the formation of the gamma-ray spectra.
The absorption of gamma-rays does not imply that this energy disappears. The secondary electrons interacting with the stellar radiation and ambient magnetic fields produce secondary radiation. There are two well defined possibilities; either the energy density of the ambient medium is dominated by the stellar radiation field or by the magnetic field. In the former case, pair production and further IC scattering initiate an electromagnetic cascade. In the latter case, synchrotron radiation is produced. As noted above, a typical ambient magnetic field determining the boundary between these two regimes is several Gauss. When an efficient cascade occurs, the source becomes more transparent at very high energies, although the energy is mainly released around the threshold energy GeV. In the case of the suppression of the cascade through synchrotron cooling, the source is less transparent, and synchrotron radiation is released mostly at keV-MeV energies, with luminosities exceeding the VHE gamma-ray luminosity. Interestingly, a G magnetic field is plausible for the surroundings of a massive star, so a priori one cannot exclude any of both possible scenarios, which in fact may be realised simultaneously in different parts of the system. In such a case, both cascading and synchrotron radiation of secondaries would contribute comparably to the emerging high energy radiation. In this regard, future deep X-ray and gamma-ray observations, together with TeV observations with more sensitive instruments capable of spectral measurements on short time scales, will provide insights into the origin of the nonthermal emission of this enigmatic source.
Acknowledgments
Authors are grateful to M. Chernyakova, A. Taylor and the anonymous referee for useful comments. V.B-R. gratefully acknowledges support from the Alexander von Humboldt Foundation. V.B-R. thanks MPIfK for its kind hospitality. V.B-R. acknowledges support by DGI of MEC under grant AYA2004-07171-C02-01, as well as partial support by the European Regional Development Fund (ERDF/FEDER).
References
- Aharonian et al. (2005) Aharonian F., et al., 2005, Science, 309, 746
- Aharonian et al. (2006a) Aharonian F., et al., 2006a, A&A ,460, 743
- Aharonian et al. (2006b) Aharonian F., Anchordoqui L., Khangulyan D., Montaruli T., 2006b, JPhCS, 39, 408, [astro-ph/0508658]
- Aharonian et al. (2002) Aharonian F. A., Belyanin A. A., Derishev E. V., Kocharovsky V. V., Kocharovsky V. V., 2002, PhysRevD, 66, 023005
- Bednarek (2007) Bednarek W., 2007, A&A, 464, 259
- Bogovalov & Aharonian (2000) Bogovalov S., Aharonian F., 2000, MNRAS, 313, 504
- Bogovalov et al. (2007) Bogovalov S. V., Koldoba A. V., Ustyugova G. V., Khangulyan D., Aharonian F., 2007, MNRAS, submitted
- Bosch-Ramon et al. (2007) Bosch-Ramon V., Motch C., Ribó M., Lopes de Oliveira R., Janot-Pacheco E., Negueruela I., Paredes J. M., Martocchia A., 2007, A&A, 473, 545 [astro-ph/0703499]
- Böttcher & Dermer (2005) Böttcher M., Dermer C. D., 2005, ApJ, 634, L81
- Casares et al. (2005) Casares J., Ribó M., Ribas I., Paredes J. M., Martí J., Herrero A., 2005, MNRAS, 364, 899
- De Rosa et al. (2006) De Rosa A., Ubertini P., Bazzano A., Bassani L., Landi R., Malizia A., Stephen J. B., for the IBIS Survey team 2006, ArXiv Astrophysics e-prints
- Derishev et al. (2003) Derishev E. V., Aharonian F. A., Kocharovsky V. V., Kocharovsky V. V., 2003, PhRvD, 68, 043003
- Dermer & Böttcher (2006) Dermer C. D., Böttcher M., 2006, ApJ, 643, 1081
- Donati et al. (2002) Donati J.-F., Babel J., Harries T. J., Howarth I. D., Petit P., Semel M., 2002, MNRAS, 333, 55
- Dubus (2006a) Dubus G., 2006a, A&A, 456, 801
- Dubus (2006b) Dubus G., 2006b, A&A, 451, 9
- Goldoni et al. (2006) Goldoni P., Ribo M., Di Salvo T., Paredes J. M., Bosch-Ramon V., Rupen M., 2006, ArXiv Astrophysics e-prints
- Khangulyan & Aharonian (2005a) Khangulyan D., Aharonian F., 2005a, AIP Conference Proceedings 745, p.359, “High Energy Gamma-Ray Astronomy”, Edited by F. Aharonian, H. Völk, D. Horns, New York: Melville [astro-ph/0503499]
- Khangulyan & Aharonian (2005b) Khangulyan D., Aharonian F., 2005b, Proceedings of the the XLth RENCONTRES DE MORIOND, p.179, “Very High Energy Phenomena in the Universe”, Edited by J. Dumarchez and J. Trân Thanh Vân, Vietnam: The Giói Publishers
- Khangulyan et al. (2007) Khangulyan D., Hnatic S., Aharonian F., Bogovalov S., 2007, MNRAS, 380, 320
- Kirk et al. (1999) Kirk J., Ball L., Skjæraasen O., 1999, Astroparticle Physics, 10, 31
- McSwain et al. (2004) McSwain M., Gies D., Huang W., Wiita P., Wingert D., 2004, Astrophysical Journal, 600, 927
- Maraschi & Treves (1981) Maraschi L., Treves A., 1981, MNRAS, 194, 1P
- Moderski et al. (2005) Moderski R., Sikora M., Coppi P. S., Aharonian F., 2005, MNRAS, 364, 1488
- Moskalenko & Karakula (1994) Moskalenko I. V., Karakula S., 1994, ApJ, 92, 567
- Paredes et al. (2000) Paredes J. M., Martí J., Ribó M., Massi M., 2000, Science, 288, 2340
- Paredes et al. (2002) Paredes J. M., Marti J., Ribo M., Massi M., 2002, Memorie della Societa Astronomica Italiana, 73, 900
- Paredes et al. (2006) Paredes J. M., Bosch-Ramon V., Romero G. E., 2006, ApJ, 451, 259
- Stern (2003) Stern B. E., 2003, MNRAS, 345, 590
- Strong et al. (2001) Strong A. W., Collmar W., Bennett K., Bloemen H., Diehl R., Hermsen W., Iyudin A., Mayer-Hasselwander H., Ryan J., Schönfelder V., 2001, in Ritz S., Gehrels N., Shrader C. R., eds, AIP Conf. Proc. 587: Gamma 2001: Gamma-Ray Astrophysics COMPTEL Observations of a Source in the Direction of the Galactic Centre. pp 21–+
- Tavani & Arons (1997) Tavani M., Arons J., 1997, ApJ, 477, 439
- Usov & Melrose (1992) Usov V. V., Melrose D. B., 1992, ApJ, 395, 575